SOLUSD COMPLETE TRADING PLAN (BUY, SELL, NO-TRADE ZONES)PRICE IS CURRENTLY INSIDE A SUPPLY / SELL ZONE
The light-blue highlighted area is a strong supply zone between:
🔵 Supply Zone (Sell Zone)
146.00 – 149.00
Price has tapped this zone 3 times → weakness for buyers → sellers may take control.
🚫 NO-TRADE ZONE (RIGHT NOW)
The region where price is stuck is:
🚫 No-Trade Zone: 144.00 – 146.00
Reason:
Price is consolidating
Multiple rejections
Both bulls & bears fighting
Not safe for entering until breakout or rejection confirmation
🔥 SELL SETUP (High Probability)
This is the safest setup at the moment.
📍 SELL ENTRY
146.50 – 148.50 (inside the supply zone)
🛑 SL (Stoploss)
150.50
Above previous wick + above the zone.
🎯 TP (Targets)
1️⃣ 140.15
2️⃣ 136.12
3️⃣ 134.84 → strong demand
4️⃣ 130.56 → final target
This gives excellent RR (Reward–Risk).
🟢 BUY SETUP (Only After Breakout)
Don’t buy inside the zone.
Buy only if candles close above the zone.
📍 BUY ENTRY
Above 150.00 (Breakout + Retest)
🛑 SL
147.80
🎯 TP
1️⃣ 153.50
2️⃣ 157.20
3️⃣ 163.94
🟡 BUY SETUP (Pullback Buy)
If price drops to demand zone:
📍 BUY ENTRY ZONE
140.15 – 136.12
🛑 SL
134.00
🎯 TP
1️⃣ 144.00
2️⃣ 146.00
3️⃣ 148.00
📌 SUMMARY
🚫 NO TRADE:
144.00 – 146.00
🔥 SELL SETUP:
Entry: 146.50 – 148.50
SL: 150.50
TP: 140.15 → 136.12 → 134.84 → 130.56
🟢 BUY SETUP (Breakout Buy):
Entry: Above 150
SL: 147.80
TP: 153.50 → 157.20 → 163.94
🟢 BUY SETUP (Demand Buy):
Entry: 140.15 – 136.12
SL: 134
TP: 144 – 146 – 148
Solusdtidea

SOLUSDT is for sell side in short termSOLUSDT if closed below 185.35 then only we can plan for sell side up to 182.35. We can book some qty at 184.35 as TGT 1 . After hitting TGT 1 we can trail SL to 185 and wait for 182.35

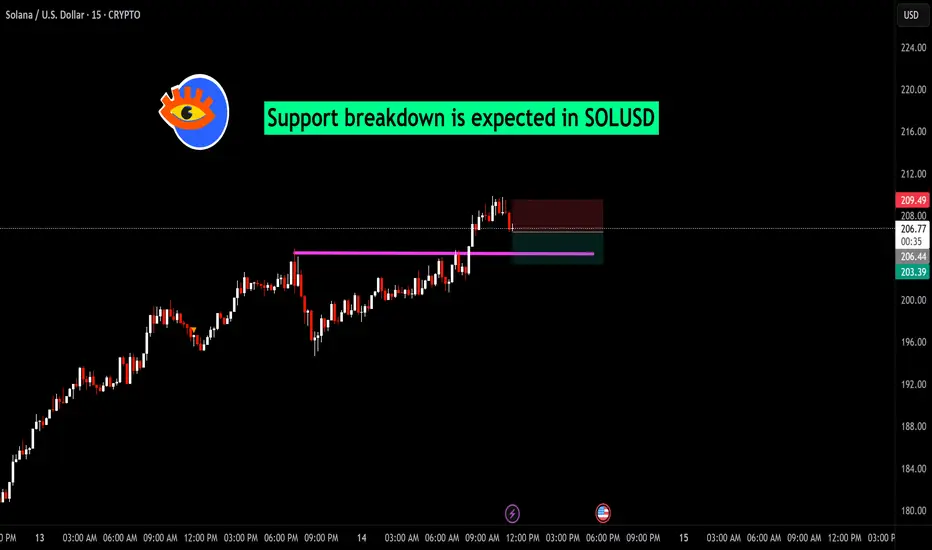
Solana (SOL/USDT) – Short Opportunity on 15-Min ChartSOL/USDT has shown an extended bullish rally, but the recent price action indicates potential short-term exhaustion. On the 15-minute chart, price rejected from the recent high near $209.50, breaking below the immediate support zone and triggering a short setup.
Setup Details:
Entry: Current levels near $206.90
Stop Loss: Above $209.50 (previous swing high)
Target Zone: Around $203.40 (previous support area marked in purple)
This move aligns with an intraday pullback strategy, with risk defined and reward targeting the prior support flip. A decisive break below the purple support line could accelerate downside momentum.
SOL/USDT 1H Chart Analysis – Bullish Reversal Targeting Resistan🚀 SOL/USDT 1H Chart Analysis – Bullish Reversal Targeting Resistance Zone 🎯
📊 Pair: SOL/USDT
🕐 Timeframe: 1H
📈 Platform: Binance
🔍 Technical Overview:
🔵 Support Zone (145.00 – 147.50 USDT)
Price has bounced multiple times from this strong demand zone marked in light blue.
Recent price action shows buyers defending this level aggressively — potential accumulation area. ✅
🔴 Resistance Zone (159.50 – 162.00 USDT)
Marked in red, this zone has historically rejected price twice (confirmed by red & yellow arrows).
Currently, the market is expected to retest this supply area once again. ⚠️
📈 Bullish Pathway:
Current structure suggests a reversal from support, aiming for:
TP1: $150.46
TP2: $154.31
TP3 / Final Target: $160.89 (within resistance)
🔄 Trend Structure:
Price is forming higher lows, hinting at early reversal stages.
Break above $150.46 would confirm bullish momentum. 🟢
🧠 Conclusion:
SOL/USDT is setting up for a bullish reversal from a strong support zone, with targets aligned toward previous resistance. Traders should monitor the reaction at $150.46 and $154.31 — a clean break may propel price to $160.89.
📌 Watch for:
Confirmation candle at support zone
Break and retest patterns on intraday resistance levels
📉 Support: 145.00 – 147.50
📈 Resistance: 159.50 – 162.00
🎯 Bullish Targets: 150.46 → 154.31 → 160.89
🔔 Stay updated, manage risk, and trade wisely! 💹📈

MY ANALYSIS IS HITTING THE TARGET! WHAT A CATCHING VIEW!🎯🔥 MY ANALYSIS IS HITTING THE TARGET! WHAT A CATCHING VIEW! 🔥🎯
✨📈 Everything is playing out as I expected – let’s keep riding this wave! 🌊💹
🚀 SOL/USDT Analysis Update 🚀
📅 Date: June 11, 2025
📊 Timeframe: 4H
✅ Key Zones & Levels:
🟢 Support Level Zone: 144.00 – 147.24
🔴 Resistance Level Zone: 184.00 – 187.99
⚠️ Mini Support/Resistance: Around 160.00
🎯 Current Price Action:
The price has respected my previously marked Support Zone (🟢), resulting in a strong rebound. After forming a bottom at the support level (marked with green arrows), SOL/USDT is now on an impressive upward move.
🟡 The current upward momentum is targeting the Resistance Level Zone near 187.99.
💡 Expected Movement:
If the price approaches the Resistance Zone (🔴), a reversal may occur, creating a potential short-term sell opportunity. Conversely, if it breaks above, we might see further bullish momentum.
🟦 Potential Path:
🔁 Expect a retest of the resistance zone → Possible rejection → Revisit the mini support (~160.00) before a decisive move either back to support or a breakout above 187.99.
💪 Key Takeaways:
Support Zone held strongly, confirming my analysis.
Mini Support/Resistance acts as a pivot for short-term reactions.
Watch closely as the price nears the Resistance Zone – this will be a key area for possible reversals or breakouts.
🔥 Let’s keep an eye on the next moves! Your feedback and thoughts are always welcome. Happy trading! 💪📈

SOL/USDT 4H Chart Analysis📊 SOL/USDT 4H Chart Analysis
🟢 Key Zones:
🔴 Resistance Level Zone:
Marked at approximately 185–188 USDT
Multiple rejections in this area (red arrows 📉), confirming it as a significant supply zone.
🟩 Support Level Zone:
Found around 140–147 USDT
Price has previously bounced off this zone (green arrows 📈), indicating strong demand.
⚖️ Mini Levels:
🟡 Mini Support/Resistance:
Around 157 USDT, previously acted as both support and resistance (yellow box).
Price reacts to this zone during its downtrend and uptrend, highlighting its significance.
🔮 Current Price Action:
The price is currently at 153.36 USDT.
The recent low was just above 140 USDT, confirming a higher low formation.
A small pullback is visible after testing the support zone.
📝 Trade Outlook & Scenarios:
🔵 Bullish Scenario (Main Bias):
If the price maintains above the support zone (140–147 USDT) and breaks the mini resistance (~157 USDT):
Possible continuation towards the resistance zone (185–188 USDT).
Target 🎯 at 187.99 USDT (highlighted in the yellow zone).
🔴 Bearish Scenario:
If the price breaks below the 140 USDT support:
Downward continuation to 132 USDT or lower, as shown in the chart (red zone).
🔧 Risk Management:
🛑 Stop Loss:
Conservative traders: below 140 USDT (red zone 🚨).
Aggressive traders: below the last swing low (~144 USDT).
💡 Professional Takeaway:
✅ Support and resistance zones are well-defined.
✅ Current bounce from support zone suggests a possible reversal.
✅ A break and close above the mini-resistance at 157 USDT would confirm strength.
✅ Risk management and patience are key for this potential upside move.

SOLUSDT - PRE BREAKOUT CONSOLIDATION - BREAKOUT ON THE HORIZON?Symbol - SOLUSDT
CMP - 134.70
SOLUSDT recently exhibited a false breakdown near the lower boundary of its established range. The market responded positively, with price action recovering and consolidating just below a key resistance level.
Bitcoin is also undergoing a consolidation phase. While both Bitcoin and SOL display similar movement patterns, Bitcoin has recently shown stronger correlation with equity markets and appears to be taking the lead.
Currently, SOLUSDT is consolidating below a significant resistance zone around 134.00-136.00, The initial test of this level could result in a minor pullback - potentially toward the 0.5 Fib retracement or continued consolidation near resistance. However, a confirmed breakout followed by sustained price action above this consolidation range would be a constructive signal, indicating potential for further upward movement. It is important to note that a broader trend reversal is not yet in play, the focus remains on short-term price targets at 140, 147, and 152.
Key Resistance levels: 147, 152
Key Support levels: 129, 123, 111
The overall macro trend remains bearish. Locally, the market is neutral, with price moving sideways within a defined range. The recent false breakdown beneath support may indicate a liquidity grab, suggesting the potential for price to move toward upper resistance zones between 147 and 152 in the short term.

SOLANA - BULLISH OUTLOOKSymbol - SOLUSDT
SOLUSDT is currently testing its trend support, with bulls attempting to maintain their position above the intermediate bottom and establish a foothold in the buy zone. Both from a fundamental and technical perspective, SOLUSDT shows promising potential. At present, Bitcoin is in a consolidation phase, which may present an opportunity for strong altcoins to gain momentum.
From a technical standpoint, Solana has touched the trend support and is now attempting to consolidate. Although there remains a possibility of a false breakdown below the trend support before a potential upward move, the primary focus is on the resistance zone between 200 and 203. Should the bulls successfully defend above this range, the coin may experience a further strengthening, with potential targets of 245, 270, and 290 in the medium term.
Key Resistance Levels: 203, 200
Key Support Levels: 188, 182.65
Attention is drawn to the local range boundaries, as the market is currently vying for dominance in the 200-205 zone. Additionally, Bitcoin is forming a local bullish momentum, which could serve as a catalyst for further movement within the broader cryptocurrency market.

Fireball Finance : SQL Breakout - Targeting $350!This weekly chart of SOL/USDT highlights a potential trading setup:
Support Zone: The green zone around $113.74 has shown strong buying interest, acting as a base for the current uptrend.
Fair Value Gap (FVG): A key area around $190-$200, marked in yellow, could serve as a liquidity zone for a possible retracement before resuming the upward move.
Resistance Zone: The red zone near $266 could act as the next significant hurdle. A clean break above this level could confirm bullish momentum.
Target: If the bullish scenario plays out, we may see SOL rally towards the target of $350, as marked in yellow.
Plan:
Watch for price action near the FVG zone. A strong bullish reaction here may offer a good entry point.
Monitor the breakout above the resistance at $266. A confirmed close above this level strengthens the case for reaching the $350 target.
Use appropriate risk management. A stop-loss below the FVG zone or support near $113.74 can help manage downside risk.
This idea is based on the current market structure and should be updated as price action evolves.
Note:
This content is for educational purposes only and is not investment advice. Always conduct your own research and consult with a financial advisor before making investment decisions.

Trading Signal For SOLUSDT SolanaTrading Setup:
A Trading Signal is seen in the SOLUSDT Solana.
Traders can open their Buy Trades NOW
⬆️Buy now or Buy on 30.11
⭕️SL @ 27.15
🔵TP1 @ 37.60
🔵TP2 @ 44.65
🔵TP3 @ 58.65
What are these signals based on?
Classical Technical Analysis
Price Action Candlesticks Fibonacci
RSI, Moving Average , Ichimoku , Bollinger Bands
If you liked our ideas, please support us with your likes 👍 and comments .

SOLANA (SOL) is set for another 10-15% FallSOLANA (SOL) is indicating another 10-15% fall towards 64.18-60.56 from around 69.42-70.81 Range.
Possibility will get negated if SOL closes a complete 5 minutes candle above 70.81.
This Analysis and Trade Setup is based on 38% Retracement Breakout Trading Strategy.
