Solana Technical Reversal: MA Compression Resolves to the UpsideSolana is trading around 126 levels and there is a support which is being respected around 125 levels.
For last few weeks, no considerate candle is there. Only doji are being formed which shows the sideways moment in the charts.
If the market cycle changes, turning bullish, an entry can be made above 127 levels expecting a 10-11% movement in the crypto.
Major trend is bearish, Minor trend sideways.
The major support is around 100-110 level zone and there is not much of fall to capture as it has fallen 50% since Sept 2025.
On the hourly charts, there is a liquidity grab, taking out the bullish positions created on previous occassions.
A moving averages gate is also being created on the hourly charts as all the four EMAs (20, 50, 100 & 200) are moving in small range.
Now as per my view the market is trading in a range and it is also respecting a falling resistance line. A good R:R trade is there on the bullish side.
As per the plan, bullish position can be created in the assest once it crosses 127 levels.
Stop Loss :- 122.5
Target :- 144
R:R = 1:4
Multiple confluence there to enter the trade on the bullish side. Wait for the price action near the levels before entering the trade.
Solusdtlong

SOLUSD COMPLETE TRADING PLAN (BUY, SELL, NO-TRADE ZONES)PRICE IS CURRENTLY INSIDE A SUPPLY / SELL ZONE
The light-blue highlighted area is a strong supply zone between:
🔵 Supply Zone (Sell Zone)
146.00 – 149.00
Price has tapped this zone 3 times → weakness for buyers → sellers may take control.
🚫 NO-TRADE ZONE (RIGHT NOW)
The region where price is stuck is:
🚫 No-Trade Zone: 144.00 – 146.00
Reason:
Price is consolidating
Multiple rejections
Both bulls & bears fighting
Not safe for entering until breakout or rejection confirmation
🔥 SELL SETUP (High Probability)
This is the safest setup at the moment.
📍 SELL ENTRY
146.50 – 148.50 (inside the supply zone)
🛑 SL (Stoploss)
150.50
Above previous wick + above the zone.
🎯 TP (Targets)
1️⃣ 140.15
2️⃣ 136.12
3️⃣ 134.84 → strong demand
4️⃣ 130.56 → final target
This gives excellent RR (Reward–Risk).
🟢 BUY SETUP (Only After Breakout)
Don’t buy inside the zone.
Buy only if candles close above the zone.
📍 BUY ENTRY
Above 150.00 (Breakout + Retest)
🛑 SL
147.80
🎯 TP
1️⃣ 153.50
2️⃣ 157.20
3️⃣ 163.94
🟡 BUY SETUP (Pullback Buy)
If price drops to demand zone:
📍 BUY ENTRY ZONE
140.15 – 136.12
🛑 SL
134.00
🎯 TP
1️⃣ 144.00
2️⃣ 146.00
3️⃣ 148.00
📌 SUMMARY
🚫 NO TRADE:
144.00 – 146.00
🔥 SELL SETUP:
Entry: 146.50 – 148.50
SL: 150.50
TP: 140.15 → 136.12 → 134.84 → 130.56
🟢 BUY SETUP (Breakout Buy):
Entry: Above 150
SL: 147.80
TP: 153.50 → 157.20 → 163.94
🟢 BUY SETUP (Demand Buy):
Entry: 140.15 – 136.12
SL: 134
TP: 144 – 146 – 148

SOLUSDT is for sell side in short termSOLUSDT if closed below 185.35 then only we can plan for sell side up to 182.35. We can book some qty at 184.35 as TGT 1 . After hitting TGT 1 we can trail SL to 185 and wait for 182.35

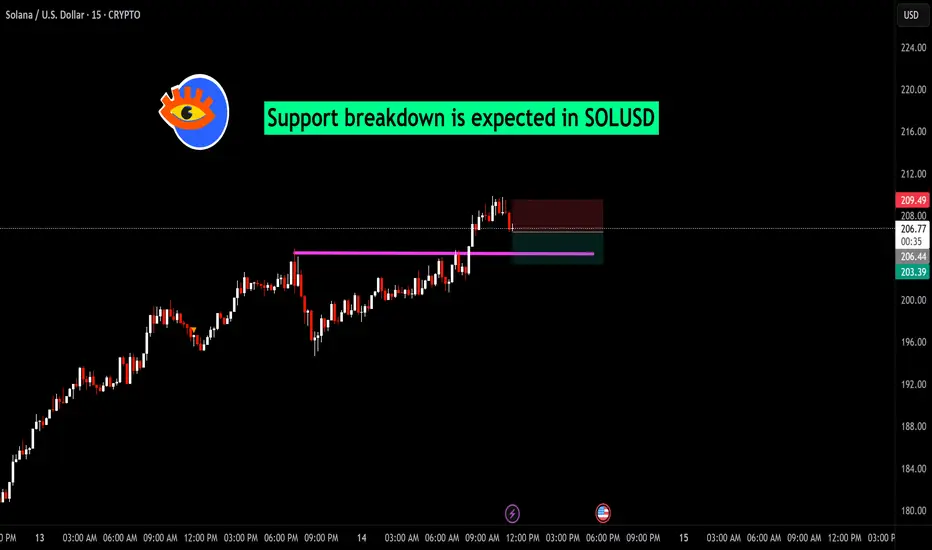
Solana (SOL/USDT) – Short Opportunity on 15-Min ChartSOL/USDT has shown an extended bullish rally, but the recent price action indicates potential short-term exhaustion. On the 15-minute chart, price rejected from the recent high near $209.50, breaking below the immediate support zone and triggering a short setup.
Setup Details:
Entry: Current levels near $206.90
Stop Loss: Above $209.50 (previous swing high)
Target Zone: Around $203.40 (previous support area marked in purple)
This move aligns with an intraday pullback strategy, with risk defined and reward targeting the prior support flip. A decisive break below the purple support line could accelerate downside momentum.
SOL/USDT 1H Chart Analysis – Bullish Reversal Targeting Resistan🚀 SOL/USDT 1H Chart Analysis – Bullish Reversal Targeting Resistance Zone 🎯
📊 Pair: SOL/USDT
🕐 Timeframe: 1H
📈 Platform: Binance
🔍 Technical Overview:
🔵 Support Zone (145.00 – 147.50 USDT)
Price has bounced multiple times from this strong demand zone marked in light blue.
Recent price action shows buyers defending this level aggressively — potential accumulation area. ✅
🔴 Resistance Zone (159.50 – 162.00 USDT)
Marked in red, this zone has historically rejected price twice (confirmed by red & yellow arrows).
Currently, the market is expected to retest this supply area once again. ⚠️
📈 Bullish Pathway:
Current structure suggests a reversal from support, aiming for:
TP1: $150.46
TP2: $154.31
TP3 / Final Target: $160.89 (within resistance)
🔄 Trend Structure:
Price is forming higher lows, hinting at early reversal stages.
Break above $150.46 would confirm bullish momentum. 🟢
🧠 Conclusion:
SOL/USDT is setting up for a bullish reversal from a strong support zone, with targets aligned toward previous resistance. Traders should monitor the reaction at $150.46 and $154.31 — a clean break may propel price to $160.89.
📌 Watch for:
Confirmation candle at support zone
Break and retest patterns on intraday resistance levels
📉 Support: 145.00 – 147.50
📈 Resistance: 159.50 – 162.00
🎯 Bullish Targets: 150.46 → 154.31 → 160.89
🔔 Stay updated, manage risk, and trade wisely! 💹📈

MY ANALYSIS IS HITTING THE TARGET! WHAT A CATCHING VIEW!🎯🔥 MY ANALYSIS IS HITTING THE TARGET! WHAT A CATCHING VIEW! 🔥🎯
✨📈 Everything is playing out as I expected – let’s keep riding this wave! 🌊💹
🚀 SOL/USDT Analysis Update 🚀
📅 Date: June 11, 2025
📊 Timeframe: 4H
✅ Key Zones & Levels:
🟢 Support Level Zone: 144.00 – 147.24
🔴 Resistance Level Zone: 184.00 – 187.99
⚠️ Mini Support/Resistance: Around 160.00
🎯 Current Price Action:
The price has respected my previously marked Support Zone (🟢), resulting in a strong rebound. After forming a bottom at the support level (marked with green arrows), SOL/USDT is now on an impressive upward move.
🟡 The current upward momentum is targeting the Resistance Level Zone near 187.99.
💡 Expected Movement:
If the price approaches the Resistance Zone (🔴), a reversal may occur, creating a potential short-term sell opportunity. Conversely, if it breaks above, we might see further bullish momentum.
🟦 Potential Path:
🔁 Expect a retest of the resistance zone → Possible rejection → Revisit the mini support (~160.00) before a decisive move either back to support or a breakout above 187.99.
💪 Key Takeaways:
Support Zone held strongly, confirming my analysis.
Mini Support/Resistance acts as a pivot for short-term reactions.
Watch closely as the price nears the Resistance Zone – this will be a key area for possible reversals or breakouts.
🔥 Let’s keep an eye on the next moves! Your feedback and thoughts are always welcome. Happy trading! 💪📈

SOL/USDT 4H Chart Analysis📊 SOL/USDT 4H Chart Analysis
🟢 Key Zones:
🔴 Resistance Level Zone:
Marked at approximately 185–188 USDT
Multiple rejections in this area (red arrows 📉), confirming it as a significant supply zone.
🟩 Support Level Zone:
Found around 140–147 USDT
Price has previously bounced off this zone (green arrows 📈), indicating strong demand.
⚖️ Mini Levels:
🟡 Mini Support/Resistance:
Around 157 USDT, previously acted as both support and resistance (yellow box).
Price reacts to this zone during its downtrend and uptrend, highlighting its significance.
🔮 Current Price Action:
The price is currently at 153.36 USDT.
The recent low was just above 140 USDT, confirming a higher low formation.
A small pullback is visible after testing the support zone.
📝 Trade Outlook & Scenarios:
🔵 Bullish Scenario (Main Bias):
If the price maintains above the support zone (140–147 USDT) and breaks the mini resistance (~157 USDT):
Possible continuation towards the resistance zone (185–188 USDT).
Target 🎯 at 187.99 USDT (highlighted in the yellow zone).
🔴 Bearish Scenario:
If the price breaks below the 140 USDT support:
Downward continuation to 132 USDT or lower, as shown in the chart (red zone).
🔧 Risk Management:
🛑 Stop Loss:
Conservative traders: below 140 USDT (red zone 🚨).
Aggressive traders: below the last swing low (~144 USDT).
💡 Professional Takeaway:
✅ Support and resistance zones are well-defined.
✅ Current bounce from support zone suggests a possible reversal.
✅ A break and close above the mini-resistance at 157 USDT would confirm strength.
✅ Risk management and patience are key for this potential upside move.

Solana Technical Commentary on Bullish Rally (SPOT ETF APPROVAL)- Solana is currently trading at 165$
- Solana can be the next Money Printer
- Solana could be the next one to rally because SOL Spot ETFs may get approved by the SEC next month according to Bloomberg
- Bloomberg has mostly been accurate on past SPOT ETF approval calls
- Solana has a higher transaction volume with minimal congestion and low fees.
- Technically, I see the 140-150$ range as an OTE and once Solana breaks above 180$ I will wait for a pullback before adding more size
- Betting Big on Solana looks highly rewarding from a structure perspective 250$ looks easy by the end of Q4

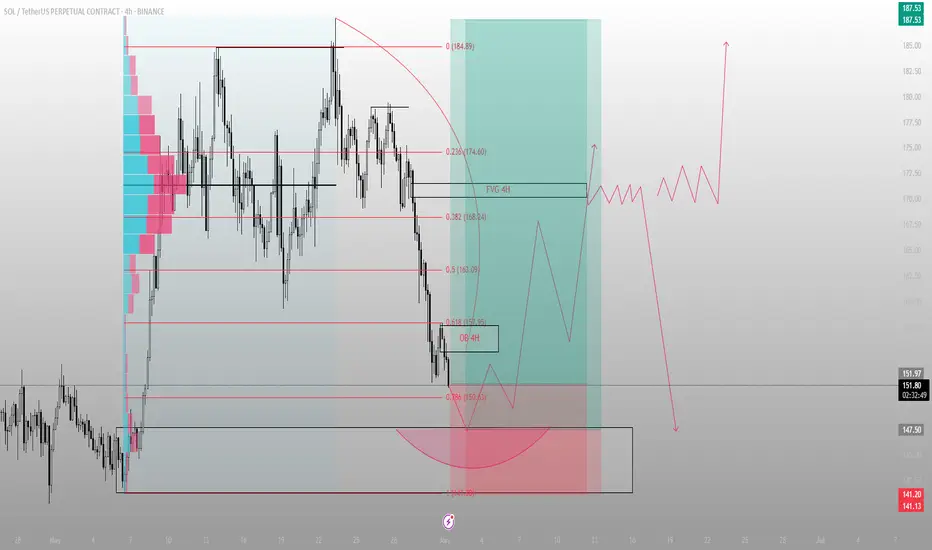
Liquidity tagged. Sentiment shaken. Now the real move begins.SOL just kissed the 0.786 retracement at 150.6 — and did so with precision, not hesitation.
Below that sits a 4H OB that hasn’t been touched since the impulse leg began. That zone, now swept, resets the auction. We’ve completed the delivery cycle down, and Smart Money is reloading while the herd panics.
The rejection from this OB aligns with a thin LVN pocket — a classic bounce zone for engineered reaccumulation. From here, I’m watching for expansion into the inefficiency above: the 4H FVG at 174.6. That’s the draw.
Structure shows that the 163–168 zone (0.5 to 0.382) will act as a decision shelf. If price respects that as a new support, this entire move becomes the foundation for a higher macro expansion into 185+.
If we fail? The resting liquidity at 141 is still untouched.
Execution bias:
🟩 Bid zone: 150.6–147.5 (OB + 0.786)
🎯 Target 1: 163.09
🎯 Target 2: 174.6 (4H FVG)
❌ Invalidation: Full body breakdown below 141.13
This isn’t about catching a bounce.
It’s about understanding where Smart Money needs to rebalance.
I don’t trade candles. I trade consequences.
SOLUSDT - PRE BREAKOUT CONSOLIDATION - BREAKOUT ON THE HORIZON?Symbol - SOLUSDT
CMP - 134.70
SOLUSDT recently exhibited a false breakdown near the lower boundary of its established range. The market responded positively, with price action recovering and consolidating just below a key resistance level.
Bitcoin is also undergoing a consolidation phase. While both Bitcoin and SOL display similar movement patterns, Bitcoin has recently shown stronger correlation with equity markets and appears to be taking the lead.
Currently, SOLUSDT is consolidating below a significant resistance zone around 134.00-136.00, The initial test of this level could result in a minor pullback - potentially toward the 0.5 Fib retracement or continued consolidation near resistance. However, a confirmed breakout followed by sustained price action above this consolidation range would be a constructive signal, indicating potential for further upward movement. It is important to note that a broader trend reversal is not yet in play, the focus remains on short-term price targets at 140, 147, and 152.
Key Resistance levels: 147, 152
Key Support levels: 129, 123, 111
The overall macro trend remains bearish. Locally, the market is neutral, with price moving sideways within a defined range. The recent false breakdown beneath support may indicate a liquidity grab, suggesting the potential for price to move toward upper resistance zones between 147 and 152 in the short term.

SOLANA - BULLISH OUTLOOKSymbol - SOLUSDT
SOLUSDT is currently testing its trend support, with bulls attempting to maintain their position above the intermediate bottom and establish a foothold in the buy zone. Both from a fundamental and technical perspective, SOLUSDT shows promising potential. At present, Bitcoin is in a consolidation phase, which may present an opportunity for strong altcoins to gain momentum.
From a technical standpoint, Solana has touched the trend support and is now attempting to consolidate. Although there remains a possibility of a false breakdown below the trend support before a potential upward move, the primary focus is on the resistance zone between 200 and 203. Should the bulls successfully defend above this range, the coin may experience a further strengthening, with potential targets of 245, 270, and 290 in the medium term.
Key Resistance Levels: 203, 200
Key Support Levels: 188, 182.65
Attention is drawn to the local range boundaries, as the market is currently vying for dominance in the 200-205 zone. Additionally, Bitcoin is forming a local bullish momentum, which could serve as a catalyst for further movement within the broader cryptocurrency market.

SOL(USDT) about to create a New HighsHello Traders,
Solusdt is Currently on a Time based correction Mode & now the coin has taken support of 100EMA & aslo the Higher timeframe bullish Rsi Signals & lastly the Volume confirmations
.

SOL Eyes 40% Surge: Strong Technical PatternsKey Observations:
1. All-Time High (ATH): Marked at 259.59, indicating a significant resistance level.
2. Bullish Patterns Identified:
• Higher High (HH) and Higher Low (HL) Structure:
• This indicates a bullish market structure where price is making consistent higher highs and higher lows.
• Fair Value Gap (FVG):
• An imbalance or inefficiency in the price that could act as a magnet for price to revisit before continuation.
• Bullish Triangle Pattern:
• Suggests price consolidation within narrowing ranges, typically preceding a breakout to the upside.
3. Support Zone:
• A green box around the 175–180 region shows a strong demand zone where price could reverse upward if retested.
Projection:
• A breakout is expected either towards the resistance zone (near ATH) or lower if the support fails.
Actionable Steps:
• For Bulls:
• Watch for bullish confirmation (e.g., bullish engulfing candles) near the FVG/support zone.
• Target the ATH as the first major resistance, with a potential breakout higher.
• For Bears:
• Monitor price action for a break below 175. This could signal bearish momentum towards lower price targets.
DISCLAIMER- THIS IS FOR EDUCATIONAL PURPOSES ONLY, PLEASE DO YOUR RESEARCH BEFORE INVESTING

Solana Next Target is 174 USD, Gain +20% ProfitIn Solana, Triangle Pattern formed and Expecting Breakout. So Next Target is Top of the Triangle Pattern, Target price is around 174 USD. Potential to Achieve a +20% percentage Profit.
I want to help people to Make Profit all over the "World".

Solana Swing Long Update - Solana is currently trading at 147.6$
- Solana is up 15% from my call out
- Solana can easily purge 160$ and above
- There are 2 paths that Solana can follow first where we see it retracing back to 135-140$ and the moving above with more strength, second path where we see it moving up to 160$ without a stop and the retrace back
- I will wait for Solana to revisit 135-140$ and that's where my first point of interest lies

next future target of #sol# what i predict and follow next future target of sol what i predict and follow as you can see the market with high volume so we can go for next target of sol within few months.... on the basis of these inverted head and shoulder patterns.......

SOL/USDT:-A Bearish Swing leading to Long-Term Buying ?SOL/USDT:- Anticipating a Bearish Swing for Long-Term Buying Opportunity
Introduction:
In this SOL/USDT technical analysis, we'll delve into the current market conditions, potential price movements, and identify an attractive long-term buying opportunity within the cryptocurrency pair.
Liquidity Swipe Area:
Our analysis suggests that SOL/USDT may experience a liquidity swipe area around the $20.620 mark. This area could act as a pivotal point where price manipulation traps buyers before a potential fall.
Anticipated Price Decline:
We foresee SOL/USDT's price declining to the range of $12 to $14.
Traders may consider this potential dip as an opportunity to capitalize on short-term moves and manage risk accordingly.
Long-Term Buying Opportunity:
For those with a long-term perspective, the $12 to $14 price zone holds promise as a buying opportunity. Cryptocurrency markets are known for their volatility, and strategic accumulation in this range could position investors for substantial capital gains over time.
By keeping a watchful eye on these key levels and executing well-informed trades, you can navigate the dynamic cryptocurrency market with confidence.

SOL/USDT: Inverse Head & Shoulders Sparks Bullish Buzz!💎 Hey Paradisers, let's shift our focus to SOL/USDT. On the 1-hour chart, it's shaping up an inverse head and shoulder pattern, hinting at a possible bullish turnaround.
💎 Should SOL/USDT successfully breach the neckline and overcome the 26.06 supply barrier, we could be in for an upward ride with potential resistance levels at 27.22, 28.47, and 29.09. But, if it struggles to break out and slips below the critical 23.91 level, this pattern might lose its validity.
💎Stay sharp and trade smart, ParadiseSquad!

SOL/USDT:-Potential Bullish Reversal , Price Tests Key Support ?
In this technical analysis, we'll examine the recent price action of SOL/USDT, focusing on crucial support and resistance levels.
Buying Area and Expected Price Movement:
SOL/USDT has found notable support within the range of 23.50 to 24.
Traders should closely monitor this range, as it presents an optimal buying opportunity.
Bullish Signal Confirmation:
A significant sign of bullish strength is the scenario where the price breaches the lower boundary of the range, only to be reclaimed by buyers shortly afterward.
This suggests strong buying interest and the potential for an upcoming bullish reversal.
The SOL/USDT technical analysis suggests a potentially bullish scenario as the price tests the critical support range of 23.50-24. Traders should be watchful for a bounce towards the 26-27 levels. The bullish strength demonstrated by the price reclaiming the lower boundary of the range further supports this anticipated reversal.
Follow our TradingView profile for more insights into SOL/USDT and other trading opportunities.

THIS IS SOLANA TETHERUS.On 4H as you see after every BOS I marked an POI to captured a good trade. As you see second POI is Mitigate with BIG RED CANDLES. Now it's time for long 1:3 If I booked with loss means if I exit market after touched of SL or price crossed my SL and went DOWN then there is my first POI which I already created.
First HIGH @26.869 with small body and big wicks.
Second HIGH @27.150 with small body and big wicks and got rejection from that area.
LETS SEE IF ITS WORK'S OR NOT!
CORRECT ME IF I'M WRONG!!!

SOLANA PRICE PREDICTION 2022An ascending channel is defined as the price action contained between two parallel upward-sloping lines. This price pattern is distinguished by higher highs and lower lows. An ascending channel is created by drawing a lower trend line that connects the swing lows and an upper channel line that connects the swing highs.
Price does not always remain entirely formed within the parallel lines of an ascending channel, but instead shows areas of support and resistance that traders can use to set stop-loss orders and profit targets. A breakout above an ascending channel may indicate a continuation of the upward trend, whereas a breakdown below an ascending channel may indicate a change in trend.
Currently, Solana (SOL) is at $36.18. If the pattern continues, the price of SOL might reach the resistance level of $46.85, and $68.31. If the trend reverses, then the price of SOL may fall to $32.29, and $25.67
Solana (SOL) Support and Resistance Levels
From the above daily time frame, we can clearly interpret the following as the resistance and support levels of Solana (SOL).
Resistance Level 1 – $42.78
Resistance Level 2 – $58.60
Resistance Level 3 – $82.70
Resistance Level 4 – $117.60
Support Level – $26.67
The charts show that SOL has performed a bullish trend over the past month. If this trend continues, SOL might run along with the bulls overtaking its resistance level at $117.60.
Accordingly, if the investors turn against the crypto, the price of the SOL might plummet to almost $26.67, a bearish signal.
Happy Trading !


