XAUUSD 1H📍 XAUUSD – 1H Key Levels
🔹 Support Zones
$1925 – $1927 → Immediate intraday support
$1918 – $1920 → Stronger short-term support
$1910 – $1912 → Major support zone, breakdown could trigger deeper fall
🔹 Resistance Zones
$1935 – $1937 → First intraday resistance
$1945 – $1947 → Strong resistance area where sellers may re-enter
$1955 – $1960 → Major resistance; breakout above this can fuel a larger rally
⚖️ Quick Summary
Above $1935, bulls may push toward $1945 – $1960.
Below $1920, bears could drag price back to $1910 – $1900.
Range to monitor: $1920 – $1935 (decisive breakout will set next trend).
XAUUSD (Gold) – 1H Chart Analysis
🔹 Trend Overview
On the 1-hour chart, XAUUSD is currently showing short-term bullish bias but with nearby resistance.
Price action is making higher lows, but upside moves are facing supply zones.
🔹 Key Levels to Watch
Immediate Support Zone: $1918 – $1922
Major Support: $1910 – $1912
Immediate Resistance Zone: $1935 – $1940
Stronger Resistance: $1950
🔹 Indicators (1H Chart)
Moving Averages → Price trading above 20 EMA and near 50 EMA, showing short-term strength.
RSI (Relative Strength Index) → Around 60–65, leaning bullish but not overbought.
MACD → Positive crossover, momentum favoring buyers.
Volume → Buying volume spikes at dips, showing accumulation.
🔹 Intraday Trading Scenarios
Bullish Case
If price sustains above $1935, upside can extend to $1945 – $1950.
Breakout above $1950 opens path toward $1960+.
Bearish Case
If price drops below $1922, retracement towards $1912 – $1910 is possible.
Strong breakdown below $1910 may test $1900.
🔹 Summary
Bias: Mildly Bullish (as long as above $1920 support)
Support Levels: $1922 / $1910
Resistance Levels: $1935 / $1950
Traders should watch the $1920 – $1935 zone for the next decisive move.
Spread

Short Gail for the targets of 84 and 78Gail is at the support and
Bollinger Bands are squeezed and the breakdown of the lower band.
Macd is Bearish Crossover
RSI is below 40
So short near the close of the candle for the targets of 84 and 78.

AAPL good for Swing Trade- Swing High / ATH / Monthly Pivot R1 Breakout
- Good Breakout Volume
- Outperforming S&P500 in 3m & 6m TF
- Spread Chart Breakout
- Good Q2 Results posted by AAPL
Good opportunity for a swing trade

NIFTY Volume Spread Analysis: Whats Happening ? Commentry
The market Started the October Series, with a (1.Low Volatility Test Reversal)
Then It Formed a (2. Potential Trend Change) Pattern
Made a retest for 17500 at (3. Effort Up) and (4. Effort Down)
And Till Today have given two positive Followups (5. and 6.)
So What is the Dominant Direction Here?
For me Logically is the Long Side
How i think prices will move with smart money ?
In the coming next week Market is on high probability to reTest 18300 and 18300,

TCS Strategy creation explained ahead of its resultsIn this video, I share how I have created in excel TCS Bull Call Spread and TCS ATM Short Straddle.
I have explained all that is needed for the purpose of creating the strategies.
Please note that I may / may not execute the trade depending upon how the funds position is closer to the day end.
If you have liked the video, please let me know and if you feel something else needs to be included, please feedback on the same.
Best wishes,
Umesh

Oil History - Based on Spread USOIL & UKOILOil History - Based on Spread USOIL & UKOIL
How the spread has reacted during difference phase of Geopolitics of oil life in last 2 decades.

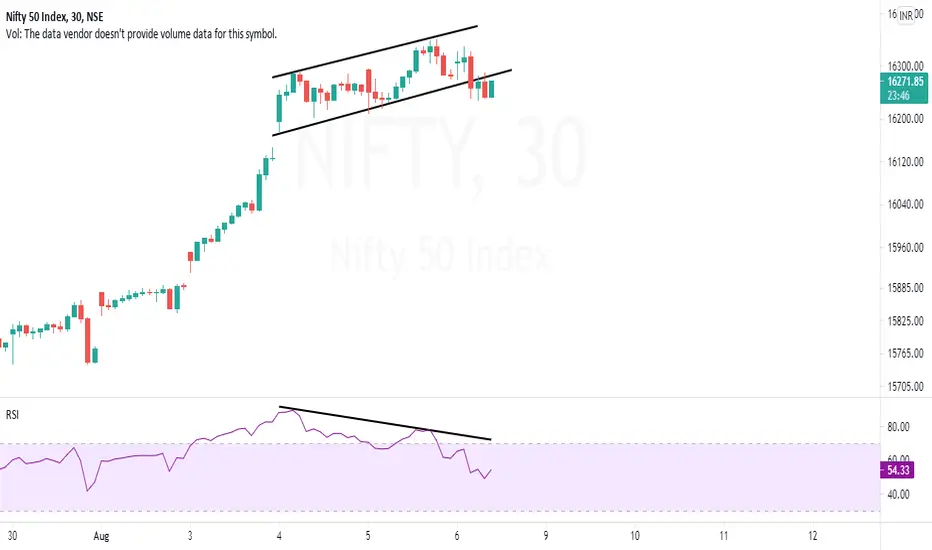
NIFTY | RSI divergence - Expecting a 100-150 points correctionNIFTY | RSI divergence - Expecting a 100-150 points correction (Credit Spread)
CMP : 16270
SL : 16320
Target : 16150,16100
Please only do Hedged positions if trading this setup.
Sell 16300 CE
Buy 16500 CE
VSSL looking good Positionally1. Stock in Continous uptrend.
2. Relative Strength Strong & increasing.
3. Stock crossed All Time High (2017) of 195.15 and was consolidating after multi-year Breakout.
4. Spread chart Breaking out.
5. Accumulative positive volume activity during consolidation.
6. Good Q1 numbers.
7. Stock is up today when most of the Nifty & Mid-cap stocks are in Red.


NIFTY | Bullish returning again for 300 points?NIFTY | Bullish returning again
CMP : 15039
SL : 14975
Target : 15350
Safe to create spread
Buy 15100 CE
Sell 15300 or 15400 CE

RELIANCE | Expecting breakout it is having some decent supportRELIANCE | Expecting breakout as it is having some decent support | Lets experiement a limited risk option spread similar to what we did in BANKNIFTY
CMP : 2060
SL : 2000
Target : 2170,2335
Since RELIANCE is strong and heavy weight stock its worth trying F&O if you are aggressive trader.
Buy 2100 CE
Sell 2150 CE or 2200 CE

Call Spread here. bought 8100 ce and sold 3x 8400 ce Nifty highly oversold. a nominal bounce will get us in green
