A New World without the US Dollar at the helm?Civilizations halt.
Empires fall.
New worlds and new world orders are built on the ruins of older greats.
Is this the slow decline of the largest empire known to mankind?
Whatever happens, I wish it happens over the next 50 years so I can be here to witness the shift in awe.
Technically speaking, US Dollar has been in a long term uptrend channel since 2008 and this channel is now seriously being tested and is at a risk of being violated. What is interesting is this isn't just a technical move, this is a move backed by a fundamental shift in Global order.
How will the world look like if US is not at the helm? Only time will tell.
see you later—ciao!
S&P 500 (SPX500)

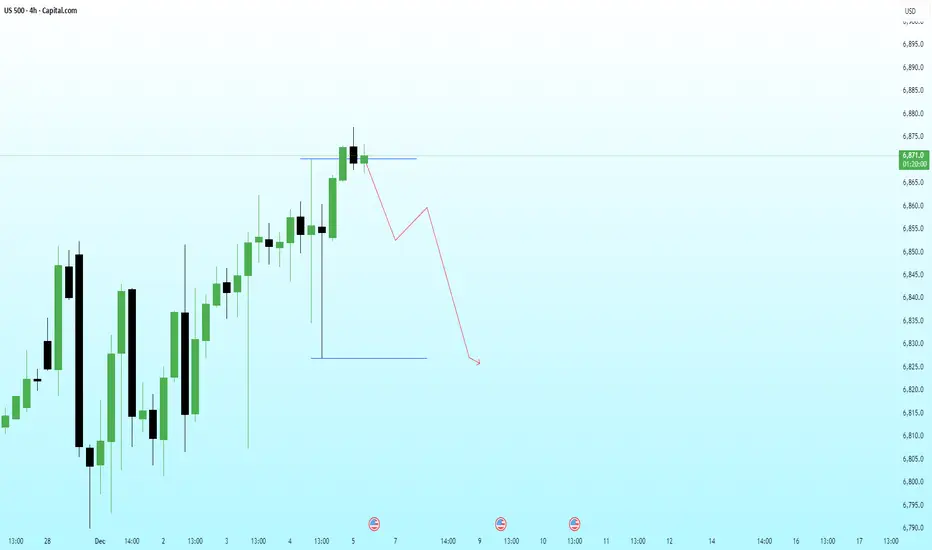
US500 – Liquidity Sweep at the Highs With Bearish Continuation PPrice has swept the immediate buy-side liquidity sitting above the recent high and is already showing signs of exhaustion. The reaction suggests a possible distribution phase forming near the top, aligning with the broader HTF narrative for a corrective leg.
If price fails to reclaim the swept high, the next logical target becomes the sell-side liquidity resting at the lower blue line.
Bearish Path:
• Sweep of the highs
• Failure to sustain above the level
• LTF shift into bearish structure
• Continuation toward downside liquidity + imbalance fill
⚠️ ENTRY CONDITION (IMPORTANT):
I will execute this trade only if the LTF replicates the structural behavior I expect from the HTF.
No LTF confirmation = No trade.
#XAUUSDGOLD start it's correct from 22 April 2025 ,and complete a flat correction on 15 may 2025 , after that the price rise but not able to cross the high of B wave ,so it enter in a complex correction and form a X wave on 16 jun 2025 and make its A wave on 30 june 2025 , and rice to B wave and forming a double flat correction .the price is now in its C wave and expected to come lower to the level of 3200-3100.We can put over SL to the high of B wave.

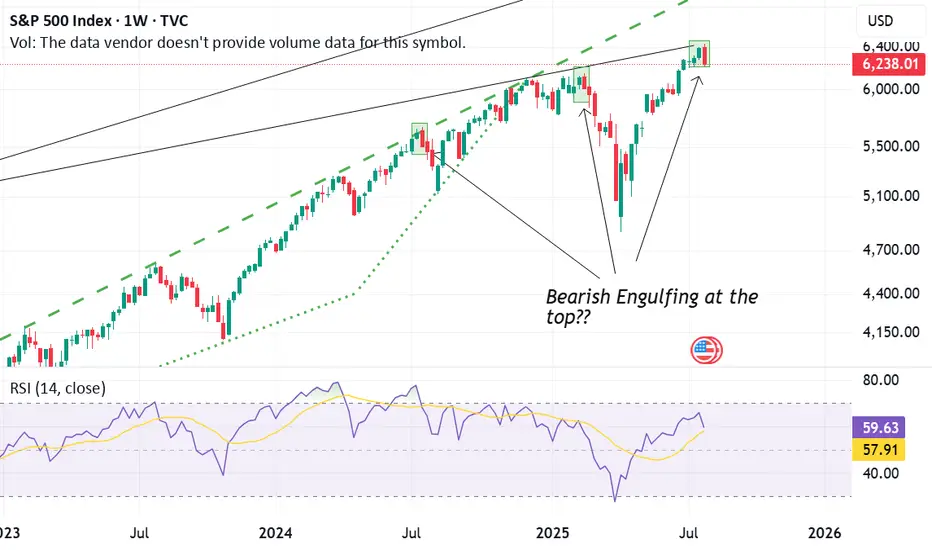
SPX forms a bearish engulfing candle again Last week, the S&P 500 Index (SPX) printed a bearish engulfing candle on the weekly chart. This candlestick pattern occurs when a larger red (bearish) candle completely "engulfs" the body of the previous green (bullish) candle. It is a classic reversal signal, often indicating that the momentum may be shifting from bullish to bearish.
What makes this significant is the recurring pattern we've observed:
At each of the last three market tops, the SPX formed a bearish engulfing pattern—and each time, this was followed by a notable correction or pullback.
The current candle mirrors those past setups almost identically, suggesting that the market may again be vulnerable to a short-term decline.
However, the big question remains:
"Will this time be different?"
In short, the bearish engulfing pattern is a warning sign—especially given its historical reliability at tops—but confirmation is key.
Ask ChatGPT
Technical Analysis Mastery🧠 What is Technical Analysis?
Technical Analysis (TA) is the skill of analyzing price charts and patterns to predict future movements of stocks, indices, commodities, forex, or cryptocurrencies. It’s like reading the mood and psychology of the market by observing price and volume.
Instead of studying company balance sheets or industry trends (that’s fundamental analysis), technical analysis assumes that everything important is already reflected in the price. It’s used by intraday traders, swing traders, and even investors to make smarter entries and exits.
📚 The Core Principle of Technical Analysis
There are three main beliefs that form the base of technical analysis:
Price Discounts Everything
All news, emotions, expectations, and fundamentals are already priced into the chart. So, instead of worrying about inflation or earnings, a technical analyst looks at price action.
Price Moves in Trends
Markets don’t move randomly. They trend – either up, down, or sideways. TA helps you identify the direction of the trend and when it might be changing.
History Repeats Itself
Market behavior is repetitive because human psychology is repetitive. Fear and greed create familiar patterns. Candlestick patterns, chart patterns, and indicators are all built on this belief.
🧭 Types of Market Trends
To master technical analysis, you need to understand trends first:
📈 Uptrend (Bullish): Higher highs and higher lows.
📉 Downtrend (Bearish): Lower highs and lower lows.
➡️ Sideways (Range-bound): Price moves within a horizontal range.
Your first job as a technical analyst is to identify the current trend. Once you know this, your job becomes easier:
Buy in an uptrend, sell in a downtrend, stay cautious in a sideways market.
📊 Reading Price Charts (The Visual Language)
The chart is your battlefield. Let’s break down the types:
1. Line Chart
Shows the closing price over time.
Clean and simple, but lacks detail.
2. Bar Chart
Shows open, high, low, close (OHLC).
More informative than a line chart.
3. Candlestick Chart (Most Popular)
Shows OHLC in a visually rich format.
Green (or white) candles = price went up.
Red (or black) candles = price went down.
Candlesticks reveal trader emotions and help spot patterns like Doji, Hammer, Engulfing, etc.
🔍 Support & Resistance – The Foundation
Support = A price level where demand is strong enough to stop the price from falling further.
Resistance = A level where selling pressure prevents the price from rising.
Imagine support as a floor and resistance as a ceiling. Once broken, these levels often flip roles (old resistance becomes new support).
Example:
If Nifty keeps bouncing back from 21,000 – it’s a support zone.
If it keeps failing near 22,000 – that’s resistance.
✍️ Chart Patterns – Visual Clues to Price Moves
Chart patterns are shapes formed by price on a chart, often signaling upcoming moves.
✅ Continuation Patterns
Price will likely continue in the same direction.
🔺 Flag & Pennant
🔻 Triangle (Symmetrical, Ascending, Descending)
📦 Rectangle
🔄 Reversal Patterns
Suggests trend may reverse.
👨🦲 Head and Shoulders
🧍♂️ Double Top / Bottom
🛑 Rounding Top / Bottom
These patterns help you plan trades with entry, stop loss, and target.
🧠 Candlestick Patterns – Market Psychology in Action
Candlestick patterns show short-term momentum and emotion.
🔥 Bullish Candles
Hammer: Long wick at bottom – buyers stepping in.
Bullish Engulfing: Green candle swallows previous red one.
Morning Star: A 3-candle reversal pattern.
🧊 Bearish Candles
Shooting Star: Long wick at top – sellers taking over.
Bearish Engulfing: Red candle engulfs previous green one.
Evening Star: Opposite of Morning Star.
Candlestick mastery = understanding buyer vs seller fight in every candle.
🧰 Indicators & Oscillators – Your Technical Tools
Indicators are formulas applied to price data to give more insight.
🛣️ Trend Indicators
Moving Averages (MA):
SMA: Simple Moving Average.
EMA: Exponential (gives more weight to recent price).
Used to identify and confirm trends.
MACD (Moving Average Convergence Divergence):
Measures momentum and crossover signals.
Parabolic SAR:
Gives entry/exit dots on chart.
📉 Momentum Indicators (Oscillators)
RSI (Relative Strength Index):
Measures overbought (>70) or oversold (<30).
Stochastic Oscillator:
Shows momentum, good for spotting reversal zones.
CCI (Commodity Channel Index):
Helps detect cyclical trends.
These are tools to confirm what you see on price action – never trade based on indicators alone.
🧪 Volume – The Fuel Behind Moves
Volume tells you how strong or weak a price move is.
Rising volume + rising price = strong uptrend.
Low volume + breakout = fakeout risk.
Volume spike at support/resistance = possible reversal or breakout.
Smart traders always watch volume with price action. It shows institutional interest.
🧱 Building a Trading Setup (Strategy Framework)
A solid technical trading setup has:
Market Context (Trend, Sentiment)
Entry Trigger (Pattern, Indicator, Breakout)
Stop Loss Level (Support/Resistance, ATR, Swing High/Low)
Target (Risk:Reward ratio, Resistance/Support, Fibonacci)
Volume Confirmation
Risk Management Plan
🧠 Psychological Mastery in TA
Even the best technical setup can fail without the right mindset.
Stick to Plan: Don’t react emotionally.
Accept Losses: TA gives probabilities, not guarantees.
Avoid Overtrading: Quality > Quantity.
Backtest Your Strategies: Practice builds confidence.
Mastering TA is not just about charts – it’s about mastering yourself.
🧪 Advanced Concepts in Technical Analysis
Once you’re comfortable with the basics, explore:
🔁 Fibonacci Retracement & Extensions
📏 Average True Range (ATR) for volatility
📈 Ichimoku Cloud for trend + momentum
🔎 Multi-Time Frame Analysis
🔄 Divergence (RSI/Price divergence for reversal signals)
These tools help fine-tune entries and exits.
🧩 Common Mistakes in Technical Analysis
Avoid these traps:
Trading every breakout – wait for confirmation.
Ignoring the trend – don’t go against it.
Using too many indicators – analysis paralysis.
Revenge trading – leads to big losses.
Disrespecting stop loss – small loss can become disaster.
✅ How to Master Technical Analysis?
Learn from real charts – theory alone won’t help.
Practice Daily – track 1-2 instruments closely.
Journal Your Trades – analyze what worked/failed.
Backtest Setups – check success over historical data.
Follow Experts – learn from professional TA traders.
Join Communities – share and get feedback.
Consistency is the key to mastery. 📈
🧠 Final Thoughts: Why Technical Analysis Works
Because humans behave in predictable patterns, and TA captures those behaviors in charts. Whether it’s fear of missing out or panic selling, the psychology leaves footprints on price action.
You don’t need to predict the future. You need to react smartly to what the chart is telling you.
Mastering technical analysis takes time, patience, and lots of screen time – but once you get it, it becomes a powerful edge in the market.
Institutional Trading Strategies🔍 What Is Institutional Trading?
Institutional trading refers to how large financial institutions, such as hedge funds, investment banks, mutual funds, insurance companies, and pension funds, buy and sell large volumes of stocks, options, futures, and other financial instruments in the market.
Unlike retail traders (individual traders), institutions trade with massive capital, often in millions or billions of dollars. Their actions can move the market, and they use advanced tools, data, and strategies to protect their capital and maximize profit.
🏦 Who Are the Institutional Players?
Here are examples of institutional traders:
BlackRock
Vanguard
JP Morgan
Goldman Sachs
Citadel
Morgan Stanley
HDFC AMC / SBI MF (India context)
These entities manage huge portfolios for clients or for themselves and use highly strategic methods to execute trades.
⚙️ Why Are Their Strategies Different?
Institutional traders have several advantages over retail traders:
Access to better data (real-time order flow, economic models)
Advanced technology (high-frequency trading algorithms)
Lower transaction costs (thanks to bulk volume deals)
Connections (direct access to liquidity providers, brokers)
Skilled teams (analysts, quant traders, risk managers)
But there’s a big challenge: Their trades are so large, they can’t buy or sell in one go. If they do, they’ll cause huge price moves (called slippage). So they use smart strategies to enter and exit positions quietly without alerting the market.
🧠 Core Institutional Trading Strategies
Here are the most important trading strategies used by institutions:
1. 📊 Volume-Based Trading (Accumulation & Distribution)
Institutions use a strategy of accumulating large positions over time (buying slowly) and later distributing (selling slowly). This is done to hide their true intent from the market.
Accumulation Phase: Buying gradually in small chunks to avoid price spikes.
Distribution Phase: Selling in a quiet way so they don’t crash the price.
They might accumulate shares for weeks or months, often using dark pools or algorithms to keep their activity hidden.
2. 🏦 Order Flow Analysis / Tape Reading
Institutional traders track real-time order flow — meaning they study the buy/sell pressure using tools like:
Level 2 (market depth)
Time & sales (ticker tape)
Footprint charts
Delta volume
They watch where large orders are being placed, pulled, or spoofed, giving insight into what other big players are doing.
3. 💻 Algorithmic & High-Frequency Trading (HFT)
Institutions use algorithms (algos) to place thousands of trades per second. These bots follow specific rules based on:
Market trends
Arbitrage opportunities
Statistical models
HFT strategies are extremely fast, aiming to profit from tiny price differences in milliseconds.
4. 🧱 Quantitative Trading
Quant funds like Renaissance Technologies or D.E. Shaw use math, coding, and machine learning to create models that predict price movements.
They may build systems that factor in:
Price action history
News sentiment
Economic indicators
Correlation between assets
Volatility, interest rates
These are not human trades – the models execute trades based on data patterns.
5. 🧩 Options-Based Hedging Strategies
Institutions use options to hedge, speculate, or generate income.
Common techniques:
Protective Puts (insurance for falling stocks)
Covered Calls (collect premium for sideways movement)
Calendar Spreads, Iron Condors, etc. (advanced strategies for theta/gamma/vega exposure)
They often create multi-leg options positions to reduce risk and take advantage of implied volatility.
6. 🏰 Dark Pools Trading
Institutions often trade through dark pools, which are private exchanges not visible to the public. These are used to place large orders without revealing size, so other traders don’t front-run their positions.
Example: An institution may buy 1 million shares through a dark pool instead of a public exchange like NSE or NYSE.
7. 📍 Sector Rotation Strategy
Institutions frequently rotate their capital between sectors based on economic cycles.
In recession: move to defensive stocks (FMCG, Pharma)
In recovery: switch to cyclicals (automobile, banking, infrastructure)
They allocate billions of dollars based on macro themes, earnings cycles, and geopolitical shifts.
8. 🔁 Rebalancing Portfolios
Large funds constantly rebalance their portfolios — buying/selling assets to maintain target allocations. This causes monthly/quarterly flows in stocks or ETFs, which can influence price significantly.
Traders often try to anticipate these flows and trade in the same direction.
📉 How Institutional Traders Enter Positions Quietly
Let’s break down a common stealth strategy:
📘 Step-by-Step Accumulation Example:
Stock ABC trades at ₹100.
Institution wants to buy 5 lakh shares.
If they buy all at once, the price may jump to ₹110+.
So they:
Break order into 5,000 share blocks
Buy at different times of day
Use different brokers/accounts to hide volume
Buy some shares in dark pool
Use algorithm to monitor market depth
After 2 weeks, they complete the buy at an average price of ₹101.
Once they have the position, they might release news or earnings upgrades to support the price.
They hold till price hits their target (say ₹130), then start distributing in small blocks again.
👁 How to Spot Institutional Activity as a Retail Trader?
While you can’t directly see them, you can learn to follow the footprints:
🔍 Clues of Smart Money Activity:
Unusual volume on low-news days
Breakout with high volume but small price move
Price holding key levels repeatedly (support/resistance)
Option open interest buildup
Low volatility periods followed by volume spike
Multiple rejections from the same price zone (indicating accumulation/distribution)
🧠 Mindset of Institutional Traders
What makes institutions successful is not just tools or money — it’s their discipline, planning, and patience. Key principles:
Capital preservation first
Risk-to-reward must be favorable
Avoid emotional decisions
Backtesting before executing strategies
Long-term consistency over short-term wins
📌 Summary – What Can We Learn?
Institutional trading is not magic — it’s structured, logical, and data-driven. As a retail trader, you can’t beat them in speed or capital, but you can:
✅ Learn how they operate
✅ Use similar risk management
✅ Follow the smart money
✅ Avoid emotional trades
✅ Focus on long-term skill building
🏁 Final Thought
The goal isn’t to copy institutional trades, but to understand their footprint and align your trades with their flow. Most successful retail traders grow by observing how smart money moves, then reacting wisely.
You don’t need ₹100 crore to trade like an institution — you need a strategic mindset, discipline, and a plan.

Options Trading Strategies📌 What Are Options in Trading?
Before we get into strategies, let’s understand what options actually are.
In the simplest form, options are contracts that give a trader the right, but not the obligation, to buy or sell an asset (like a stock, index, or commodity) at a specific price before or on a specific date.
There are two main types of options:
Call Option – Gives you the right to buy something at a set price.
Put Option – Gives you the right to sell something at a set price.
These tools can be used to hedge, speculate, or generate income. Now that you know what options are, let’s go deeper into strategies.
🎯 Why Use Options Strategies?
Options trading is not just about buying Calls and Puts randomly. It’s about smart combinations and planned risk management. With the right strategies, you can:
Profit in up, down, or sideways markets
Limit your losses
Leverage small capital
Hedge your stock or portfolio
Earn regular income
Let’s now dive into some popular options trading strategies—from basic to advanced—with examples.
✅ 1. Covered Call Strategy
💡 Use When: You own a stock and expect neutral or slightly bullish movement.
You own shares of a stock and you sell a Call Option on the same stock. You receive a premium from selling the Call, which gives you extra income even if the stock doesn’t move.
📘 Example:
You own 100 shares of Reliance at ₹2800. You sell a 2900 Call Option and receive ₹30 per share as premium.
If Reliance stays below ₹2900 – You keep your stock and the premium.
If Reliance goes above ₹2900 – Your stock gets sold (you deliver), but you still profit from stock rise + premium.
✅ Pros:
Earn extra income
Lower risk than buying naked calls
❌ Cons:
Limited upside
Need to own stock
✅ 2. Protective Put Strategy
💡 Use When: You own a stock but want to protect from downside risk.
Here, you buy a Put Option along with owning the stock. It acts like insurance – if the stock crashes, the Put will rise in value.
📘 Example:
You buy HDFC Bank shares at ₹1700 and buy a 1650 Put Option for ₹25.
If HDFC drops to ₹1600 – Your stock loses ₹100, but your Put may gain ₹50–₹75.
If HDFC goes up – You lose only the premium ₹25.
✅ Pros:
Protects your portfolio
Peace of mind in volatile markets
❌ Cons:
You pay a premium (like insurance)
Can eat into profits
✅ 3. Bull Call Spread
💡 Use When: You are moderately bullish on a stock.
You buy a Call Option at a lower strike and sell another Call Option at a higher strike (same expiry). This reduces your cost and risk.
📘 Example:
Buy Nifty 22500 Call at ₹100
Sell Nifty 23000 Call at ₹50
Your net cost = ₹50
Max profit = ₹500 (if Nifty ends above 23000)
✅ Pros:
Lower cost than naked Call
Defined risk and reward
❌ Cons:
Limited profit potential
✅ 4. Bear Put Spread
💡 Use When: You are moderately bearish.
You buy a Put at higher strike and sell another Put at lower strike. This is just like Bull Call, but for falling markets.
📘 Example:
Buy Bank Nifty 50000 Put at ₹120
Sell 49500 Put at ₹60
Net Cost = ₹60
Max Profit = ₹500
✅ Pros:
Risk-managed way to profit in downtrend
❌ Cons:
Limited profits if market crashes heavily
✅ 5. Iron Condor
💡 Use When: You expect the market to stay sideways or within a range.
It’s a neutral strategy involving four options:
Sell 1 lower Put, Buy 1 far lower Put
Sell 1 upper Call, Buy 1 far upper Call
📘 Example:
Sell 22500 Put
Buy 22200 Put
Sell 23000 Call
Buy 23300 Call
You receive a net premium. If the index stays between 22500–23000, you make full profit.
✅ Pros:
Profits in range-bound market
Low risk, fixed reward
❌ Cons:
Requires margin
Complicated setup
✅ 6. Straddle Strategy
💡 Use When: You expect a big move in either direction, but not sure which.
Buy both a Call and a Put at the same strike price and expiry. One side will definitely move.
📘 Example:
Buy Nifty 23000 Call at ₹80
Buy Nifty 23000 Put at ₹90
Total cost = ₹170
If Nifty makes a big move (up or down), one side can explode in value.
✅ Pros:
Unlimited potential if market breaks out
Great for news events
❌ Cons:
Expensive to enter
Needs big movement to profit
✅ 7. Strangle Strategy
💡 Use When: You expect a big move, but want to reduce cost compared to straddle.
Buy an Out-of-the-Money Call and Put.
📘 Example:
Buy Nifty 23200 Call at ₹40
Buy Nifty 22800 Put at ₹50
Total cost = ₹90
You still profit from big movement, but cheaper than a straddle.
✅ Pros:
Lower cost
Profits from big moves
❌ Cons:
Requires even larger movement than straddle
✅ 8. Short Straddle (for experts)
💡 Use When: You think the market will stay flat (low volatility).
Sell a Call and a Put at the same strike. You earn double premium.
⚠️ Risk: Unlimited risk if market moves too much!
This strategy is not for beginners. You need tight stop losses or hedges.
🔐 Risk Management Is Key
No matter which strategy you use:
Always define your maximum risk and reward.
Avoid taking naked positions without hedging.
Use stop losses and trailing SLs.
Don’t bet your whole capital – use position sizing.
Avoid trading right before major events unless you understand the risks.
Strangle
🤔 Real-Life Example (Simple Breakdown)
Let’s say the market is range-bound and Nifty is stuck between 22500–23000 for weeks. You can go with an Iron Condor:
Sell 22500 Put at ₹80
Buy 22200 Put at ₹40
Sell 23000 Call at ₹70
Buy 23300 Call at ₹35
Net Premium = ₹75
If Nifty expires between 22500–23000, you get full ₹75 profit per lot. If it breaks the range, losses are capped due to hedges.
💬 Final Thoughts
Options trading strategies are like different weapons in your trading arsenal. But using them without understanding or discipline is dangerous. Always know:
What is your market view?
What is your max risk?
How will you manage losses?
The smartest traders don’t gamble—they plan. They treat options like a business, not a lottery ticket.
So whether you’re trading with ₹5000 or ₹5 lakhs, always use a strategy with:
✔ Proper Risk-Reward
✔ Defined Exit Plan
✔ Strong Logic (not emotion)
Trading Master Class With Experts🎓 Trading Master Class With Experts
Join a premium learning experience led by real market experts and institutional-level traders.
This is not just theory—it's real-world strategy, live insights, and powerful execution.
🔥 What You’ll Learn:
Advanced Price Action – Master structure, trends & breakouts
Institutional Trading Tactics – Learn how the big players move
Options & Derivatives – Trade with smart setups & defined risk
Strategy Building – From scalping to swing setups
Trader Psychology – Build discipline, mindset & consistency
Risk Management – Professional capital protection strategies
💡 Why Join?
✅ Learn from real experts
✅ Get access to institutional methods
✅ Trade with confidence, clarity & control
✅ Perfect for intraday, swing, and option traders
📌 Learn. Apply. Profit.
This is your step toward trading like a pro.

Master Institutional Trading🏛️ Master Institutional Trading
Unlock the secrets of how the smart money dominates the market
Learn to think, plan, and trade like top institutions and hedge funds.
What You’ll Master:
Advanced Market Structure – Breakouts, fakeouts & liquidity grabs
Smart Money Concepts – Accumulation & distribution like a pro
Order Flow & Volume Logic – Follow the real money
Entry & Exit Precision – Based on logic, not guesswork
Institutional Risk Management – Capital protection & scaling
Trader Psychology – Discipline, patience & strategy
No more random trades. No more emotional decisions.
This is structured, high-level trading built for serious traders.
📌 Master the mindset. Read the market. Trade like institutions.

Learn Institutional Trading🏛️ Learn Institutional Trading
Step into the world of smart money and learn how the big players trade!
Institutional Trading isn’t about following indicators—it’s about understanding market structure, liquidity, and smart money moves.
🔍 What You’ll Learn:
Market Structure – Trends, ranges, and liquidity zones
Smart Money Concepts – Accumulation , distribution , and manipulation traps
Volume & Order Flow – See what the institutions see
Precision Entries – No guessing, just calculated moves
Risk Management – Trade like a pro, protect your capital
💡 Why It Matters:
Retail traders often get trapped 🚧 by institutional strategies. When you learn how institutions think and operate, you stop reacting and start predicting market behavior.
🚀 Final Thought:
Think like a pro. Trade like an institution. 🏛️ Win with structure.
Learn Institutional Trading and transform the way you see the market—forever

Option Trading💼 Option Trading 📉📈
Leverage. Flexibility. Strategic Advantage.
Option Trading is a powerful segment of the financial markets where traders and investors use derivative contracts—known as options—to speculate, hedge, or generate income. Unlike traditional stock trading, options give you the right (but not the obligation) to buy or sell an asset at a predetermined price, within a specific time frame.
It’s a strategic tool used by everyone from retail traders to hedge funds to gain exposure with limited risk and amplified potential.
🔍 Key Concepts:
✅ Call Option – Gives the right to buy an asset at a fixed price (strike)
✅ Put Option – Gives the right to sell an asset at a fixed price
✅ Premium – The price paid to buy the option contract
✅ Strike Price – The level at which the option can be exercised
✅ Expiry Date – The date on which the contract expires
✅ In-the-Money / Out-of-the-Money – Describes the moneyness of a position relative to current price
⚙️ Why Trade Options?
🔹 Leverage – Control larger positions with smaller capital
🔹 Flexibility – Bullish, bearish, neutral—there’s a strategy for every view
🔹 Defined Risk – Max risk = premium paid (in buying options)
🔹 Income Generation – Sell options (covered calls, credit spreads) for passive income
🔹 Hedging – Protect existing stock positions from volatility or loss
Option trading isn’t gambling—it’s a game of precision, risk management, and market insight. To succeed, you need to master:

Ride The Big Moves🚀 Ride The Big Moves 📈
"Ride The Big Moves" is a powerful trading strategy and mindset that focuses on capturing large, high-probability market moves—rather than chasing small, uncertain fluctuations. It’s about positioning yourself with the trend, identifying institutional footprints, and holding trades with discipline and conviction for maximum reward.
This concept is rooted in smart money principles: letting your winners run, minimizing overtrading, and waiting for momentum-backed breakouts instead of guessing tops and bottoms. Whether you're trading options, stocks, or futures, the goal is simple—enter with precision, and ride the wave to its full potential.
👉 Perfect for:
✅ Swing Traders
✅ Intraday Momentum Traders
✅ Institutional-Style Traders
✅ Traders seeking fewer but higher-quality setups
🔍 Key Components:
Identifying high-volume breakout zones
Trend confirmation using price action
Entry triggers aligned with momentum shifts
Risk management for extended holds
Avoiding noise & false signals
Stop settling for crumbs — Ride The Big Moves and trade like the pros.

SPX Supply Rejection-Eyes on 6304SPX shows signs of potential weakness after testing a prior supply zone and failing to sustain higher levels. The current setup anticipates a downward move, supported by structural resistance and liquidity imbalances.
🔍 Chart Highlights:
🟥 Red zone marks supply rejection after a strong upward move.
📦 Liquidity Control Boxes from SignalPro show layered imbalance zones between 6,350–6,310.
🧊 Target marked at 6304, aligned with lower liquidity pocket and recent demand structure.
⚠️ Stop region defined above the rejection high, giving clear invalidation.
📘 Educational Focus:
This trade scenario highlights how to:
Identify potential exhaustion at supply zones
Map liquidity structures using institutional-style tools
Build trade ideas with defined risk-to-reward
Such planning reinforces disciplined trading, especially in high-volume indices like SPX.

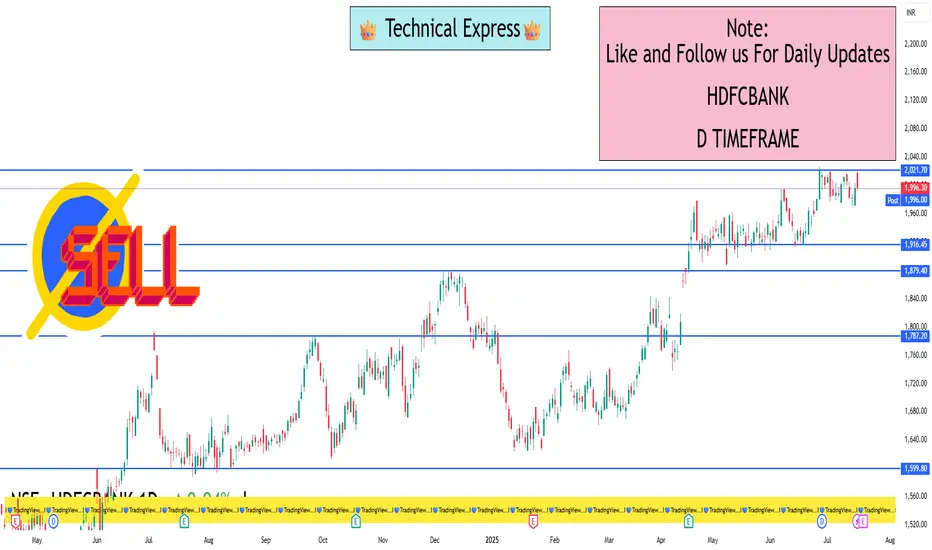
HDFCBANK 1D Timeframe✅ Holding HDFC Bank Already?
Stay invested. The stock is in a strong daily uptrend
Expect potential partial profit-taking near ₹2,021–₹2,025 or ₹2,039–₹2,040.
🟢 Planning to Buy?
First entry zone: ₹1,977–₹1,980 — safe to buy on minor dips.
Deeper buy range: ₹1,960–₹1,963 — ideal for long-term accumulation.
Place a stop-loss just below ₹1,947, especially on deeper entries.
🔵 Breakout Play?
A clean daily close above ₹2,039–₹2,040 with strong volume could launch a fresh rally.
You can add more positions after confirmation
Day-to-Day Tips
Use dips to enter near support levels with disciplined stop-losses.
Scale out or lighten positions near resistance levels.
Add more only after a confirmed breakout with strong volume.
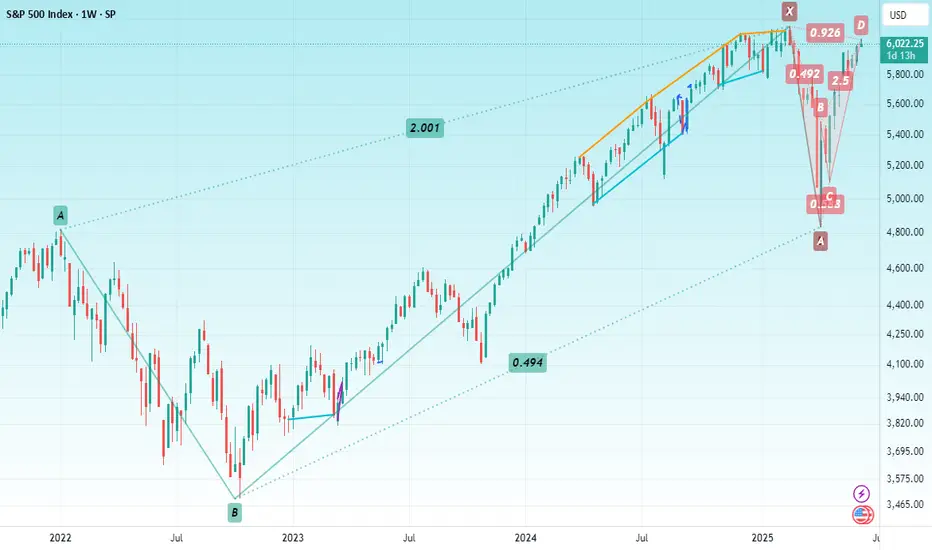
S&P 500Hello & welcome to this analysis
After making a monthly time frame Bullish Harmonic Reciprocal ABCD in April, the index has now formed a Bearish Harmonic Bat in daily time frame.
A pullback till 5800 - 5750 should not be ruled out as long as its below 6100
All the best
Learn Institutional options trading Part-6Psychology & Discipline in Options Trading
Success in options requires:
Defined trading plan
Strict risk-reward ratio
Avoiding revenge trades
Avoiding overtrading on expiry days
Regular review and journaling of trades
Emotional control and discipline are more important than strategy in consistent profitability.

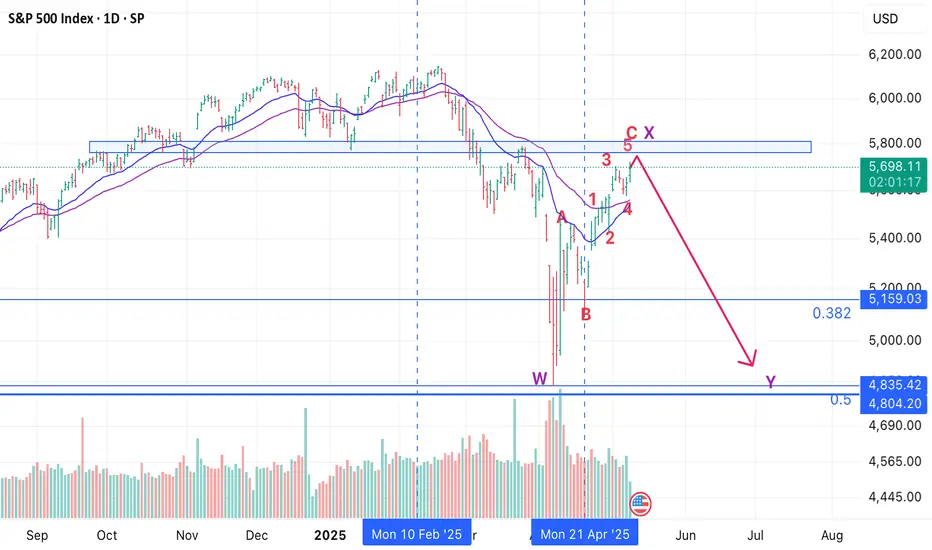
SPX/ NDX/ DJI - Elliot Wave - Change in CountsI have expected May 8th as the top of the pullback in this post:
However, it seems that there were more legs pending.
View still remains that this is a counter trend rally, and we will eventually head down again.
We are in 3rd of C and we will get another move up in 5th, which should mark the end of the entire leg up.
If I am invested in US markets - I would use this rally to book profits!
View is similar in Nasdaq and DJI, so not sharing those charts again. :)
All the best!

SPX - Elliot Wave Update -PullBack Over - Time for next leg downSPX has pulled back in an ABC with 5th of C going on today.
Good time to short and ride at least 10%, if lucky 15-20% :)
All the best!
S&P 500 Bearish Reversal Setup: Short Entry Below Key ResistanceEntry Point: Around 5,678.79
Stop Loss: Around 5,833.61 (above recent resistance zone)
Target Point: Around 4,831.37 (indicating a bearish target)
2. Technical Patterns:
The price hit a resistance zone (highlighted in purple) and reversed—this is often a bearish signal.
The trendline break (marked with the orange dot and blue arrow down) suggests a potential trend reversal.
The moving averages (likely 50 EMA and 200 EMA) indicate the price is still above the support zone but weakening.
3. Risk/Reward Ratio:
Risk (Stop Loss – Entry): ~154.82 points
Reward (Entry – Target): ~847.42 points
Risk/Reward Ratio: Approximately 1:5.5, which is favorable for shorting.
4. Trade Sentiment:
Bearish bias based on the breakdown from the resistance zone and confirmation from chart patterns.
If the price fails to hold above 5,682.87, a short trade may be validated with the target at 4,831.37.

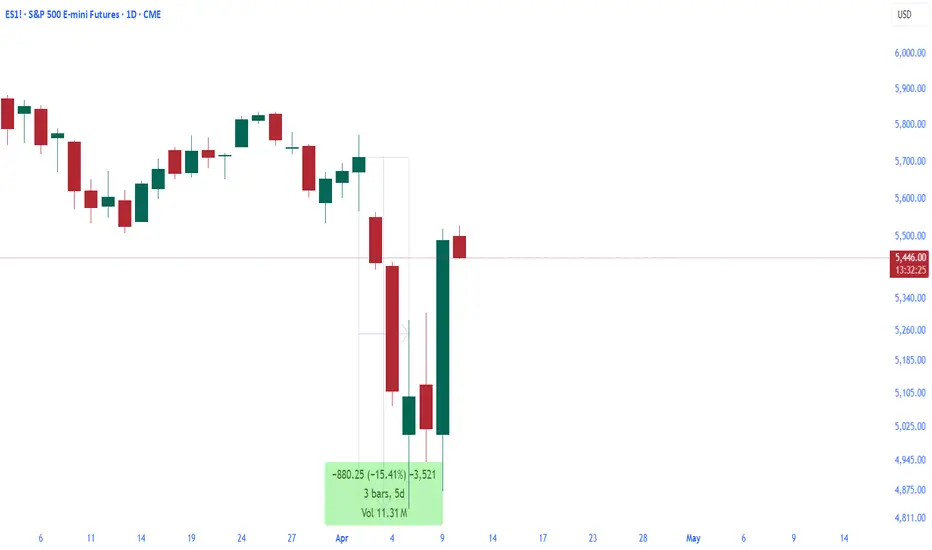
Tariffs and a Wild S&P 500 Ride: A Trader’s View on the ChaosA Horrible 8 Days for Traders:
The last 8 days have been a nightmare for traders and investors. Portfolios crashed hard, battered by uncertainty in the market—all thanks to tariff news from a U.S. leader with a business background and his ultra-wealthy advisor. The S&P 500 took a wild ride, and I’ve tracked every twist from the trading floor.
The Tariff Shock Hits
It started on April 2, 2025, when reciprocal tariffs were announced—taxes to counter other countries’ levies on U.S. goods. The S&P 500 closed that day as our benchmark. Here’s how it unfolded:
April 3: The index opened lower and closed nearly 5% down—a harsh kickoff.
April 4: It dropped another 6%, as tariff fears sank in deeper.
A Rumor Sparks Hope, Then Fades
On April 7, a rumor of a 90-day tariff pause emerged. The reaction was swift:
April 7: The S&P 500 surged around 6% intraday, giving us a glimmer of hope.
After few minutes: The White House dismissed it—no pause was coming. The gains vanished.
From its April 2 close to the April 7 low, the S&P 500 had plunged -15%. It was a dark stretch, with losses piling up fast.
The Pause Brings Relief
On April 9, the tide turned. After hints that the advisor told the leader between April 7 - 8, “These tariffs need rethinking,” they confirmed a 90-day pause on most tariffs, though one country faced steeper rates. The market responded:
April 9: The S&P 500 soared nearly 10%—a lifeline for battered portfolios.
Same Day Bonus: The company tied to the advisor leaped 22%, a standout gain.
Uncertainty or Intentional Moves?
Here’s the big question: Is this uncertainty, then sudden certainty, intentional? The tariff news threw markets into chaos, only for the pause to spark a swift rebound. In these moments:
Technical and fundamental analysis failed—charts and earnings reports were useless.
Trades hinged on headlines alone, a pattern I’ve seen before with major news.
Many technical analysts avoid trading when big events loom, and this shows why.
Could it be manipulation? The S&P 500 crashed 15% by April 7’s low, lifted 6% on a rumor, then soared 10% on the pause—while the advisor’s company hit 22%. Did someone foresee these swings?
Clues in the Chaos
There’s more to ponder:
Analysts warned tariffs could cut S&P 500 earnings by 5%, yet the policy rolled out—until this pause.
That 22% company surge on April 9 aligns perfectly with the market’s 10% rise.
When business-savvy leaders steer policy, their moves ripple through the market. Were these shifts too perfect for those in the know?
What’s Next After 90 Days?
What happens when the pause ends? Will the market fall again? It’s already reacted with that 10% jump on April 9, and markets don’t always repeat the same dance. Without a new shock, nothing big might happen after 90 days—but that’s a question for the next headline.
A Lesson for Traders
This tariff drama proves how policy can sway the S&P 500 like a pendulum. From an 15% plunge to a 10% rally, traders felt the pain but some may have gained far more. Stay alert: when leaders with business know-how call the shots, the market listens, and we’re left wondering who’s really in control.
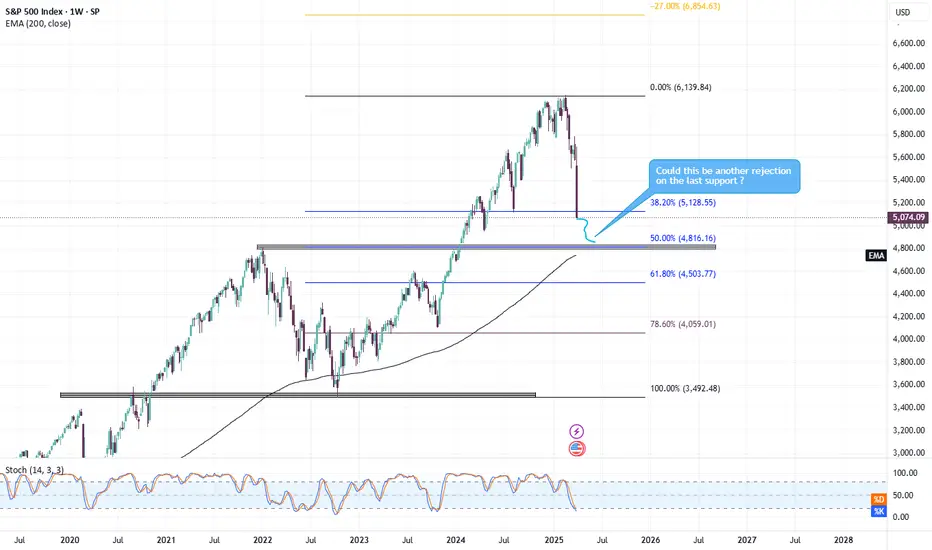
SPX LONGLooking at the chart right here, as we can see the S&P 500 is bottoming, and we will see the same thing happened on 9 May 2022, so what I see or expect from the 2025 correction is rejection to the 50% fibonacci retracement which is around 20% or we can expect a deeper correction which is to the 61.80% and also with the rejection to the MA200 and hope it bounces back up, let me know what do you guys think about SP500 right now
The Great S&P 500The S&P 500 is sitting comfortably on its scripted support, just waiting to see if it holds or breaks. Let’s hope our current American businessmen don’t make any decisions that might actually improve things! Wouldn't want him accidentally turning the world into a better place.

S&P - Support is at 5070 or 4747 ?S&P would have fallen even if Trump didn't announce new tax on other countries. S&P has reached all my previous targets and there was no higher target left without a correction now. And this correction was expected fall and its been so steep and fast only due to new flow about tax. It has broken few previous support levels and from now first support coming at 5070 which is rising wedge target and also near to fib level and 4747 is ABC correction target which is the maximum low or correction can be expected in normal situation. In my view tax on other countries only supports domestic growth and in coming months US GDP will keep increasing only. so the latest tax news is supportive thing for equity market in 6 months to 12 months for sure. Use this for educational purpose and consult your advisor for any investment or trading. I am trying my best every time to time the market to help others.
