SPX Weekly update on 18-11-2023SPX is anticipated to have completed the correction against the rally from the low of 2191 in March 2020 of cycle degree. Currently, it is expected to be in wave 3 formation of cycle degree, with the outlook for SPX to extend further high in wave 3 as long as it remains above 4103 and does not break the trend line.
Spx500long

SPX tomorrow viewExpected to be in wave 4 formation within wave 3 and expecting a decline in SPX in wave 4 before any further high to complete wave 5 within wave 3.

Whats next for S&P500 - a falling wedge breakout?Our NSE:NIFTY & NSE:BANKNIFTY is following the same chart pattern as SP:SPX
A falling wedge plus bearish descending channel with a strong horizontal support
SPX has just broken out from the falling wedge, will it breakout?
And if yes - some of that euphoria will spill onto Nifty50 as well.

SPX Projected Curve as per Past HistoryHere we are looking SPX will Head towards 44590 Target for this July Month as Per Past History.

s&p analysis based on supply demand zones SP:SPX may try to create #wpattern or double bottom on daily / hourly time frames at important support zone of daily time frame, if it breaks below the support level, we can achieve the expected downside targets soon.

SPX 500 positional trade : All targets reached.Please check idea previously posted on 22nd June.
SPX 500 has been in a nice uptrend, continuously making higher highs and higher lows. After the recent pullback to the 20 EMA , a nice continuation candle has formed. A long can be initiated keeping in mind the following levels, only if it sustains above long level for 15 minutes.
LONG ABOVE : 4226
STOP LOSS : 4173
TARGET 1 : 4279
TARGET 2 : 4332

Will SPX 500 create a new all time high?SPX 500 has been in a nice uptrend, continuously making higher highs and higher lows. After the recent pullback to the 20 EMA, a nice continuation candle has formed. A long can be initiated keeping in mind the following levels, only if it sustains above long level for 15 minutes.
LONG ABOVE : 4226
STOP LOSS : 4173
TARGET 1 : 4279
TARGET 2 : 4332

S&P 500 Analysis and Indicator on 15-Min TimeframeThis is non-repainting indicator which can be used for Index, Stocks, Commodities and Bitcoin or any other securities depending upon the various parameter setting of the indicator. The detailed description about the indicator is as follows:
I have taken 2 lots of SPX as default trading quantity and one for partial booking after 75 points which can be customized.
Long Period: Period for calculating Primary Signal Line (Yellow).
Long Period Input Source: Input for calculating Primary Signal Line.
Short Period: Period for smoothing the Primary Signal Line.
Short Period MA: Method for smoothing the Primary Signal Line.
No. of ATR Bars: No. of ATR bars for calculating Primary Signal Line.
ATR Multiplier: ATR multiplier for ATR calculation.
Trade Trigger: Value above or below of Primary Signal Line for Long or Short signal. The dotted lines in Green and Red color represents the same.
Bar Crossover Input Source: Current bar input for additional signal confirmation above Primary Signal Line.
Bars Above Signal High: No. of bars closing above Secondary Signal Line (Blue)
Bars Below Signal Low: No. of bars closing above Secondary Signal Line (Purple)
No. of bars crossover method uses certain no. of bars for closing above High or Low of the crossover of closing price and the Primary Signal Line in combination with Trade Trigger. The idea behind this design is to avoid fake signal due sudden spike in price. Also, this ensures that price consolidates above High in case of Long signal confirmation and vice-versa. By increasing no. of such bars, we can anticipate, how much time it takes for short-term and long-term trend reversal.
Depending upon the time-frame, just by observing the High and Low of previous crossover of closing price and Primary Signal Line, we will have better understanding of undercurrent of market.
By using different combination of Trade Trigger value and no. of bars above and below, we can anticipate better trend confirmation.
The various combinations of price source of Long Period Input Source and Bar Crossover Input Source, the Short Period MA method shows promising results. Kindly PM me for these optimum settings for other financial instruments.
It always better to book partial profit after getting into the trade which increases the odds. The default trade quantity is 2. We book 1 quantity after our partial profit target is reached and let the remaining quantity be in the trade until the reversal of trend. By enabling or disabling the same we can determine the profit or loss from historical trade from when the trade quantity is 1. Just remember to change the default quantity to 1 in Order Size from properties when you disable the Take Partial Profit option.
Take Partial Profit: Whether to book partial or not as explained above.
Partial Profit Points: It always better to book partial profit after trend getting into the trade. The default trade quantity is 2. We book 1 quantity after our partial profit target is hit and let the remaining quantity in the trade until the reversal of trend.


Cup and Handle on SPX, target 3000SPX has formed a cup and handle pattern and can retest 2950-3100 zone.

Long term Prospect on SPX500 — How far is the Market gonna dip?Conjuncture
As Coronavirus seem to have reached in the EU what looks to be so far its "propagation ceiling", the US is being rapidly contaminated with the virus; their extremely precarious healthcare system worsening the spread by making it increasingly harder for people to get tested. The US spread, being late of a week or two behind the EU, still has lots of room for propagation to grow. Therefore, as soon as the disease started significantly spreading in the US, the markets began accelerating to the downside despite already pricing within a really attractive range of prices .
This suggest that the market has just — or at least recently — started pricing the actual propagation in US territory, unlike what it was doing two weeks ago. This is a sentiment that is being reinforced by Chinese's global contamination number which has been decreasing for two or three days now. Nonetheless, keep in mind that these numbers (the Chinese ones), may only be partially reliable. If my postulate is correct, we should start seeing the Asian markets slowing down during the next week, the european markets (which are way closer from their weekly supports than the US) should follow the Asian pace shortly, while the US starts accelerating.
Context/Fundamentals
Coronavirus
Oil Crash and OPEC falls apart
EU ban
Weak economics fundamentals
Major Equities still overvalued
Central banks doubling down on complacent Monetary policy
Technicals
Weakening daily bearish RSI
Weekly support trendline broke to the downside (green)
Mid-Term support area 2571 to 2470 not holding prices anymore. Prices accelerating through the area in 4 hour and higher timeframes
Markets still have lots of room to the downside on weekly timeframes
Next Key Support Areas
Here's a weekly chart highlighting most of the attractive prices and levels of support, giving you a beforetaste of the amplitude of the freefall that may occur :
2343$ — 38.2 fibonacci of 2008 - 2019 We better not close below that area, otherwise we break through the bottom of 2019's bullish movement. From there, we're forecasting the end of a weakly bearish retracement, if not a trend.
2234-2111-1963$ — Those prices, while not being the most attractive, represent interesting low volume areas close if not onto the 2015-2016 range in which the market could setup short-term ranges (for a few days or weeks), Scalpers / Daytrader's paradise, Swing Traders and investor's nightmare. Why so ? Because we would be in the worst area for risk / profit ratio Weekly wise. The area between 38.2 and 61.8% is literally what we call the "Dumb Zone", it's not for nothing. Put your Risk/Reward ratio and see for yourself :
1693$ — 61.8% retracement of 2009 - 2019 bullish trend confluent with 50% price drop since last market top. This is getting extremely interesting, personally i have buy order in the books at this exact price. If we reach that area, we're probably gonna range a looong time around it. Would we be able to go lower ? Quite unlikely but not impossible, see next level.
1290$ — To me, this area represent both enormous opportunity and risk. This is the last chance for the US market to recover and start growing again. Any monthly close below that price and it's a multi-year bearish trend confirmed for those markets. Needless to say that, at this point the 1000$ on the SPX is gonna switch from major support to major resistance.
Such a pricing of the SPX500 along with all other major US indices would mark the end of the US Dollar aswell as the United States hegemony over the rest of the world. This scenario is for Doomers only.
And that seems to be it
Hope this idea will inspire some of you !
Go easy on leverage and don't forget to hit the like/follow button if you feel like this post deserves it ;)
Kindly,
J.M.K

SP500 LongOne can go long in the s&p 500 at current levels for new all time highs. Its a trade with great risk to reward at this juncture.

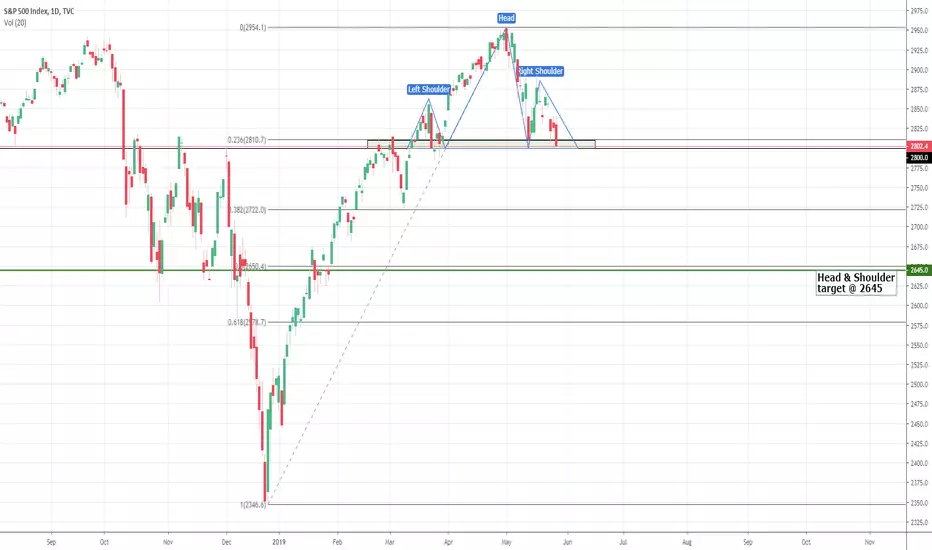
S&P 500 Index | Head & Shoulder Pattern observedHead & Shoulder pattern observed in S&P 500 Index. Should the pattern confirm by breaching 2800 on closing basis, one can expect the index to fall towards 2645.
En route 2720 area is a visible support for shorts to be wary of.
S&P 500 - Verge of Breakout - Chart PatternsS&P 500 index is at the verge of a flag breakout on the 15 minutes TF.
Targets are near 2570.
Wait for confirmation by the next candle, and a mostly probable retest of the resistance turned support before entering.

SPX - S&P 500 is in the Major Uptrend. . . Bulls Roxx!!!SPX - S&P 500 is in the Major Uptrend. . . Bulls Roxx!!! It's just a little retracement Man. . .

SPX500 Long Setup.Considering the momentum, I will initiate longs above 2900, with an open target and trailing SL starting the trade with 2820.
Will keep updating further actions.
