Commodity Supercycle 2025: Metals & Energy⚒️ Metals: The Foundation of Industrial Growth
Why are metal prices booming?
Let’s break it down in human terms:
Massive Infrastructure Projects
India, US, China, and Europe are all spending billions on roads, bridges, railways, smart cities, and housing.
All of that needs steel, cement, aluminum, copper, etc.
Clean Energy = More Copper & Aluminum
Solar panels, EVs, and wind turbines need a lot more copper, lithium, and rare metals than conventional energy.
This creates a demand explosion for base metals.
Supply Chain Bottlenecks
Mines across the world (especially in Africa, Chile, and Australia) are facing labour shortages, political instability, or environmental restrictions.
Less mining = less supply = prices go up.
China’s Comeback
China is the largest consumer of metals globally.
After a slow period in 2022–23, it’s back with a stimulus to revive housing and infrastructure — adding massive demand pressure.
🔋 Energy: Fuel for the Supercycle
What’s happening in oil, gas, and coal?
Crude Oil Above $90/Barrel
Conflicts (Russia-Ukraine, Middle East) + OPEC production cuts = tight supply
Despite the push for renewables, the world still runs on oil for transport and manufacturing
Natural Gas Shortages in Europe/Asia
War-related disruptions in Russian supply have caused natural gas prices to skyrocket
LNG imports from the US and Qatar are booming — good for companies in that ecosystem
Coal Prices Rising Again
Despite climate goals, India, China, and others are still using coal for base power
Coal India and related PSUs have seen strong earnings due to volume demand + price support
🧾 How This Affects the Indian Market
India is both a major consumer and a growing exporter of various commodities.
Winners in the Supercycle:
1. Metal Stocks (Steel, Aluminum, Copper)
Company Why It’s Benefiting
Tata Steel Global presence + rising prices = higher margins
JSW Steel Export growth + capex-driven demand
Hindalco Aluminum giant + Novelis (US-based unit)
Hindustan Copper India’s only copper miner; global demand rising
2. Energy Stocks (Oil, Gas, Coal)
Company Why It’s Benefiting
ONGC Rising crude prices = stronger profitability
Oil India Smaller PSU with strong rally potential
Coal India Massive volumes, dividend, pricing power
Reliance Petrochemicals + oil refining benefits
3. Ancillary & Export-Based Stocks
Company Role in Supercycle
NMDC Supplies iron ore – key to steelmakers
MOIL Manganese supplier for steel industry
APL Apollo Tubes Beneficiary of infra + steel boom
Welspun Corp Pipes for oil & gas pipelines
📊 Real Performance: Numbers Don’t Lie
Let’s take a quick look at recent returns (approx. from Jan 2023 to July 2025):
Stock Price in Jan 2023 Price in July 2025 Approx % Gain
Tata Steel ₹110 ₹170+ 55%+
JSW Steel ₹690 ₹930+ 35%+
Hindalco ₹430 ₹675+ 55%+
Coal India ₹220 ₹450+ 100%+
ONGC ₹150 ₹270+ 80%+
These are fundamentally driven rallies — not pump-and-dump moves. That’s the beauty of supercycles.
📈 Technical Outlook in July 2025
Nifty Metal Index:
📌 Near all-time highs (~9,000+ zone)
📈 Trend: Strong bullish
🔁 Expect periodic corrections of 5–7%, but uptrend likely to continue
Nifty Energy Index:
📌 In a broad uptrend, thanks to Coal India, ONGC, Reliance
📈 Breakouts seen in power generation and refining stocks
🎯 Next resistance at 30,000+, support at 28,500
🧠 What Traders & Investors Should Do
🧭 For Traders:
Focus on volume breakouts in metal & energy stocks
Watch for sectoral momentum using indices like Nifty Metal, Nifty Energy
Use Futures & Options (F&O) strategies like:
Call buying on breakout confirmation
Bull call spreads in ONGC, Hindalco, Tata Steel
Short straddles for sideways phases in Coal India
📆 For Swing Traders:
Identify weekly breakout patterns (flags, cup & handle, triangle)
Use trailing SL and partial booking (these stocks move fast)
Best timeframe: 2–4 week swings, especially in trending names
💼 For Long-Term Investors:
Allocate 10–15% of your portfolio to core metal/energy stocks
Focus on low-debt, dividend-paying companies (e.g., Coal India, ONGC)
SIP or staggered entries work well in a volatile commodity cycle
Expect volatility — supercycles are not linear
❗ Risks & Cautions
Every rally has its risks. Here’s what to keep in mind:
Risk Impact
Global Recession Could reduce commodity demand globally
China Slowdown Big impact on copper/steel demand
Currency Volatility Affects import/export profitability
Policy Changes Carbon tax, ESG push may hurt coal/oil stocks
Overheating Stocks may correct 15–20% if valuations get stretched
Always use risk management — especially in leveraged trades.
🗺️ Global Supercycle Factors to Watch in 2025–26
🛢️ Crude oil production quotas (OPEC+ decisions)
🏗️ China’s stimulus on construction and EVs
🌱 ESG push: Will governments ban/restrict dirty fuels faster?
💹 US Fed rate cuts/inflation outlook (affects commodity pricing)
🧾 Mining policies in resource-rich countries (Africa, Latin America)
These global forces shape how long the current commodity upcycle will last.
✍️ Final Thoughts
The commodity supercycle in 2025 is real and being driven by multi-year global trends in infrastructure, energy transformation, and supply limitations. This is not just a short-term rally — it’s part of a structural shift.
If you’re a trader — this sector is offering sharp, trend-friendly price action.
If you’re an investor — this is your chance to ride secular growth in India’s industrial backbone.
💡 “When the world builds, commodities boom. And when that boom is real, wealth is created.”
Spy!

Banking & Financial Sector Near All-Time High in 2025 What Is the BFSI Sector?
BFSI stands for Banking, Financial Services, and Insurance. It includes:
Private and public sector banks (HDFC Bank, ICICI Bank, SBI, etc.)
NBFCs (Non-Banking Financial Companies) like Bajaj Finance, M&M Finance
Insurance companies like LIC, HDFC Life
Financial service firms like HDFC Ltd (pre-merger), IIFL, and brokers
Together, these companies form the backbone of India’s economy, handling everything from loans, credit cards, mutual funds, and insurance to rural financing and digital banking.
Current Market Position (July 2025)
Bank Nifty is trading above 54,000 – just below its all-time high of around 54,500+
Nifty Financial Services index is also hovering near its peak, led by strong performances from key stocks.
This means:
Banking stocks are leading the overall market rally.
Big money — from FIIs, mutual funds, and even retail — is flowing into BFSI.
Investors believe the sector will outperform in the upcoming quarters.
Why Is the Banking Sector So Strong Right Now?
1. Strong Earnings Growth
Most banks reported record profits in Q1 FY26
Examples:
HDFC Bank and ICICI Bank: Strong credit growth and low NPAs
SBI: Continued momentum in retail and agri-loans
Banks are making more money from both lending and investment services.
2. Improved Asset Quality (Low NPAs)
NPA = Non-Performing Asset (a loan that’s not being repaid)
In 2020–21, NPAs were a huge issue due to COVID.
Now in 2025, NPAs are at multi-year lows.
Better risk management + tech-based collections = fewer defaults.
This has improved investor confidence in banks.
3. Credit Demand Is Booming
India’s economy is growing at 7%+ GDP.
People are borrowing more:
For homes, education, business, and consumption
Corporates are also taking loans for:
Expansion, capex, and mergers
More loans = more interest income = better profits for banks and NBFCs.
4. Digital Banking Explosion
UPI, online lending, digital onboarding = huge cost savings
Banks like Kotak, ICICI, and SBI have aggressively expanded digital operations
NBFCs like Bajaj Finance and Paytm (financial arm) are leveraging tech to reach small towns
This is creating massive scale and reach with low overhead costs.
5. FII & DII Buying in Banking
Foreign Institutional Investors (FIIs) have returned in 2025
They prefer BFSI because it offers:
Liquidity
Consistent profits
Strong management
Domestic funds (DIIs and mutual funds) are also overweight on banking because it remains a core component of India’s growth engine.
Key Stocks Driving the Rally
🏛️ Private Banks
Stock Strength Points
HDFC Bank Post-merger synergy, retail + wholesale growth
ICICI Bank Best-in-class digital, strong balance sheet
Axis Bank Loan growth, improving CASA, strong NIM
Kotak Bank Conservative but profitable, strong capital base
IndusInd Bank Retail comeback, strong rural reach
🏦 Public Sector Banks (PSBs)
Stock Strength Points
SBI India’s biggest bank, strong rural and retail
Bank of Baroda Re-rating play, improved asset quality
Canara Bank PSU momentum + rising profitability
💳 NBFCs & Financial Services
Stock Focus Area
Bajaj Finance Consumer lending, digital
M&M Financial Rural auto + tractor finance
IIFL Finance Gold loan, home loan
🛡️ Insurance & AMC Stocks
Stock Focus
HDFC Life Long-term savings + insurance
SBI Life Market-linked insurance growth
LIC Recovery play post-IPO
Technical Picture: Bank Nifty (as of July 2025)
Resistance: 54,500 (All-time high zone)
Support levels: 53,300 and 52,700
Trend: Bullish (price above 20, 50, 200 EMA)
Volume: Rising, especially in HDFC, Axis, and SBI
Technical traders expect:
A breakout above 54,500 could take Bank Nifty to 56,000–57,000
A rejection might lead to healthy pullbacks before the next leg
What Traders Should Do
Intraday/Options Traders:
Focus on Bank Nifty index options on weekly expiry days (especially Thursdays)
Watch for breakout levels and OI build-up
Popular strategies:
Straddle at key resistance
Bull call spreads after breakout
Momentum scalping on ICICI, Axis, SBI
📆 Swing Traders:
Look for range breakouts on daily/weekly charts
Example: Entry on Axis Bank above ₹1,200 with SL at ₹1,160
Hold for 5–10% swing moves
🧾 What Long-Term Investors Should Do
✅ Continue SIPs in BFSI Mutual Funds
Most mutual funds (like SBI Bluechip, Axis Banking ETF) have high exposure to HDFC, ICICI, SBI, etc.
These are long-term wealth builders.
✅ Buy on Dips
If stocks fall 5–10% due to market-wide correction — it's often a buying opportunity, not panic time
Example: HDFC Bank falling from ₹1,800 to ₹1,650 is often bought by institutions
✅ Diversify within BFSI
Mix large-cap banks, PSU turnaround stories, and NBFCs for better returns with less risk
❌ Risks to Be Aware Of
Even though things look great, no rally comes without risks:
Risk Impact
Global Recession Could reduce FII flow
Rate Hikes (Globally) May reduce credit demand
Political Uncertainty 2026 elections might cause volatility
Asset Quality Shock If any hidden NPAs come up
Overvaluation in Mid NBFCs Some stocks may be overheated
💬 Expert Views
Most brokerage houses like ICICI Direct, Kotak Securities, and Motilal Oswal have bullish ratings on top banks.
They expect 10–15% upside in BFSI stocks over the next 6–12 months.
Morgan Stanley and Goldman Sachs are overweight on India’s banking sector in their Asia portfolio.
✍️ Final Thoughts
The Banking and Financial sector in India is booming for all the right reasons:
Strong economy
Clean books
Digital transformation
Massive credit demand
If you’re a trader — this sector offers great volatility and opportunity.
If you’re a long-term investor — this is where India’s structural growth is most visible.
Nifty & Bank Nifty Near All-Time Highs🧠 What Are Nifty and Bank Nifty?
Before we get into the “all-time high” excitement, here’s a quick recap:
🔹 Nifty 50
Represents the top 50 blue-chip companies listed on the NSE.
Covers 13 major sectors like banking, IT, FMCG, pharma, auto, etc.
Reflects the overall health of the Indian economy.
🔹 Bank Nifty
Comprises the 12 most liquid and large-cap banking stocks.
Includes private banks like HDFC Bank, ICICI Bank, Kotak Bank and public sector banks like SBI, Bank of Baroda, etc.
Tracks the performance of the banking sector, which is the backbone of economic activity.
📈 What Does “All-Time High” Really Mean?
An All-Time High (ATH) is the highest price level ever recorded by an index or a stock.
So when Nifty and Bank Nifty approach or hit their ATHs:
It means market confidence is at a peak.
Investor wealth is growing.
There's strong buying interest — often from FIIs (Foreign Institutional Investors) and DIIs (Domestic Institutional Investors).
It also attracts retail traders who don’t want to miss the rally.
🏁 Current All-Time High Zones (As of July 2025)
Index All-Time High Current Level (Approx) Difference
Nifty 50 24,200+ 24,050–24,150 < 1%
Bank Nifty 54,500+ 54,200–54,400 < 1%
💡 These levels keep changing — and might even be broken by the time you read this.
🔥 Why Are Nifty & Bank Nifty So Strong Right Now?
Here are the top reasons behind this strong rally:
1. Strong Earnings Season
Most large-cap companies posted better-than-expected Q1 FY26 results.
Sectors like banking, infra, auto, and energy are leading.
Low NPAs (bad loans) and growing credit demand boosted banking profits.
2. FII Buying
Foreign investors are back with heavy inflows into Indian equities.
They see India as a stable and fast-growing economy.
3. Domestic Growth Outlook
India is projected to be the fastest-growing major economy.
Manufacturing, services, and infra growth are driving GDP higher.
4. Global Stability (for now)
US Fed likely to hold or reduce interest rates.
Crude oil prices are stable.
No major geopolitical shocks recently.
5. Sector Rotation Favoring Leaders
Money has rotated out of laggards (like IT) into leaders (like BFSI, Infra).
This is pushing index-heavyweights like HDFC Bank, Reliance, ICICI Bank, L&T to new highs.
📊 What Happens When Nifty & Bank Nifty Hit ATHs?
🚀 Bullish Breakout (if ATH is broken strongly)
Heavy buying can trigger a fresh uptrend.
Short sellers might cover positions, fueling a short squeeze.
Traders look for quick 2%–5% moves post-breakout.
FOMO (Fear of Missing Out) can bring in more retail investors.
🧱 Resistance & Reversal (if ATH acts as a barrier)
Many traders also book profits near ATHs.
If breakout lacks volume/strength, pullbacks or corrections can happen.
Smart money waits for confirmation before entering aggressively.
🧠 What Should You Do as a Trader?
✅ If You’re a Short-Term Trader:
Focus on Levels:
Mark important zones: Previous ATH, recent support/resistance.
Example: Nifty needs to break and close above 24,200 with volume.
Avoid Chasing:
Don’t enter long trades after a huge gap-up near ATH — wait for retest or breakout confirmation.
Use Options Wisely:
Weekly expiries have high volatility.
Strategies like bull call spreads, straddles, or breakouts with strict SL work well.
Watch Sector Leaders:
Stocks like HDFC Bank, L&T, Reliance, Axis Bank often lead Nifty.
Trade them directly instead of the index if volatility is too high.
📈 What Should You Do as an Investor?
✅ If You’re a Long-Term Investor:
Stay Invested, Don’t Panic
ATH doesn’t mean the rally is over.
Indian markets are still fundamentally strong.
Don’t Go All-In Now
If you have lump sum funds, consider SIP or staggered buying.
Wait for dips or consolidation phases to add.
Focus on Sectors With Tailwinds
Banking, Infra, PSU, Capital Goods, and Consumption are currently leading.
Avoid Over-Hyped Stocks
Stick to quality large and mid-caps.
Avoid microcaps or penny stocks that rally just due to hype.
📌 Technical Outlook (As of Mid-July 2025)
🔹 Nifty 50:
Support: 23,800, then 23,500
Resistance: 24,200 (ATH), then 24,400
RSI: Around 68 – near overbought zone
Trend: Bullish but cautious — wait for breakout or pullback confirmation
🔹 Bank Nifty:
Support: 53,600, then 52,900
Resistance: 54,500 (ATH), then 55,000
Volume: Rising, especially in ICICI, HDFC, SBI
Trend: Stronger than Nifty due to credit growth optimism
🤖 What Are Smart Money & Institutions Doing?
Mutual Funds: Continuing SIPs, rotating into banking, auto, infra, and PSU.
FIIs: Buying banks, energy, and large-caps after months of selling.
DIIs: Supporting the market on dips, absorbing supply.
This institutional interest is what’s really keeping the market stable near ATH levels.
🛑 Risks to Watch Out For
Even though things look bullish, be aware of these possible risks:
Global tensions (Russia-Ukraine, China-Taiwan flare-ups)
US Fed unexpected rate hike
Sudden spike in crude oil prices
Local political uncertainty (elections approaching)
Overvaluation in certain stocks (mid- and small-caps getting overheated)
🧭 Final Words: How to Navigate Nifty & Bank Nifty at ATH?
Don’t panic if markets are at highs. ATH doesn’t mean you missed the bus.
But don’t go blind into FOMO either.
Stick to high-quality stocks, use proper stop-losses, and avoid leverage.
Track volumes, news flow, and institutional activity.

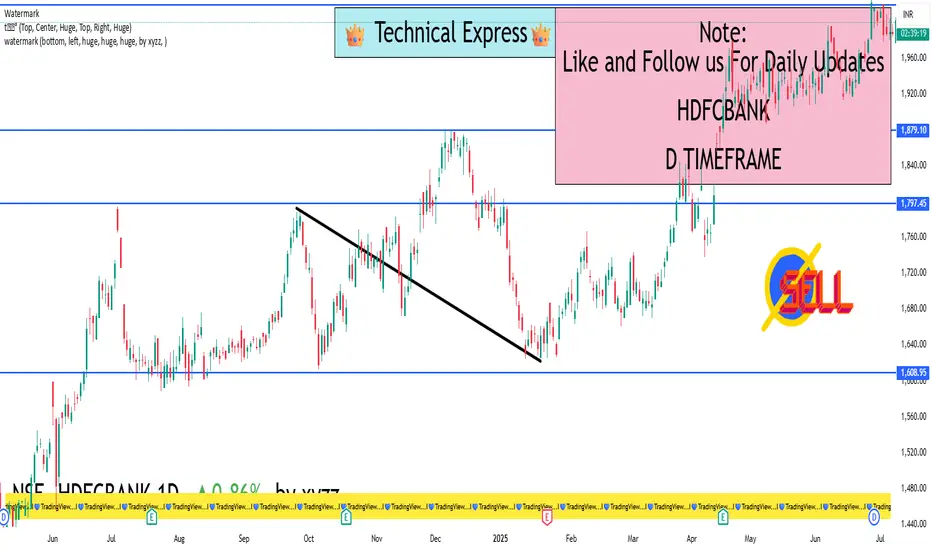
HDFCBANK 1D Timeframe📊 Current Snapshot
Price: Around ₹1,995 (~₹1,990–₹2,000 range)
52-week range: ₹1,588 – ₹2,027 — just below the recent high
✅ Technical Momentum
Overview: Daily technical summary is a "Strong Buy", with moving averages and indicators like RSI (55.3), Stoch, ADX, and CCI all in buy territory
Pivot Level Support: Standard pivots are around ₹1,995
RS Rating (ADR): Strong (83) — above the 80 mark, but extended — suggesting good trend; watch pullbacks
🛡️ Key Price Zones
Support / Buy-on-Dip Areas
₹1,995–₹1,998 – Daily pivot zone
₹1,982–₹1,990 – Standard S1 support
₹1,960–₹1,970 – Deeper Fibonacci/S2 pivot zone
₹1,932–₹1,940 – Strong long-term support (S3–S4 levels)
Resistance / Profit Exit Zones
₹2,007–₹2,015 – Immediate upside pivot resistance (R1–R2)
₹2,024–₹2,025 – R2 zone
₹2,030+ – R3/R4 zone — breakout territory
🧭 Action Plan
1. Currently Holding?
Stay invested — indicators are still bullish.
Think about taking partial profits in the ₹2,015–₹2,025 range, especially if the market overall gets choppy.
2. Planning to Buy?
Best entry: around ₹1,982–₹1,990 (safe zone).
If broader markets dip more, ideal accumulation range is ₹1,960–₹1,970.
Aggressive buying can start near ₹1,995 but keep stop-loss close.
3. Breakout Strategy
A clean, daily close above ₹2,025–₹2,030 on good volume opens up fresh upside toward all-time highs (~₹2,027+).
Can add more after breakout with confidence.
4. Risk Management
Entry around ₹1,982–₹1,990 → set stop-loss below ₹1,960.
If buying near ₹1,960–₹1,970 → stop-loss could be ₹1,930.
SENSEX 1D Timeframe📊 Current Snapshot (As of July 15, 2025)
Recent Close: ~₹82,250
Downside Trend: Sensex has fallen ~1,459 points over the past four trading days, dragging along Nifty—mainly driven by global trade fears, foreign fund outflows, and weakness in IT stocks
Chart Context: The index is approaching its key support area, making now a crucial moment for decision-making
🛡️ Key Support Levels (Buy-on-Dips Zones)
₹82,000 – ₹82,100
A recent intraday low and a likely pivot for the index.
Buying dips here can be a conservative entry for risk-averse investors.
₹81,200 – ₹81,400
Deeper support zone: acts as a cushion in case of broader market drops.
₹80,000 – ₹80,500
Major psychological and technical floor.
Ideal for strong, long-term buying if global headwinds intensify.
🚧 Resistance Levels (Where Pressure May Build)
₹82,450 – ₹82,500
Immediate resistance zone.
A daily close above here could indicate a relief rally.
₹83,000 – ₹83,100
A significant hurdle.
Clearing this, with volume, could trigger a larger bounce.
₹83,400 – ₹83,500
Heavy resistance.
Crossing this opens potential moves toward previous highs (~₹84,000+).
✅ What You, the Investor, Should Do
1. Already Holding?
Stay invested. Trend remains broadly positive unless Sensex closes below ₹81,200.
Consider partial profit-taking near ₹83,000–₹83,100 if you're risk-conscious.
2. Thinking of Buying?
Best zone: ₹82,000–₹82,100 — go slow and buy in tranches.
If deeper pullback: accumulate more near ₹81,200–₹81,400.
3. Playing a Bounce?
If Sensex closes firmly above ₹82,500, that’s a sign of relief.
You could add exposure aiming for ₹83,000+, with a stop-loss below ₹82,000.
4. Protecting Your Position
Stop-loss: consider exiting if Sensex closes below ₹81,200, which would suggest deeper weakness.
🧭 Your Daily ABCs for Sensex
A (Add): Buy near ₹82k and ₹81.2k – ₹81.4k
B (Breakout): Watch for close above ₹82.5k → opens path to ₹83k
C (Cut-loss): Exit below ₹81.2k to avoid deeper downside

Nifty is consolidating just under ~25,500–25,600
Current Market Picture
Nifty is consolidating just under ~25,500–25,600, having pulled back a bit after last week's dip due to global market jitters and some profit booking
🛡️ Key Support Zones (Ideal Buy-on-Dip Areas)
₹25,000 – ₹25,050
This is the most critical support. A daily close below this could signal deeper weakness.
₹24,900 – ₹24,950
A secondary support zone based on pivot points—if Nifty falls here, it's potentially a good buying window.
₹24,600 – ₹24,700
A deeper backing level used if global or domestic markets take a leg lower.
🚧 Crucial Resistance Levels (Upside Barriers)
₹25,500 – ₹25,600
Near-term ceiling. A breakout and close above ₹25,600 could usher in momentum toward ₹26,000.
₹26,000
Psychological and technical landmark. A decisive move above this signals a strong bullish tilt.
📌 What You Can Do
Already Holding: Stay invested. The trend is constructive unless ₹25,000 is decisively broken.
Looking to Buy:
Watch for mild dips toward ₹25,000–₹25,050—a safe area to add quality index or ETF positions.
Or buy shares now if you believe the upward trend and institutional flows are intact.
Upside Play: A clean daily close above ₹25,600 opens the path to ₹26,000, then all-time highs.

Advance Institutions Option Trading - Lecture 1Institutional traders are professionals trading for large entities like mutual funds, hedge funds, etc. Oftentimes they will trade options to hedge their positions, but they may also trade options as pure speculation.
Equirus Securities is one of the leading domestic institutional equities brokerage firms in India with more than 180 companies under over coverage and empanelment with almost all domestic institutions and many leading FIIs.

Trading Management and PsychologyTrading psychology refers to the mental state and emotions of a trader that determines the success or failure of a trade. It represents the aspects of a trader's behavior and characteristics that influence the actions they take when trading securities.
Trading Psychology simply refers to the feelings and emotions of a trader experiences and the associated actions the trader takes as a result. Just like in any other aspect of life, understanding how our mind works can improve our ability to trade better, take more informed, rational decisions and calculated risk.

PCR TradingThe Put-Call Ratio (PCR) is a popular technical indicator used by investors to assess market sentiment. It is calculated by dividing the volume or open interest of put options by call options over a specific time period. A higher PCR suggests bearish sentiment, while a lower PCR indicates bullish sentiment.
However, no PCR can be considered ideal, but usually, a PCR below 0.7 is typically viewed as a strong bullish sentiment while a PCR more than 1 is usually considered as a strong bearish sentiment.

Database Trading Options chain can be defined as the listing of all option contracts. It comes with two different sections: call and put. A call option means a contract that gives you the right but does not give you the obligation to buy an underlying asset at a particular price and within the option's expiration date.
In all, it is not gambling but is a type of speculation hence a government employee and PSU servants are not allowed to trade in options.

SPY -Forming Cup and handle pattern on daily SPY -Forming Cup and handle pattern on daily
Need to close abv 563. Today we had very good rally from 539.96 to 555.
we keep in watchlist.
Pattern valid only abv 563 close.

Rsi and Rsi Divergence #NSEThe Relative Strength Index (RSI) is a widely used momentum oscillator in technical analysis that helps traders identify overbought or oversold conditions in a market. Here’s a brief overview:
Interpretation:
Overbought: An RSI above 70 suggests that the asset might be overbought and could be due for a pullback.
Oversold: An RSI below 30 indicates that the asset might be oversold and could be due for a bounce.
Usage: Traders often use RSI in conjunction with other indicators to confirm signals and make more informed trading decisions..

RELIANCE Levels // 4 HOURHello Everyone 👋
Employee Stock Option Plans (ESOPs): Ahead of its anticipated initial public offering (IPO), Reliance Retail granted ESOPs worth ₹351 crore to 15 senior executives during the last financial year. The company issued 4.417 million shares at ₹796.5 per share to top-level employees, demonstrating its commitment to retaining and rewarding key leadership.
Reliance Retail, owned by Mukesh Ambani, is India’s largest retailer, serving 304 million registered customers and welcoming over 1.06 billion footfalls across its stores in the financial year 2023-24. Its diverse portfolio spans grocery, consumer electronics, fashion, lifestyle, and pharmaceuticals. Notable brands under Reliance Retail include Smart Bazaar, 7-Eleven, Fresh Signature, Freshpik, Netmeds (pharma), Tira (beauty), Reliance Digital, MyJio Store (electronics), and retail chains like Trends, Reliance Jewels, and Hamleys.

ICICIBANK Levels For Intraday or swing TradingChart Overview:
Current Price: ₹1,226.351.
Recent Performance:
1 day: +1.08%
5 days: +4.19%
1 month: +3.05%
6 months: +17.57%
Year to date: +23.68%
1 year: +26.43%
5 years: +199.18%
Support and Resistance Levels:
Pivot Points:
Resistance 1 (R1): ₹1,245.82
Resistance 2 (R2): ₹1,259.55
Resistance 3 (R3): ₹1,273.28
Pivot Point: ₹1,234.98
Support 1 (S1): ₹1,221.25
Support 2 (S2): ₹1,207.52
Support 3 (S3): ₹1,193.79

HDFCBANK Levels For Intraday or swing TradingChart Overview:
Current Price: ₹6,735.851.
Recent Performance:
1 day: -0.20%
5 days: +0.53%
1 month: +1.98%
6 months: +16.73%
Year to date: -4.06%
1 year: +4.82%
5 years: +45.74%
Support and Resistance Levels:
Pivot Points:
Resistance 1 (R1): ₹6,650.37
Resistance 2 (R2): ₹6,684.38
Resistance 3 (R3): ₹6,712.77
Pivot Point: ₹6,621.98
Support 1 (S1): ₹6,587.97
Support 2 (S2): ₹6,559.58
Support 3 (S3): ₹6,525.57
Fibonacci Pivot Points:
R1: ₹6,645.82
R2: ₹6,660.55
R3: ₹6,675.28

Nifty IT Levels For Long or swing TradingNifty IT Chart Overview:
Current Value: ₹24,7801.
Recent Performance:
1 day: +0.76%
5 days: +1.47%
1 month: +2.40%
6 months: +12.59%
Year to date: +15.11%
1 year: +29.61%
5 years: +127.45%
Key Data Points:
Volume: Not specified
Previous close: Not specified
Open: Not specified
Day’s range: Not specified
Recent Analyst Views (August 22nd):
Price was moving in a wide range for two days and broke out above the consolidation range.
Buy Above: ₹24,780
Stop Loss: ₹24,740
Targets: ₹24,820, ₹24,860, ₹24,890, and ₹24,920
Sell Below: ₹24,680
Stop Loss: ₹24,720
Targets: ₹24,640.

Bank-Nifty Levels // 15 Min Support and ResistanceHello Everyone 👋
# On TradingView, the levels for Bank-Nifty include:
Classic:
R1 (Resistance 1): ₹51,081.97
R2 (Resistance 2): ₹51,230.48
R3 (Resistance 3): ₹51,343.12
Pivot Point: ₹50,969.33
S1 (Support 1): ₹50,820.82
S2 (Support 2): ₹50,708.18
S3 (Support 3): ₹50,559.67

BAJFINANCE Support and Resistance Hello Everyone 👋
Pivot Points:
Classic Pivot Points:
Resistance 1 (R1): ₹6,650.37
Resistance 2 (R2): ₹6,684.38
Resistance 3 (R3): ₹6,712.77
Pivot Point: ₹6,621.98
Support 1 (S1): ₹6,587.97
Support 2 (S2): ₹6,559.58
Support 3 (S3): ₹6,525.57
Fibonacci Pivot Points:
R1: ₹6,645.82
R2: ₹6,660.55
R3: ₹6,684.38
Pivot Point: ₹6,621.98
S1: ₹6,598.15
S2: ₹6,583.42
S3: ₹6,559.58
Camarilla Pivot Points:
R1: ₹6,622.07
R2: ₹6,627.79
R3: ₹6,633.51
Pivot Point: ₹6,621.98
S1: ₹6,610.63
S2: ₹6,604.91
S3: ₹6,599.19
Relative Strength Index (RSI):
The RSI (14-day period) helps identify overbought or oversold conditions in the stock.
Interpretation:
RSI below 25: Oversold
RSI between 25 and 45: Bearish
RSI between 45 and 55: Neutral
RSI between 55 and 75: Bullish
RSI above 75: Overbought

Vix - Volatility Bearish Volatility is higher than avg/normal. Will not last up here very long. My expectation is lower after some distribution. Bearish Bias on Vix / Bullish Bias Assets

SPY WEEKLY 5TH FEB 2024This is my analysis for SPY for this week. Make sure to DM me for any questions or doubts.
NOTE:DO NOT SHORT THE MARKET


SPX vs Nifty - A lot of pain ahead for India Stock MarketsSPX is down 6.07% from Sep whereas Nifty is only down 0.74%. If the coupling still exists and we think of US markets as the mother market - then further pain awaits Indian indices.
There are 2 factors which could play spoilsport
1. Rising oil prices - going to cost dearly as we are a net oil importer
2. Rising dollar index - this will push down the INR much further
If India finds a way to buy oil in rupees - problem solved.
Nifty50 cannot remain elevated for so long if the global markets are falling.
Remember - when the rise is higher, the fall will be higher.
Or are the investors gung-ho on India's growth story?

Next low target for $SPY is 376.5Looking at SPY's Friday's Daily candle, it is no brainer that SPY has further downside.
The next strong support is around 376.5.
It doesn't seem likely that this support would be breached. SPY should this week touch this level or reverse very close to it like some where between 378 and 376.
