SRF LTD: Price Compression at Key Resistance|Clean Breakout Play📌 Structure: Daily Timeframe
SRF has been consolidating inside a clean descending channel, printing lower highs while demand holds near the channel base.
Price is now pressing against well-tested channel resistance — a clear decision zone.
🔴 Key Reads
Descending resistance respected multiple times
Tight price compression near supply → volatility contraction
Buying interest visible near demand
Muted volume during consolidation → pre-expansion behaviour
This is structure-led, not momentum-driven.
🟢 Breakout Rules (Strict)
Trade triggers only if:
Strong green Marubozu / near-Marubozu
Daily close above descending resistance
Clear volume expansion
No close above resistance = no trade.
🎯 Trade Plan
Entry: Breakout close
SL: Low of breakout candle
Target 1: ₹3300, then trail
Management: Trail via higher lows / structure
Defined risk. Reward from range expansion, not prediction.
🧠 Why It Works
- Long consolidation builds energy
- Repeated rejections weaken supply
- Channel breakouts often expand fast
Clean price + volume = institutional participation
⚠️ Invalidation
Weak breakout
Low volume
Rejection wick with close back inside channel
→ No trade
📊 Final Word
SRF is coiled, not weak.
Patience first. Execution only on confirmation.
➡️ Let price prove strength. 👍 Appreciate if this helps.
⚠️ Disclaimer
This is a technical study for educational purposes only, based purely on price action and volume.
Not financial advice. Please manage risk as per your own trading plan.
🔔 Follow
If you like clean, no-indicator, price–volume based setups,👉 Follow for more structure-led trade ideas and chart studies.
💬 Your Turn
Have a stock you want analysed using pure price action & volume?
Drop the name in the comments — I’ll pick a few and share clean charts.
Srfltd

SRF LTD - Short term Investment#SRF Limited - Technical Analysis
Current Price: 2,927.30
Quick Overview
Strategy: Short to Long Term Investment
Pattern: Multi-year consolidation breakout (Jan'21-Feb'25) with successful retest
#Technical Setup
✅ Long Consolidation Breakout & Retest - 4-year base broken
✅ Buy on Dips - Current correction = opportunity
✅ Sorted EMAs - All moving averages bullish
✅ Higher Highs - Clean uptrend structure
#Key Levels
Support:
- 2,838 (Immediate)
- 2,720 (Strong)
- 2,400 (Major - Weekly SL)
Targets:
- T1: 3,163
- T2: 3,472
- T3: 4,049
Entry Zones:
- Primary: 2,850 - 2,950 (Current)
- Secondary: 2,720 - 2,800 (on dips)
Risk-Reward: 1:2.3 (to final target)
#Strategy - Build positions in tranches during dips. Hold for short term for optimal returns. Book partial at ₹3,163, hold core for higher targets.
Disclaimer: For educational purposes only. Not investment advice. Markets are subject to risks. Consult a SEBI-registered advisor before investing. Past performance doesn't guarantee future results.
#SRFLimited #LongTermInvesting #BreakoutTrading #TechnicalAnalysis #NSE #ChemicalStocks #PatiencePaysPremium #IndianStockMarket #PositionalTrading

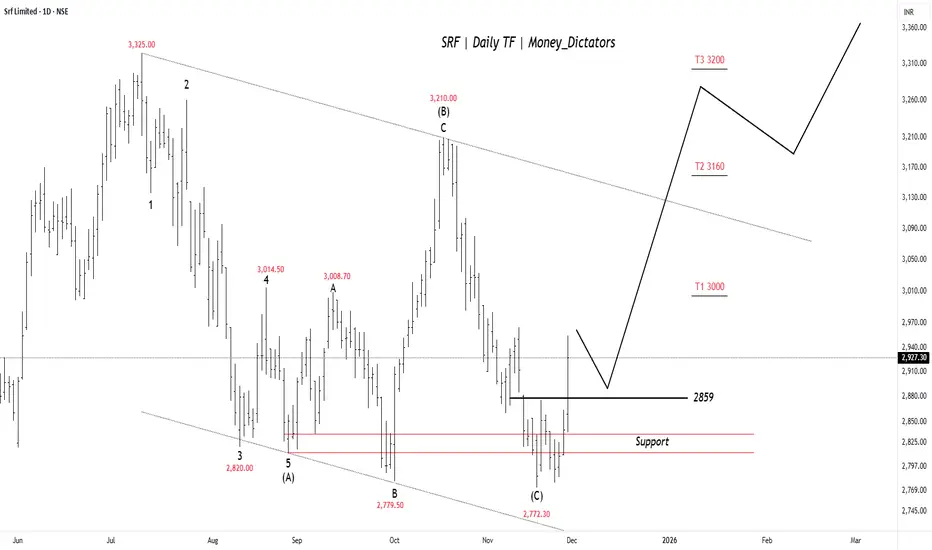
SRF on the Edge of a Sharp BreakoutSRF seems to have finished its ABC correction near the 2770–2800 support zone, and the price has bounced back above 2859 , which now acts as a short-term trigger. If the stock stays above this level, it can move toward 3000 first, then 3160 , and possibly 3200 . The chart shows buyers gradually taking control again after the correction, but the outlook stays positive only as long as price holds above the support region.
Stay Tuned!
@Money_Dictators
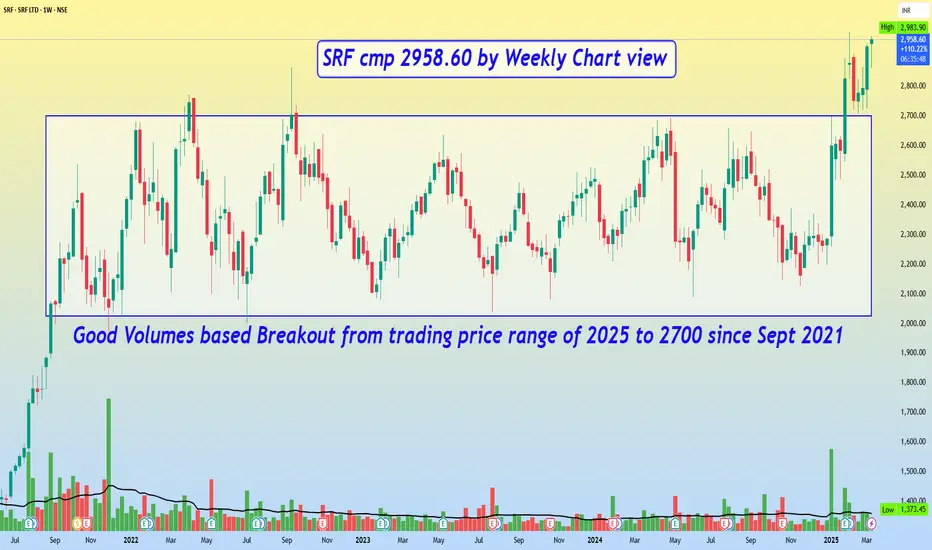
SRF cmp 2958.60 by Weekly Chart viewSRF cmp 2958.60 by Weekly Chart view
- Good Volumes based Breakout from trading price range of 2025 to 2700 since Sept 2021
- Stock is on verge to create New Lifetime High Milestone beyond ATH 2983.90 of 05-Feb-2025
- Bullish Rounding bottom has been formed with the neckline at current ATH 2983.90 price level
SRF - BREAKOUT TRADE OPPORTUNITYSymbol - SRF
CMP - 2750
SRF Limited, a diversified global player, operates in segments like chemicals, textiles, packaging films, and fluorochemicals. The company is a leader in its respective industries, offering products across industries ranging from automotive to pharmaceuticals. With a strong presence in both domestic and international markets, SRF has built a reputation for delivering innovation and sustainable solutions.
SRF stock has recently broken out of a significant resistance zone that had held for the last 3.5 years, signaling a potential shift in its price action. This breakout is a critical technical event, as it suggests that the stock may now enter a new phase of upward momentum, having overcome a major hurdle. Currently, the stock is in the process of retesting this breakout zone, which is a natural price action behavior that presents an attractive entry point for long positions. The stock is now trading at around 2750, providing a solid opportunity for investors who are looking for a favorable risk to reward setup.
Looking at the broader technical picture, the target for this breakout is 3500, which aligns with past resistance levels and technical projections. Given the strength of the breakout and the current retest of the breakout zone, this suggests that the stock could head toward the target level over the medium term. The stop loss for this trade can be placed at 2500, which provides a reasonable cushion in case the price action reverses.
From a fundamental perspective, SRF's consistent performance across its diverse business segments, strong market positioning, and impressive growth outlook support the case for a potential long-term bullish trend. The company’s fundamentals, coupled with this technical breakout, provide a solid base for investors to initiate long positions at these levels.
In conclusion, SRF’s recent price action and technical breakout suggest a promising opportunity for medium to long term investors. The stock offers a favorable risk to reward ratio at its current price level, and the target of 3500 looks achievable over the medium term. The downside risk appears manageable, with the stop loss placed at 2500
Disclaimer - Do not consider this as a buy/sell recommendation. I'm sharing my analysis & my trading position. You can track it for educational purposes. Thanks!

SRF Looking Good Post Q3 Results Can Accumulate when retest.NSE:SRF is showing strength with good Q3 Results and Future Outlook. It made a Gap-up post results and since then it has been attempting to break its long-time resistance which it has respected since Oct 2021 and can now break successfully. RSI is getting in the Overbought Zone and MACD is Positive.
F&O Activity:
Significant Long Build-up with 2700 CE showing a Significant decrease in OI.
Trade Setup:
Can Accumulate for Positional Trade once it retests to the mentioned different levels, I think it can fill the gap post results day so keep it in the watchlist and keep the last base mentioned as stop loss, for swing traders I think it will challenge it's long time resistance once so a swing is possible.
Target(Take Profit):
Upper Resistance Levels for Swing Trader. Positional Trader Aim for 10-15% Upside from Entry.
Stop-Loss:
Entry Candle Low For Swing Trader and a Red Coloured Base for Positional Trader.
📌Thank you for exploring my idea! I hope you found it valuable.
🙏FLLOW for more
👍BOOST if useful
✍️COMMENT Below your views.
Meanwhile, check out my other stock ideas below until this trade is activated. I would love your feedback.
Disclaimer: I am not SEBI REGISTERED RESEARCH ANALYST AND INVESTMENT ADVISER.
This analysis is intended solely for informational and educational purposes only and should not be interpreted as financial advice. It is advisable to consult a qualified financial advisor or conduct thorough research before making investment decisions.

SRF Ltd showing bullishness after a long consolidation.SRF Ltd is trading above the trading range and there are chance of the stock travelling forming new highs.
The stock has been consolidating in a range for over 3 years and finally the stock has closed above the resistance zone on the daily time frame.
In today's session the stock has move more than 6% and in current week it move 10% (approz).
After consolidating in a 40% range for a long time, there are chance the stock can test 4600-4700 levels this year.
Target levels :- 4692
Stop Loss :- 2480
Entry can be made once the stock retest the break out zone (around 2750-70).
Wait and watch for price action near the zone and trade accordingly.

SRF LTD - Long Range Breakout ?Simple Chart - Long Consolidation ( Flag Pattern ). Targets could be higher as well but taking it one by one due to overall market volatility.
Fundamentally :
The company has declared Negative results for the last 7 consecutive quarters
PAT(9M) At Rs 724.72 cr has Grown at -20.67 %
INTEREST(9M) At Rs 286.57 cr has Grown at 21.09 %
ROCE(HY) Lowest at 10.25
However looking at the chart, something has changed fundamentally which is why there is demand coming in from big players.
Specialty Chemical Outlook:-
Anticipate good Agro Demand in Q4 with significant improvement over Q3
Fluorochem Outlook:-
Q4 to perform significantly better ; Supported by higher HFC Volumes.
Packaging Film Outlook:-
Demand -Supply imbalance to continue but will soften.

SRF cmp 2680.50 by Weekly Chart viewSRF cmp 2680.50 by Weekly Chart view
- Volumes seen as stable and steady in sync with avg traded quantity
- Technically Stock Chart has made multiple Bullish Rounding Bottoms that are within the trading price range
- Stock is trading within Price Range 2080 to 2735 since September 2021 and waiting for good breakout

SRF Chart Signals Big Breakout OpportunityThe chart shows a weekly timeframe analysis of SRF Ltd (NSE) with a focus on a potential breakout. Here’s a breakdown of the analysis:
Pattern Identification
1. Symmetrical Triangle Pattern:
• The chart highlights a symmetrical triangle, where the price has been consolidating within converging trendlines.
• This pattern generally indicates a continuation or reversal, depending on the breakout direction.
2. Fair Value Gap (FVG):
• There is a Fair Value Gap (FVG) marked, which represents an imbalance in price action. It could act as a liquidity zone for price retracement.
3. Order Block (OB):
• An order block is highlighted, which is a strong demand zone. This suggests that buyers could step in, pushing prices higher.
Future Outlook
1. Bullish Breakout Expected:
• The arrows and target zones indicate that a bullish breakout from the triangle is anticipated.
• The projected upside move is around 665 points (25%-30%), aiming for targets near ₹3,300-₹3,400.
2. Potential Retest:
• A retest of the breakout level or a pullback into the order block (around ₹2,400-₹2,500) could occur before continuing upward momentum.
3. Secondary Triangle:
• Another smaller triangle formation is shown for the medium-term outlook, suggesting a consolidation phase before further movement.
Key Levels
• Support Zones: ₹2,357 (stop-loss region) and ₹2,486 (demand zone).
• Immediate Resistance: ₹2,606 (current breakout level).
• Target Zones: ₹2,791 and ₹3,300+ in the medium to long term.
This chart suggests a positive outlook for SRF Ltd, with a focus on confirming a breakout and maintaining the marked support levels.
DISCLAIMER- PLEASE DO YOUR OWN RESEARCH BEFORE INVESTING . THIS IS FOR EDUCATIONAL PURPOSES ONLY

Specialty Chemicals Sees Sharp Rise on Refrigerant Price Hike◉ Key Takeaways
● The phasing down of HFCs in the U.S. is driving significant changes in the refrigerant market.
● Indian specialty chemicals companies, particularly those involved in refrigerant production, are poised to benefit from this market shift.
● The demand-supply imbalance in the refrigerant gas segment is expected to persist, creating favourable conditions for industry growth.
◉ Introduction
On January 9, 2025, the Indian specialty chemicals sector witnessed a significant surge, driven by a sharp increase in refrigerant gas prices. This surge was primarily attributed to the phasing down of hydrofluorocarbons (HFCs) in the United States, as mandated by the U.S. Environmental Protection Agency (EPA).
◉ Market Dynamics
● Phasing down HFCs: The EPA aims to reduce hydrofluorocarbon (HFC) emissions by 85% over the next 15 years. This will impact the production and pricing of refrigerants.
● Refrigerant price increases: As HFC production declines, prices for existing refrigerants like R-410A and R-22 may rise. This could lead to higher costs for consumers and businesses.
● New refrigerant alternatives: The industry is shifting towards alternative refrigerants with lower global warming potential (GWP), such as R-32, R-454B, and R-1234yf. These alternatives may become more widely adopted and affordable.
◉ Impact on Indian Companies
The surge in refrigerant gas prices significantly benefited leading Indian players:
● SRF NSE:SRF and Navin Fluorine NSE:NAVINFLUOR : These companies were prominent beneficiaries, witnessing a remarkable 14% increase in their stock prices.
● Financial Gains: Analysts estimate that every $1/kg increase in R32 prices could boost SRF's EBITDA by ₹260 crore and Navin Fluorine's by ₹77 crore.
● Capacity Expansion: With SRF's production capacity for R32 at approximately 29,000 to 30,000 tons and plans for Navin Fluorine to double its capacity from 4,500 tons to 9,000 tons by February 2025, both companies are well-positioned to capitalize on this market shift.
◉ Wider Market Impact
The price hike triggered a broader rally in the specialty chemicals sector, with companies like Balaji Amines NSE:BALAMINES and Alkyl Amines NSE:ALKYLAMINE also witnessing stock price increases.
◉ Future Outlook
As the U.S. transitions to more environmentally friendly refrigerants, the dynamics of supply and pricing for these alternatives are likely to continue evolving. This evolving landscape presents significant opportunities for Indian specialty chemicals companies that are well-positioned to capitalize on the growing demand for these new-generation refrigerants.

SRF - Sideways to BullishStock at strong support area
2420-30 will act as bounce back zone
View negates below 2400
expected bounce up to 2550-2600
R:R excellent

SRF LTD Srf ltd is in do or die condition
Sideways from more than 500 days
buy above 2500
short below 2100
thanks

SRF LTD Making a "W" Pattern Good sign for Ready to BoomHi Friends,
Here I am analyzing SRF LTD Making a "W" Pattern Good sign for Ready to Boom,
What's your view ...????? Comment

Trend Reversal Possibility in SRFSRF Trend Reversal Possibility in SRF. Good move upside expected on breaking marked levels. Keep in watchlist. It can give good targets in short term.

SRF CAN IT BE A BUY ON THESE LEVELS Hello Friends,
Last month we have seen a small buying interest in many chemical stocks due to Chinese negative sentiments excluding SRF. In August few brokerage firms intiated buy call for this particular stocks that's the reason it didn't performed well as we all know how the buying calls Game Works. I have been tracking this stock from last few months.
We can buy SRF 2400 CE Options September Expiry Currently Trading at 59.90 it will cost you around 23000 to buy this option.
This OPTION CE looks very bullish besides the stock is being trading in a narrow range. It's a bit risky but worths a buy.
Target of this OPTION CE can be 275plus.
For more live trade you can subscribe to YouTube channel @brainvehicle
Disclaimer-Option Buying is Risky.

SRF LTD important levels to watch. the stock has started its downward movement from past few days. now the stock is trading near its important support zone marked on the chart.
More downside possible if the stock breaks down from the support and gives closing below the level on daily closing basis. Expected target can be next support zone marked in green on the chart.
Keep the stock on radar.
Follow us for more such information. If you like the idea motivate us by giving likes.
Disclaimer: This is only for educational purpose, do your own research before initiating any trade.

SRF Ltd. Possible Elliott wave counts, looks corrective phaseHello Friends,
Here we had shared possible wave counts of SRF Ltd. which is clearly showing corrective phase in current scenarios, After completing impulse move as 1-2-3-4-5 now we are in correction, which is unfolding as A-B-C as a zigzag correction pattern, which should unfold in 5-3-5 subdivisions, and already we had finished wave A and B, now possibly we are unfolding wave C which should come as in five subdivisions as a 1-2-3-4-5, in which we had finished 1-2 and now possibly we are in 3 of C, Overall, as per Elliott wave structure, bias are bearish in this stock, with Invalidation level of price crossing above 2636. which may give good lower levels in upcoming weeks.
Still there is a support area shared and discussed in this video post which is horizontal support zone, once its broken then for bears, but it can provide support also, so be cautious, Some significant snap shots are shared below, please go throughout once. I am not sebi registered analyst. My studies are for educational purpose only.
Please Consult your financial advisor before trading or investing. I am not responsible for any kinds of your profits and your losses.
MACD Negative crossover in Daily time frame
MACD in weekly making lower high and now in down tick position
MACD in monthly already running Negative
RSI on daily down tick and broken trendline support
RSI on weekly breakdown as head n shoulder pattern and also broken support trendline
Price closed below 20DMA and also challenging lower Bollinger band on daily
Most investors treat trading as a hobby because they have a full-time job doing something else.
However, If you treat trading like a business, it will pay you like a business.
If you treat like a hobby, hobbies don't pay, they cost you...!
Hope this post is helpful to community
Thanks
RK💕
Disclaimer and Risk Warning.
The analysis and discussion provided on in.tradingview.com/u/RK_Charts/ is intended for educational purposes only and should not be relied upon for trading decisions. RK_Charts is not an investment adviser and the information provided here should not be taken as professional investment advice. Before buying or selling any investments, securities, or precious metals, it is recommended that you conduct your own due diligence. RK_Charts does not share in your profits and will not take responsibility for any losses you may incur. So Please Consult your financial advisor before trading or investing.

SRF - 40% RETURNS!!!BUY - SRF LTD
CMP - Rs. 2552
Target - 1: Rs. 3150
Target - 2: Rs. 3600
.
.
Technicals - Stock is in consolidation, likely to break out.
.
This is just a view by an expert analyst, please invest at your own risk.
.
Follow me for more!

FALLING WEDGE PATTERN IN SRF LTD.NSE:SRF
Srf ltd forming a falling wedge pattern near major support on daily timeframe.
Good positional setup All levels are marked on chart.
Always trade with stoploss.
I Hope you found this helpful.
Please like and comment.
Keep Learning,
Happy Trading!

SRF Ltd: Setup to watch for...On a daily chart, the stock recently reclaimed the 200 day EMA with volume and is hovering above it.
Breakout above 2352 with initial resistance at 2416. Might see price consolidation in this zone.
Watch for positive price action above 2416 with volume.
2260 - 2240 are important nearest support zone.
However, do always keep a stop loss between 5-8%.
Note: Not a buy/sell recommendation. Do consult your investment advisor.


#srf #srflimited breakout levels NSE:SRF
SRF Limited stock might get good break out and it might complete these W patterns one by one.
One can go for swing as well as positional too.
**whatever charts or levels or ideas we are sharing here or on any other platform are just for educational purpose only, not a recommendation. Please do your own analysis before taking any trade on it. We are not SEBI registered.
