MASTEK - STWP Equity Snapshot________________________________________
📊 STWP Equity Snapshot – MASTEK
(Educational | Chart-Based Interpretation)
________________________________________
📌 Market Structure (Simple View)
Price has moved up sharply from a recent low, showing strong buying interest.
After the rally, price has paused and is moving sideways in a tight range.
This pause is happening above the rally midpoint, which keeps the structure positive.
👉 Buyers are still in control unless price breaks below the base.
________________________________________
🔄 Rally–Base Structure (Simple Explanation)
Strong rally shows clear bullish intent
Base is tight, showing selling pressure is weak
No sharp rejection from the top
Buyers are accepting higher prices
Risk is clearly visible below the base
This is a healthy pause, not weakness.
________________________________________
📌 Intraday Reference Levels (Structure-based)
Reference Price Zone: 2243
Risk Reference (If price weakens): 2149
Observed Upside Zones: 2337 → 2432
These are reaction areas, not predictions.
________________________________________
📌 Swing Reference Levels
(Hybrid Model | 2–5 days | Observational)
Reference Price Zone: 2243
Risk Reference (If support breaks): 2101
Higher Range Zones (If strength continues): 2432 → 2573
These levels reflect the bigger structure, not short-term noise.
________________________________________
📊 What the Chart is Saying (Very Simple)
Trend is up
Momentum is strong
Consolidation is healthy
Buyers are defending the base
Breakdown only if price closes below the base low
________________________________________
📈 Final Outlook (Condition-Based)
Momentum: Strong
Trend: Up
Risk: Moderate
Volume: Supportive
________________________________________
💡 STWP Learning Note
Strong rallies usually pause before moving further.
A tight base helps define risk and improves discipline.
Structure matters more than speed.
________________________________________
⚠️ Disclaimer
This post is shared only for educational and informational purposes.
It is not investment advice or a recommendation.
Please consult a SEBI-registered financial advisor before making any financial decision.
________________________________________
📘 STWP Approach
Observe price. Respect risk.
Let structure guide decisions — not emotions.
🚀 Stay Calm. Stay Clean. Trade With Patience.
________________________________________
Stockmarketanalysis

Hidden Channels & Fib Golden Zone : Beauty of Price ActionObservational Post only Showcasing how price action works using historical price points only
Observe how price elegantly respects this counter trendline on the weekly chart (red line), forging consistent lower highs through precise rejections. A subtle parallel channel lurks beneath, acting as a hidden guardian. Channels like these shield against fakeouts, confirming pure breakouts only when breached alongside key lines.
Shifting to the monthly view, the Fib retracement from swing low to high highlights the golden zone (50 to 61%, white shaded), a magnet for retracements where price often pauses or reverses with stunning symmetry.
This interplay reveals price action's beauty: layers of structure working in harmony, rewarding patient observers.
Disclaimer: This is for educational purposes only, showcasing historical price action observations. Not financial advice. Always conduct your own analysis and manage risk appropriately.

KAYNES - Oversold Demand-Zone Reversal Attempt💹 Kaynes Technology India Ltd (NSE: KAYNES)
Sector: Electronics Manufacturing | CMP: 4331 | View: Oversold Demand-Zone Reversal Attempt
Price Action
Kaynes witnessed a sharp vertical decline from the 7800 supply belt and has now landed directly on its major multi-month demand zone between 3710–3900. The latest session delivered a wide-range bullish reaction candle, signalling early evidence of absorption after a heavy liquidation phase. Price is currently stabilizing within a critical structure where further downside may ease if demand continues to hold.
VCP Analysis
The stock has moved from a wide high-volatility decline into the first compression point at the lower demand cluster. Although not a textbook VCP, the pattern resembles early-stage volatility contraction after a capitulation event. Buyers have shown intent inside the zone, and any narrowing of daily ranges around 4000–4300 may signal the beginning of a reclaiming structure.
STWP Trading Analysis
Momentum indicators show downward fatigue — RSI is deep oversold and beginning to curl, MACD histogram reflects slowing bearish force, and Stochastic is trying to reverse from lower bounds. Price behaviour suggests the initial capitulation may be complete, as the sudden spike in volume indicates potential strong-handed accumulation. The trend remains broadly negative, but the first signs of stabilization are visible. Sustaining above 3884 keeps the recovery sequence alive; losing it can re-open downside continuation.
Fibonacci Analysis
Using the swing high at 7822 and swing low at 3712:
0.236 Retracement: 4682
0.382 Retracement: 5282
0.5 Retracement: 5767
Kaynes currently trades below all key retracement levels. A clean push above 4606–4682 (Fib 0.236 region) is essential to unlock further retracements. These levels will act as layered resistance zones during the potential upside path.
STWP Support & Resistance
Strong Supports: 3884 (Primary demand support) | 3437 | 3161
Overhead Resistances: 4606 | 4882 | 5329
Price is positioned directly above major structural support with massive volume backing — a region where reversals traditionally form if sustained accumulation continues.
STWP Volume & Technical Setup
Volume hit an exceptionally high reading, reflecting a potential capitulation or institutional absorption event. Such spikes often mark the beginning stages of a base. The EMAs are widely stretched — a characteristic of trend exhaustion — and may gradually compress if price stabilizes. The volume–price behaviour hints at shift in market tone, where forced selling may have met deep-pocket buyers at the demand floor.
⚠️ STWP Legal Disclaimer
This document is strictly for educational and informational purposes. All examples, charts, levels, and option structures discussed are illustrative and are not intended as buy, sell, or hold recommendations. STWP does not provide investment advice, trading tips, signals, or personalized financial guidance of any kind, nor is it a SEBI-registered intermediary or research analyst. The analyses, illustrations, and risk–reward structures included here are generic in nature and based on publicly available data and observed market behaviour, which may change without notice. Financial markets involve significant risk; derivatives in particular carry the potential for substantial losses. Option premiums, implied volatility, open interest, delta, and other market variables can fluctuate rapidly and unpredictably.
Readers are solely responsible for their trading decisions, capital management, and risk assessment. Before making any investment or trading decision, please consult a SEBI-registered investment advisor. STWP, its representatives, and affiliates shall not be liable for any direct or indirect loss arising from the use of this material. Historical patterns or past market behaviour do not guarantee future outcomes, nor should any part of this document be interpreted as a promise of performance, accuracy, or returns.
Position Status: No active position in this instrument at the time of analysis.
Data Source: TradingView & NSE India.
💬 Found this useful?
🔼 Boost this post to support structured learning
✍️ Share your thoughts or questions in the comments
🔁 Forward this to traders who value clean technical studies
👉 Follow for disciplined, structured, STWP-style analysis
🚀 Stay Calm. Stay Clean. Trade With Patience.
Trade Smart | Learn Zones | Be Self-Reliant 📊

How to Read Candlestick Patterns like a PRO - Price action I make educational content videos for swing / positional trading - breaking down price action movements into simpler steps to make you guys understand the concepts .
Charts used are 3 months or older .

#nifty view Nifty opened today at 25,863.8 after an initial upside move to 25,955.75, reflecting early bullish momentum. However, the index faced resistance at these higher levels and saw a reversal, dropping to a low near 25,800 during the session. This downside move highlights renewed selling pressure, making 25,800 a decisive support zone for the day.
If Nifty fails to sustain above 25,800, further downside risk remains, and additional selling could intensify, potentially accelerating the decline. Therefore, traders should monitor 25,800 closely—holding above it may invite a recovery, while a clear breach signals the possibility of deeper corrections.
#nifty50 #stockmarket #niftyanalysis #stockmarketindia #investing

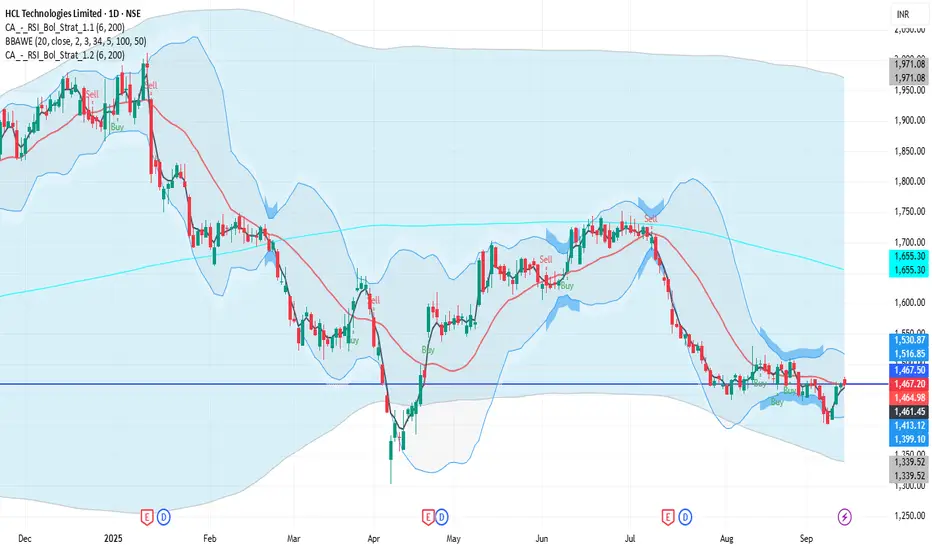
HCLTECH 1D Time frame📉 Current Market Snapshot
Current Price: ₹1,467
Previous Close: ₹1,467.20
Day’s Range: ₹1,463 – ₹1,480
📊 Key Support & Resistance Levels
Support Levels: ₹1,463, ₹1,450
Resistance Levels: ₹1,480, ₹1,500
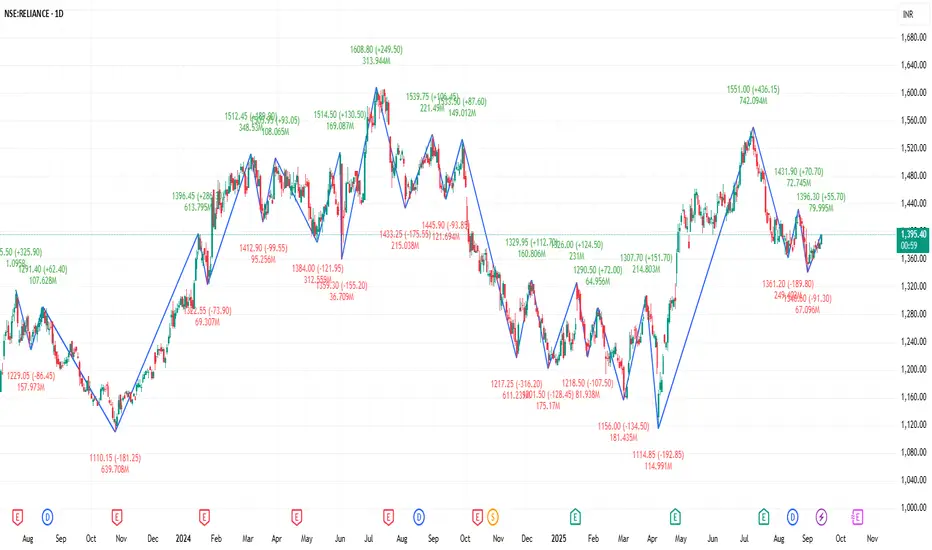
RELIANCE 1D Time frame🔢 Current Level
Trading around ₹1,393 - ₹1,395
🔑 Key Resistance & Support Levels
Resistance Zones:
~ ₹1,400 – ₹1,431 (immediate resistance band)
~ ₹1,440 – ₹1,460 (higher resistance if momentum continues)
Support Zones:
~ ₹1,380 – ₹1,370 (short-term support)
~ ₹1,360 (important support below)
📉 Outlook
Bullish Scenario: Holding above ₹1,400 and breaking past ₹1,431 can open the path toward ₹1,440–₹1,460.
Bearish Scenario: A fall below ₹1,370–₹1,360 increases risk of deeper decline.
Neutral / Range: Between ₹1,360–₹1,431, Reliance may move sideways until a clear breakout happens.
SENSEX 1D Time frame📍 Current Price Action
Current Level: 81,548
Day’s Range: ~80,320 – 81,550
52-Week Range: 71,425 – 85,978
⚙ Technical Indicators
RSI (14): Around 43 → neutral to slightly bearish zone
MACD: Negative → mild downward pressure still visible
ADX (14): ~35-40 → moderate trend strength
Stochastic Oscillator: Near overbought zone → possible short-term pullback
Moving Averages:
Short-term (5, 10, 20-day): Mixed
Medium & long-term (50, 100, 200-day): Acting as resistance near highs
📊 Key Levels
Immediate Support: 80,800 – 81,000 zone
Immediate Resistance: 81,600 – 81,800 zone
Breakout Levels:
Above 81,800 → upside momentum could target 82,200+
Below 80,800 → downside may test 80,300 – 80,000
🧠 Summary
Sensex is currently at 81,548, near its resistance zone. Trend is neutral to mildly bullish in the short-term. Sustaining above 81,600–81,800 will confirm strength for further rally. A failure to hold could trigger a pullback toward 80,800–80,300.

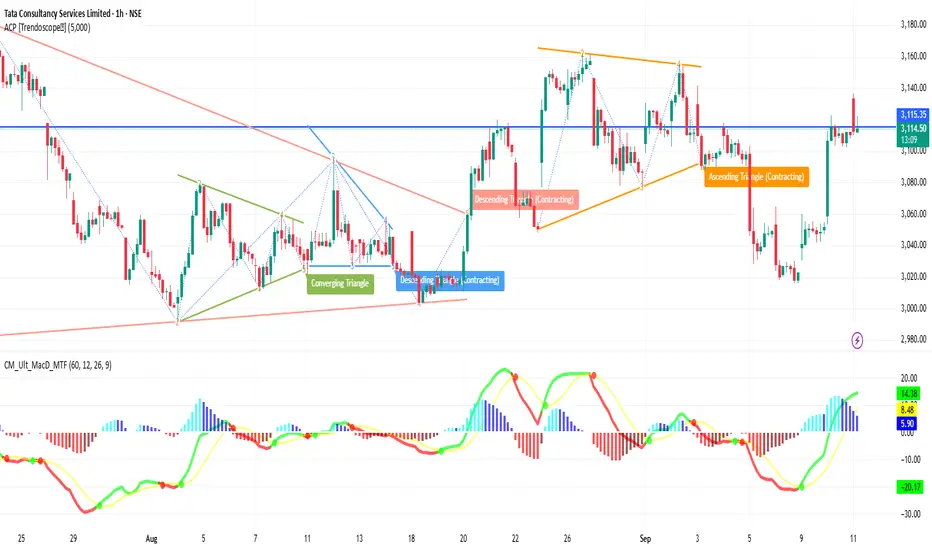
TCS 1H Time frameTCS 1-Hour Snapshot
Price is around ₹3,110
Showing small gains in recent sessions
Has been under pressure from broader IT sector weakness, but holding above some short-term support
🔎 Technical Indicators & Trend
Moving Averages (short-term hourly) are slightly below current price → providing support
Medium-term MAs (50-hour etc.) are above → resistance overhead
RSI (hourly) is moderately neutral—neither strongly overbought nor oversold
Trend strength appears modest; no sharp momentum bars or volume spikes indicating breakout
🔧 Support & Resistance Levels (1H)
Support: ~₹3,080–₹3,090 first support zone
Resistance: ~₹3,130–₹3,140 nearby resistance
🧭 Short-Term Outlook
Bullish Case: A break above ~₹3,130-3,140 with volume could push toward ~₹3,160
Bearish Case: If it fails to break resistance and drops below ~₹3,090, possible move toward ~₹3,060
Overall Bias: Slightly bullish to neutral; waiting for confirmation from resistance breakout
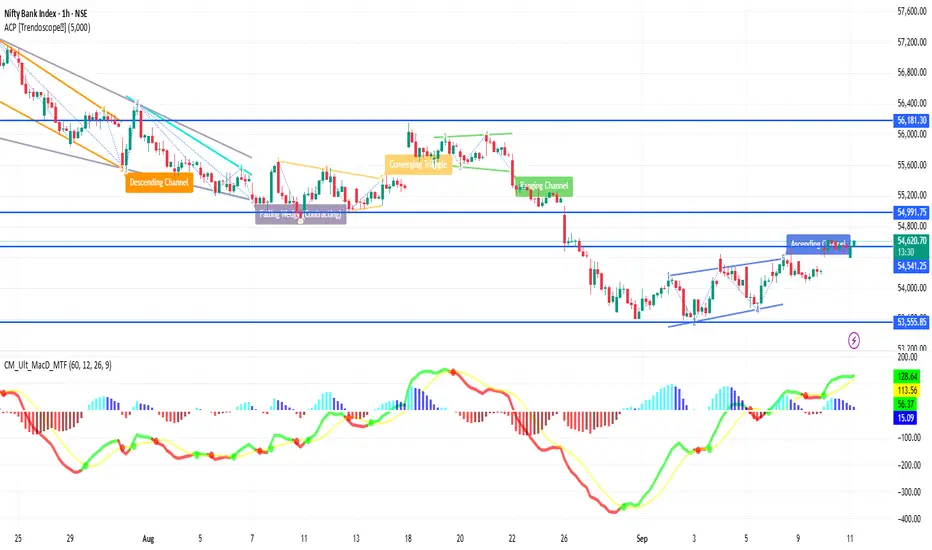
BANKNIFTY 1H Time frameBankNifty 1H Snapshot
Current Price: ~54,581
Recent Range: ~54,400 – 54,700
Bias: Slightly bullish, holding above short-term support
📈 Key Levels
Immediate Resistance: 54,650 – 54,700
Next Resistance: 54,800 → if broken, can open upside momentum
Immediate Support: 54,450
Deeper Support: 54,300 → then 54,000
🔎 Indicators (1-Hour)
RSI: Mid-60s → bullish but not yet extreme
MACD: Positive crossover → supports buying momentum
Stochastic: Near overbought → watch for minor pullback
🧭 Outlook
Bullish Case: Sustained above 54,600 → next push toward 54,700-54,800
Bearish Case: Slip below 54,450 → opens weakness toward 54,300
Overall Bias: Moderately bullish while holding above 54,450
Amara Raja Energy & Mobility Ltd. LongAmara Raja Energy & Mobility Ltd. is currently presenting a strong long trade opportunity, supported by a blend of bullish technical signals and long-term structural tailwinds in the EV and energy storage sectors.
Breakout Confirmation: The stock has recently broken out of a descending trendline that held since early 2024, on the back of above-average volume, signaling institutional interest.
Bullish Structure: A clean higher high, higher low formation is emerging on the Daily timeframe, indicating the early stages of a potential uptrend.
Support Zone: Price is retesting the key demand zone around ₹800–₹820, which acted as a major support-resistance flip level in the past.
Moving Averages:
21 EMA and 50 EMA have crossed bullishly with price holding above both, suggesting short- to medium-term strength.
200 EMA is flat-to-rising, showing long-term strength isn’t compromised.
MACD is turning upward with a fresh bullish crossover near the zero line — a sign of early momentum return.
RSI is comfortably above 55 but not overbought (~60–65), confirming room for upside without exhaustion.

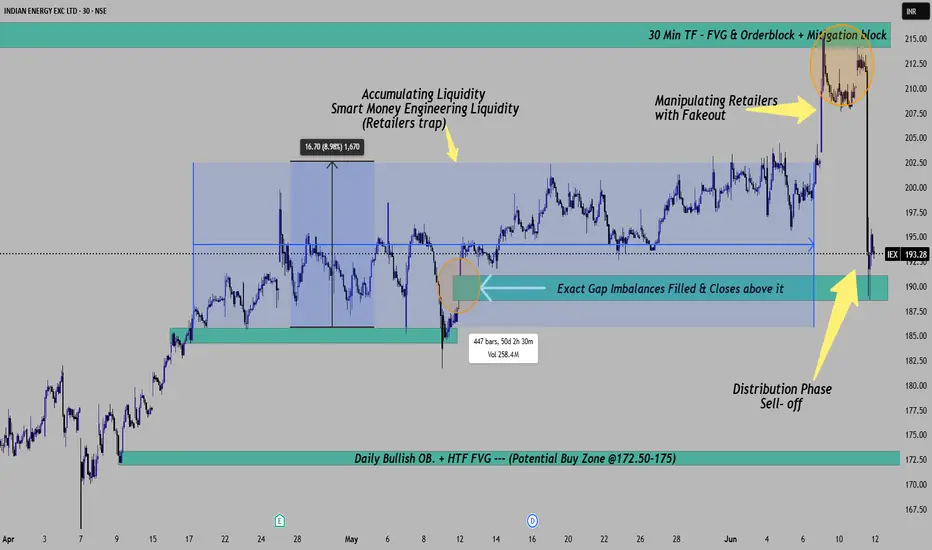
Indian Exchange EXC Ltd. #IEX Smart Money BreakdownIndian Energy Exc Ltd.
I tried to analyze deeply how and why Smart money gave this fall and reason behind this.
Timeframe used here is --- 30 min
Here i saw Power of 3 concepts, Accumulation, Manipulation and Distribution
I would like to discuss in short about the happening in the share price ---
1. Accumulation phase ---
Multiple Liquidity sweeps and consolidation formed a retailer's trap between 185-201 levels
(It took 50 days into consolidation and hovered in 15 points {185-200} )
2. Manipulation phase ----
Retailers trapped during the breakout followed by a fake out reversal.
Price made 2 times rejection from 30 min time frame FVG + Order block levels
3. Distribution phase -----
Price started rejecting HTF POI and started sharp sell-off.
Here we can understand that smart money exited positions and made sell-off.
Also, we see today price made a low exact at the level where Gap Imbalance was created.
here we can also see that, today in a single day price moved from 214 to 188.
Anything rests, Explained in the chart itself.
Expectation for next move ----Potential upside from 172-175 levels.
(Views are only for educational purpose. Do not consider it as an investments planning.)
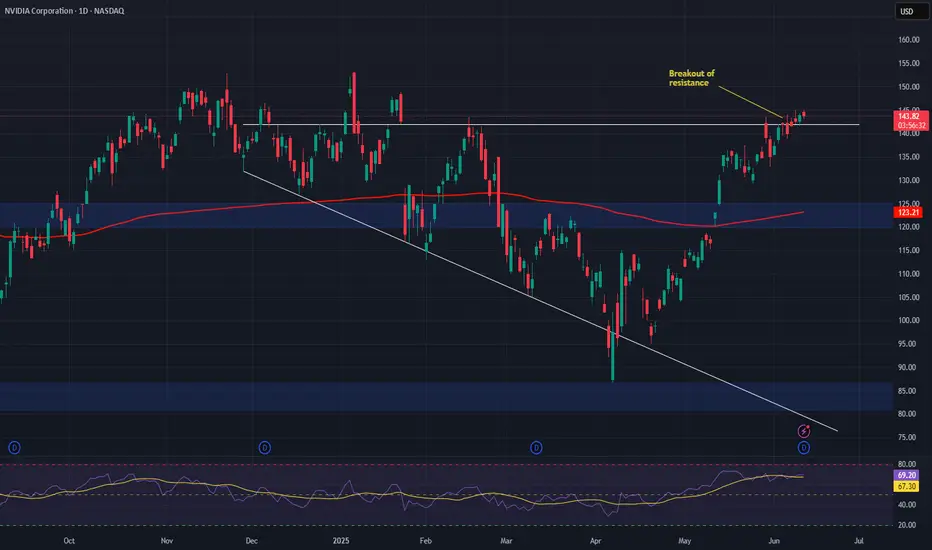
Nvidia (NVDA) – Building the AI Wave, Not Just Riding ItCompany Overview:
Nvidia NASDAQ:NVDA remains the undisputed leader in AI, high-performance computing, and now increasingly software infrastructure. With growing exposure to agentic AI, healthcare AI, and autonomous systems, Nvidia is redefining its growth story beyond semiconductors.
Key Catalysts:
🧠 Software Ecosystem Expansion
AI Blueprints, Llama Nemotron, and NIM microservices fuel adoption of agentic AI
High-margin, recurring revenue from software complements GPU hardware growth
Moves Nvidia closer to a platform-as-a-service model
🏥 Healthcare AI Momentum
Siemens Healthineers adoption of MONAI Deploy accelerates Nvidia’s footprint in diagnostics & imaging
Opens the door to pharma, life sciences, and clinical AI markets—a multi-billion-dollar TAM
🔧 Physical & Agentic AI Enablement
Positioned at the frontier of robotics, autonomous machines, and next-gen interfaces
Nvidia's tech stack is becoming foundational to the next wave of machine intelligence
Investment Outlook:
✅ Bullish Above: $120.00–$125.00
🎯 Target Price: $220.00–$230.00
📈 Thesis Drivers: AI platform leadership, expanding software revenue mix, and key vertical growth in healthcare & robotics
🧩 Nvidia isn’t just enabling AI—it’s defining its future. NASDAQ:NVDA #AIStocks #AgenticAI #Semiconductors
Nifty 50 Analysis For May 9, 2025Key Points for Nifty 50 Analysis on May 9, 2025
It seems likely that the Nifty 50 will remain range-bound, with support at 24,152.00 INR and resistance at 24,273.80 INR, based on recent trading data.
Research suggests a potential bounce if the index holds above support, supported by buying interest and RSI divergence, but selling pressure could push it lower.
The evidence leans toward moderate volatility, with possible price movements of ±140.50 INR, influenced by technical indicators and market sentiment.
Current Market Overview
On May 8, 2025, the Nifty 50 index showed a volatile session, closing at 24,153.20 INR by 2:00 PM (based on available data up to that time), with a daily high of 24,450.00 INR and a low of 24,093.00 INR. The market exhibited net selling pressure, with a total delta of -4.05M, but buying interest was noted at key support levels, particularly around 24,152.00 INR.
Technical Analysis
Key support is at 24,152.00 INR, where significant buying activity was observed, and resistance is at 24,273.80 INR, a high-volume level with selling pressure. The RSI at 60.89 suggests neutral conditions, with a divergence that could signal a potential reversal. The ATR of 140.50 indicates moderate volatility, suggesting possible price swings of around ±140.50 INR on May 9, 2025.
Outlook for May 9, 2025
If the Nifty 50 holds above 24,152.00 INR, it may bounce toward 24,273.80 INR or higher, potentially testing 24,400.00 INR. However, a break below support could lead to a decline toward 24,093.00 INR. The market is likely to be driven by technical factors, with no major economic events identified for May 9, 2025.
In-Depth Survey Note: Comprehensive Analysis of Nifty 50 for May 9, 2025
Introduction
This detailed analysis examines the Nifty 50 index, a benchmark for the Indian equity market, focusing on its potential performance on May 9, 2025, based on trading data from May 8, 2025. The analysis leverages technical indicators, volume analysis, and market sentiment to provide a thorough outlook, suitable for publication on TradingView Ideas. Given the future date, this report relies on the most recent available data and general market trends, acknowledging the inherent uncertainties in forecasting.
Market Context on May 8, 2025
On May 8, 2025, the Nifty 50 index exhibited significant intraday volatility, with the following key price levels derived from the trading chart:
Opening Price: 24,273.80 INR
High: 24,450.00 INR
Low: 24,093.00 INR
Price at 2:00 PM: 24,153.20 INR (last available data point, as the chart covered from 11:00 AM to 2:00 PM IST)
The index experienced a decline from its intraday high of 24,450.00 INR to 24,153.20 INR by 2:00 PM, reflecting a bearish intraday trend. The total delta for the session was -4.05M, indicating net selling pressure, with significant selling activity at key levels such as 24,273.80 INR (total volume 411.36M, delta -63.95M) and 24,400.00 INR (delta -92.82M). However, buying interest was evident at lower levels, particularly around 24,152.00 INR, where green bars (buy orders) were prominent, suggesting potential support.
The Relative Strength Index (RSI) was recorded at 60.89, which is in neutral territory (neither overbought, above 70, nor oversold, below 30). Additionally, a divergence between price and RSI was noted, marked with a purple dot on the chart, which could signal a potential reversal or continuation, depending on confirmation. The Average True Range (ATR) was 140.50, indicating moderate volatility and suggesting possible price movements of approximately ±140.50 INR on May 9, 2025.
Technical Analysis
Support and Resistance Levels
Based on the data from May 8, 2025, the following support and resistance levels are identified:
Support Levels:
24,152.00 INR: This level showed significant buying interest, with notable green bars indicating buyer activity, making it a critical support for May 9, 2025.
24,093.00 INR: The intraday low on May 8, 2025, which could act as additional support if the index breaks below 24,152.00 INR.
Resistance Levels:
24,273.80 INR: A high-volume level with a delta of -63.95M, indicating strong selling activity, likely to act as resistance.
24,400.00 INR: Another key resistance with heavy selling pressure (delta -92.82M), where sellers have been active.
24,450.00 INR: The intraday high on May 8, 2025, serving as a psychological and technical resistance.
These levels are derived from the volume and delta analysis, which highlight areas of significant market activity and potential price reaction points.
Volume and Delta Analysis
The volume and delta data provide insights into market sentiment:
The total delta of -4.05M reflects net selling pressure, with significant sell volumes at 24,273.80 INR (411.36M volume, -63.95M delta) and 24,400.00 INR (392.82M volume, -92.82M delta).
Conversely, buying interest was observed at 24,152.00 INR and 24,325.00 INR, with deltas of 34.37M at the latter, indicating areas where buyers stepped in.
The number of rows (transactions) was 24, with an up/down ratio of 70, suggesting more downward movements, though the exact interpretation of this ratio is unclear without additional context.
This analysis suggests that while sellers dominated at higher levels, buyers are active at lower levels, particularly around 24,152.00 INR, which could act as a pivot point for May 9, 2025.
ATR and Volatility
The ATR of 140.50 indicates the average volatility over the period, suggesting that on May 9, 2025, the Nifty 50 could see price movements of approximately ±140.50 INR.
Upside Potential: 24,153.20 INR + 140.50 INR = 24,293.70 INR, which is near the resistance at 24,273.80 INR.
Downside Risk: 24,153.20 INR - 140.50 INR = 24,012.70 INR, below the intraday low of 24,093.00 INR.
This volatility measure is crucial for setting stop-loss and take-profit levels for traders.
Potential Patterns
The price action on May 8, 2025, showed a decline from 24,450.00 INR to 24,153.20 INR, with some consolidation near the lower levels. This could be forming a flag pattern or a channel, which are typically continuation patterns in technical analysis. However, the bullish divergence in RSI suggests that a reversal could also be in play. If the price holds above 24,152.00 INR, it might indicate the formation of a support base, potentially leading to an upward move toward resistance levels.
Economic and Market Context
A web search for major economic events on May 9, 2025, in India revealed no specific indicators or events scheduled for that date, based on available economic calendars such as Trading Economics (last updated May 6, 2025) and Investing.com. This suggests that the market on May 9, 2025, is likely to be driven by technical factors and global cues rather than domestic economic data releases. However, general economic outlooks, such as those from Deloitte, indicate a cautiously optimistic growth trajectory for India in 2025, which could provide a supportive backdrop.
Outlook for May 9, 2025
Based on the technical analysis and market data from May 8, 2025, the following scenarios are possible for the Nifty 50 on May 9, 2025:
Bullish Scenario:
If the Nifty 50 holds above the support level of 24,152.00 INR, it could see a bounce toward the resistance at 24,273.80 INR. A confirmed bullish divergence in RSI could further support this move, potentially pushing the index toward 24,400.00 INR or even the intraday high of 24,450.00 INR. The buying interest at 24,152.00 INR suggests that buyers are willing to step in, which could act as a springboard for an upward move.
Bearish Scenario:
If the Nifty 50 breaks below 24,152.00 INR, it could test the intraday low of 24,093.00 INR. Further selling pressure could push the index toward 24,000.00 INR or lower, especially if the bearish sentiment from the negative delta (-4.05M) continues. However, the presence of buying interest at 24,152.00 INR makes a significant breakdown less likely unless there is a major external trigger, such as adverse global market movements.
Neutral/Consolidation Scenario:
The Nifty 50 could continue to consolidate between 24,152.00 INR and 24,273.80 INR, as the market digests the recent volatility. The RSI at 60.89 is not signaling extreme conditions, which supports the possibility of a sideways move, particularly if there are no significant catalysts.
Trading Strategy and Key Levels
For traders, the following key levels are critical:
Buy Zones: Look for buying opportunities near 24,152.00 INR, with a stop-loss below 24,093.00 INR, targeting 24,273.80 INR or higher.
Sell Zones: Consider selling near 24,273.80 INR or 24,400.00 INR, with a stop-loss above 24,450.00 INR, targeting 24,152.00 INR or lower.
Volatility Consideration: Given the ATR of 140.50, set appropriate risk management levels to account for potential price swings.
Conclusion
The Nifty 50 on May 9, 2025, is likely to remain range-bound, with immediate support at 24,152.00 INR and resistance at 24,273.80 INR. A hold above support could lead to a potential upward move toward 24,400.00 INR, supported by the bullish divergence in RSI. Conversely, a break below support could trigger further selling pressure, testing 24,093.00 INR. Traders should closely monitor price action around these levels and consider the moderate volatility indicated by the ATR of 140.50.
This analysis is based on the provided chart data and general technical analysis principles, acknowledging the limitations due to the future date and lack of real-time economic events for May 9, 2025.

NSE IONQ - Are we ready for a breakout?The corrective phase is complete and an impulse move appears likely. A strong buy above the A-B-C channel could target levels around 30 - 37 - 45 or higher. Good entry is possible above 26 . However, if conditions worsen, further corrections may ensue.
I will update further information soon.

Union Bank of India - Inverse Head & Shoulders Breakout!Union Bank of India (NSE: UNIONBANK)—Inverse Head & Shoulders Breakout! 🚀
📈 Chart Overview:
The stock has formed a multiple inverse head & shoulders pattern, indicating a strong bullish reversal.
A downtrend resistance has been breached, confirming bullish momentum.
🔍 Key Levels:
Resistance Levels: ₹140, ₹150
Support Levels: ₹125, ₹120
📊 Observations:
Volume spike supports the breakout, signaling strong buying interest.
RSI at 66.34, approaching overbought levels but still has room for further upside.
Sustaining above ₹130.02 will confirm further bullishness.
🚀 Trading View:
A breakout above ₹135 could lead to a further rally toward ₹140-₹150.
Any retest of ₹130.02 can act as a potential buying opportunity.
📌 Disclaimer: This is for educational purposes only. Always conduct your research before making any investment decisions.

DIIs Buying Every Day: What They Are Buying in a Falling Market?Hello Traders!
In today's post, let's talk about an interesting phenomenon in the Indian stock market. Despite the market showing signs of falling , we are consistently seeing DIIs (Domestic Institutional Investors) buying in large quantities every day, with numbers around 3,000-4,000 crores daily.
So, what does this tell us? Why are DIIs continuing to buy despite the market's decline?
Key Points to Understand:
DIIs are investing heavily: While retail investors and FIIs may be cautious or pulling back, DIIs are buying, possibly indicating that they believe the current market price is undervalued.
Tracking their moves: To understand where the money is flowing, we need to track the stocks that DIIs are buying. Are they focusing on large-cap stocks, sectors with growth potential, or defensive sectors?
Possible market confidence: This continuous buying might signal confidence from domestic institutions, showing they believe in the long-term growth potential despite short-term volatility.
What does this mean for us?: As retail traders, it’s crucial to track DII buying patterns to align our strategies with their actions. If DIIs are buying into a stock or sector, it could be a strong signal that it’s worth considering for your portfolio.
How to Track DII Purchases:
Follow the DII data: Most financial platforms and stock market websites show DII buying/selling data regularly.
Look for trends: If the same stocks are being purchased consistently, there could be something significant happening in those companies.
Be patient: Even if the market seems to be in a downtrend, the sustained buying by DIIs can provide confidence for long-term investors.
Conclusion:
DIIs are not just following the market, they are actively buying in the face of adversity, and this can be a crucial indicator of future market movement. Keep an eye on what they are buying every day, and align your strategies accordingly. Remember, they are in the market for the long-term, and if they believe in it, we should too.

NIFTY weekly ViewNifty is opening gap down. One should wait for a reversal or at least for a cool off in RSI. Trade between these trendlines. If it breaks then support then follow a short trade and vice versa.
NOTE: I'm not a SEBI Reg. Study before investing into the markets.

Mastering Macro Trading with Stanley Druckenmiller's StrategiesStanley Druckenmiller: Master of Macro Trading and Market Predictions
Hello Traders!
Today, we’re diving into the brilliant mind of Stanley Druckenmiller, one of the most respected hedge fund managers and market analysts in the world. Known for his exceptional ability to predict macroeconomic trends and navigate financial markets with precision, Druckenmiller’s approach has shaped the way many traders think about risk management and market forecasting.
Druckenmiller’s career spans several decades, and his strategy focuses on macro trading, global trends, and staying ahead of the curve by making bold, well-timed bets. He’s best known for his time working with George Soros, where they famously shorted the British pound during the 1992 Black Wednesday crisis, making billions in profit. This move alone solidified his reputation as a top-tier investor.
Key Elements of Stanley Druckenmiller's Trading Style
Focus on the Big Picture: Druckenmiller believes in understanding global macroeconomic trends, rather than focusing on individual stocks. He tracks key economic indicators such as central bank policies, interest rates, and geopolitical events to gauge the market’s future direction.
Be Flexible and Adaptable: Unlike traders who stick rigidly to one strategy, Druckenmiller adapts his positions based on shifting economic conditions. He stresses the need for flexibility, allowing him to adjust his approach as new information emerges.
Risk Management is Crucial: “The most important thing is to preserve capital,” says Druckenmiller. He always uses strict risk management to protect his portfolio, ensuring that losses are kept to a minimum while maximizing gains during favorable conditions.
Let Your Winners Run: Druckenmiller believes that while cutting losses quickly is important, letting profitable trades run is just as critical. When a trade is working in his favor, he doesn’t hesitate to hold onto it for extended periods.
Don’t Follow the Herd: He stresses that successful investing comes from independent analysis and conviction in your own strategy, rather than blindly following market trends or popular opinions.
Stanley Druckenmiller’s Iconic Trades
Shorting the British Pound (1992): Druckenmiller, alongside George Soros, made a massive profit by betting against the British pound when the UK government was forced to devalue its currency. This trade cemented his status as one of the most skilled macro traders of all time.
Navigating the 2008 Financial Crisis: Druckenmiller avoided much of the 2008 market collapse by moving out of risky assets and into safe havens like gold. His ability to predict economic shifts and manage risk during a volatile time made him a standout figure.
Tech Stocks in the 1999-2000 Dot-Com Bubble: Druckenmiller also saw the tech bubble coming and managed to avoid most of the damage. His foresight in avoiding overvalued stocks helped him avoid significant losses during the crash.
What This Means for Traders
Macro Focus: As a trader, you can apply Druckenmiller’s macro approach by paying attention to global economic trends and looking beyond individual stocks.
Adaptability is Key: Be ready to change your position when the market signals a shift. Don’t cling to outdated strategies.
Risk Management: Always prioritize protecting your capital while letting your successful trades ride the momentum.
Conclusion
Stanley Druckenmiller’s investment style teaches us the importance of understanding global trends, managing risk, and staying disciplined. By focusing on the big picture and making informed, well-timed decisions, traders can improve their chances of success in unpredictable markets. If you can combine Druckenmiller’s lessons with your own trading approach, you’ll be well on your way to becoming a successful macro trader.
What do you think of Stanley Druckenmiller’s approach to trading? Have you applied any of his strategies in your own trading journey?
Share your thoughts in the comments below!

3M India (3MINDIA) - Double Top Confirmed3M India (3MINDIA) weekly chart analysis reveals a confirmed double top pattern and a breakdown below the trendline and 200-week EMA. This suggests a potential move down to the key support zone around 16,000-18,000. I've highlighted the key levels to watch. A short trade opportunity may arise on a pullback. Let me know your thoughts in the comments!
Also long term investors, could deploy their capital in trenches till the support zone or wait for the reversal to invest at once.
Disclaimer: This analysis is for informational and educational purposes only. It is not financial advice. Trading involves risk, and you could lose money. Past performance is not indicative of future results. Always do your own research and consult with a qualified financial advisor before making any investment decisions.

Bearish Pressure vs Bullish Hope: What’s Next for NIFTY 50?The NIFTY 50 is showing signs of indecision as it trades near critical resistance and support levels. Will the index break out of its consolidation or head for a deeper correction?
Key Points:
1. Resistance Zones:
- 23,605.30
- 23,550.00
- 23,498.70
- 23,444.95
- 23,383.25
- 23,322.75
2. Support Levels:
- 23,259.75
- 23,206.45
- 23,180.00
- 23,138.60
- 23,100.00
- 23,071.85
- 23,006.70
3. Current Setup:
The index is trading within a descending trendline resistance, creating a lower high pattern. Support at 23,206.45 is critical, as a breakdown below this level may trigger further downside. A breakout above 23,322.75 could open the path for bullish momentum.
How to Trade This:
- Bullish Strategy:
Enter long above 23,322.75 with targets at 23,444.95 and 23,605.30. Use a stop-loss below 23,259.75.
- Bearish Strategy:
Enter short below 23,180.00 with targets at 23,138.60 and 23,071.85. Place a stop-loss above 23,259.75.
Bottom Line:
The market is at a pivotal point, and traders should watch for confirmation of a breakout or breakdown. A decisive move will determine the next direction for the NIFTY 50. Stay cautious and trade with well-defined levels.
NSE:NIFTY1!
Only for educational purposes.
This content is not a recommendation to buy and sell.
Not SEBI REGISTRAR.

NIFTY 50: Comprehensive Analysis, Key Drivers,and FutureOutlooK?Chart Analysis: NIFTY 50
Key Levels of Interest
Support Zone (Highlighted in Green):
Range: 23,200–23,500
The chart shows a strong demand zone where buyers have historically stepped in. This area has acted as a reliable support, preventing further downside in the past.
Resistance Levels:
Immediate Resistance: 24,200–24,400 (Purple line)
Price has been struggling to break above this level, indicating a significant selling pressure.
Major Resistance: 25,550
Represented as a key level for a potential bullish breakout.
Trendline Analysis
The blue descending trendline highlights the pattern of lower highs, confirming a downward trend.
Unless price breaks above the trendline, the overall sentiment remains bearish.
Moving Averages
50-Day SMA (Purple Line): The price is trading below this level, signaling short-term weakness.
200-Day SMA (Yellow Line): The long-term moving average suggests bearish momentum as prices are below this too.
Candlestick Patterns
Recent candles show long lower wicks, which suggest some buying interest near the support zone.
Lack of large green candles indicates weak follow-through on buying attempts.
Volume Analysis
The volume bars are tapering off, showing a lack of strong participation in the current consolidation phase.
An uptick in volume near either resistance or support could signal the next significant move.
Indicators on Chart
RSI (Relative Strength Index): Though not displayed directly on the chart, you can infer it from the general price action. The price is likely near an oversold level, hinting at a potential bounce.
SuperTrend Indicator:
Currently bearish, indicating selling pressure dominates.
Short-Term Bias
Neutral to Bearish: While the price is consolidating in a range, it leans toward bearish due to:
Rejection near resistance.
Trading below both moving averages.
A downward-sloping trendline.
Scenarios Based on the Chart
Bullish Scenario
Breakout Above 24,400:
This resistance must be broken with strong volumes to indicate bullish momentum.
The next target would be 25,550, followed by potential higher highs.
Watch for large green candles and high volumes to confirm strength.
Bearish Scenario
Breakdown Below 23,200:
A fall below the support zone could accelerate selling, bringing prices to 22,800 or even lower.
This would signal continuation of the prevailing bearish trend.
Neutral Range
As long as prices remain between 23,200 and 24,400, the NIFTY 50 is likely to consolidate without a clear direction.
Short-term traders can exploit this range for quick trades, while long-term players might wait for a decisive move.
Next Steps for Traders Based on Chart
Aggressive Traders:
Look for breakouts or breakdowns near the trendline and support/resistance zones.
Conservative Traders:
Wait for confirmation (volume and candlestick patterns) before taking positions.
Use of Stop Loss:
For bullish trades, stop loss should be placed below 23,200.
For bearish trades, stop loss should be above 24,400.
What is NIFTY 50?
The NIFTY 50 is India’s flagship stock market index, representing the top 50 companies listed on the National Stock Exchange (NSE). It serves as a benchmark for the performance of the Indian stock market. These 50 companies are selected based on market capitalization and liquidity, spanning 13 sectors, including financials, IT, energy, and FMCG.
Growth of NIFTY 50
Historical Growth:
The NIFTY 50 started in 1996 with a base value of 1,000.
Over the years, it has become a barometer of India's economic progress, reflecting the performance of top blue-chip companies.
Long-Term Drivers of Growth:
Economic Expansion: India’s GDP growth has been a key factor.
Reforms and Policies: Initiatives like GST, Make in India, and privatization of PSUs have boosted the market.
Foreign Investments: FII/FDI inflows, due to India being a high-growth emerging market, have supported the index’s growth.
Sectoral Growth: IT, banking, and consumer goods have consistently driven the index higher.
Key Milestones:
2008: Crash during the global financial crisis.
2014: Bull run after stable government formation.
2020-2021: Sharp recovery post-COVID-19, driven by tech and healthcare sectors.
Factors Affecting NIFTY 50
Economic Factors
GDP Growth: Positive GDP growth supports the index as companies earn more.
Inflation: High inflation can reduce consumer purchasing power and hurt corporate profits.
Interest Rates: Higher interest rates discourage borrowing and investing, pressuring the index.
Global Events
US Federal Reserve Policies: Fed rate hikes impact global liquidity and foreign investments in Indian markets.
Geopolitical Tensions: Events like the Russia-Ukraine conflict can increase uncertainty, leading to volatility.
Commodity Prices: Rising oil and commodity prices hurt India due to its reliance on imports, especially crude oil.
Domestic News
Earnings Reports: Quarterly performance of heavyweight companies impacts the index.
Budget Announcements: Policies favoring infrastructure, manufacturing, or tax cuts can uplift sentiment.
Rupee Movement: A weak rupee can impact sectors like IT positively but hurt import-heavy sectors.
Sectoral Performance
Banking and IT have the highest weightage, making them critical to the index’s movement.
A strong rally in FMCG or Energy sectors can also significantly push the index.
Comprehensive News Analysis
Bullish News
Lower Crude Oil Prices: Reduces import bills and benefits the economy.
Strong FII Inflows: Sign of growing foreign investor confidence.
Favorable Budget Policies: Tax cuts, incentives for sectors like manufacturing, EVs, and infrastructure can push the index higher.
Bearish News
Recession Fears: Global recession concerns can lead to foreign outflows.
High Inflation: Persistently high inflation can weigh on corporate profits and valuations.
Rate Hikes: Further rate hikes by the RBI or US Fed may trigger selling pressure.
Future Outlook: Scenarios
Bullish Case
Support Zone Holds: If the price stays above 23,200 and breaks above the resistance at 24,400, it would signal bullish momentum.
Catalysts:
Stabilizing global macroeconomics.
Strong earnings by large-cap companies.
Infrastructure and manufacturing-led growth supported by government spending.
Targets:
Immediate Target: 25,550.
Long-Term Target: 27,000 (new highs, provided favorable conditions persist).
Bearish Case
Support Breaks at 23,200: A breakdown would open the door to further selling, with targets around 22,800 or lower.
Catalysts:
Weak global cues, like rising bond yields or geopolitical tensions.
Negative earnings surprises or downgrades of key constituents.
Targets:
Immediate Target: 22,500.
Long-Term Target: Below 22,000 (in case of broader market corrections).
Key Takeaways for Traders
Monitor Key Levels:
Support: 23,200.
Resistance: 24,400.
Follow the Trendline: Watch for breaks or bounces off the descending trendline for clarity.
Watch Sectoral Trends: Banking and IT are crucial due to their high weightage.
News Catalysts: Follow FII data, crude oil prices, and quarterly earnings for short-term moves.
Actionable Trading Strategies
Bullish Strategy
Buy Entry: Above 24,400 with strong volumes.
Target: 25,550 and higher.
Stop Loss: Below 24,000 to minimize risk.
Bearish Strategy
Sell Entry: Below 23,200 with volume confirmation.
Target: 22,500 or lower.
Stop Loss: Above 23,600 to protect against reversals.
Comprehensive Analysis of NIFTY 50
What is NIFTY 50?
The NIFTY 50 is India’s flagship stock market index, representing the top 50 companies listed on the National Stock Exchange (NSE). It serves as a benchmark for the performance of the Indian stock market. These 50 companies are selected based on market capitalization and liquidity, spanning 13 sectors, including financials, IT, energy, and FMCG.
Growth of NIFTY 50
Historical Growth:
The NIFTY 50 started in 1996 with a base value of 1,000.
Over the years, it has become a barometer of India's economic progress, reflecting the performance of top blue-chip companies.
Long-Term Drivers of Growth:
Economic Expansion: India’s GDP growth has been a key factor.
Reforms and Policies: Initiatives like GST, Make in India, and privatization of PSUs have boosted the market.
Foreign Investments: FII/FDI inflows, due to India being a high-growth emerging market, have supported the index’s growth.
Sectoral Growth: IT, banking, and consumer goods have consistently driven the index higher.
Key Milestones:
2008: Crash during the global financial crisis.
2014: Bull run after stable government formation.
2020-2021: Sharp recovery post-COVID-19, driven by tech and healthcare sectors.
Factors Affecting NIFTY 50
Economic Factors
GDP Growth: Positive GDP growth supports the index as companies earn more.
Inflation: High inflation can reduce consumer purchasing power and hurt corporate profits.
Interest Rates: Higher interest rates discourage borrowing and investing, pressuring the index.
Global Events
US Federal Reserve Policies: Fed rate hikes impact global liquidity and foreign investments in Indian markets.
Geopolitical Tensions: Events like the Russia-Ukraine conflict can increase uncertainty, leading to volatility.
Commodity Prices: Rising oil and commodity prices hurt India due to its reliance on imports, especially crude oil.
Domestic News
Earnings Reports: Quarterly performance of heavyweight companies impacts the index.
Budget Announcements: Policies favoring infrastructure, manufacturing, or tax cuts can uplift sentiment.
Rupee Movement: A weak rupee can impact sectors like IT positively but hurt import-heavy sectors.
Sectoral Performance
Banking and IT have the highest weightage, making them critical to the index’s movement.
A strong rally in FMCG or Energy sectors can also significantly push the index.
Technical Chart Analysis
The NIFTY 50 is currently in a descending triangle pattern, with key support levels and resistance zones as follows:
Support Levels:
Immediate support: 23,200 (green demand zone).
A break below this level could lead to further downside to 22,500 or lower.
Resistance Levels:
Immediate resistance: 24,400 (upper trendline of descending triangle).
A breakout above this could signal a bullish trend reversal.
Trendlines and Moving Averages:
The 200-day moving average (yellow line) provides long-term support around 23,700.
The 50-day moving average (purple line) acts as a short-term resistance.
Volume Analysis:
Higher volumes near support zones indicate potential accumulation.
Declining volumes near resistance suggest indecision.
Comprehensive News Analysis
Bullish News
Lower Crude Oil Prices: Reduces import bills and benefits the economy.
Strong FII Inflows: Sign of growing foreign investor confidence.
Favorable Budget Policies: Tax cuts, incentives for sectors like manufacturing, EVs, and infrastructure can push the index higher.
Bearish News
Recession Fears: Global recession concerns can lead to foreign outflows.
High Inflation: Persistently high inflation can weigh on corporate profits and valuations.
Rate Hikes: Further rate hikes by the RBI or US Fed may trigger selling pressure.
Future Outlook: Scenarios
Bullish Case
Support Zone Holds: If the price stays above 23,200 and breaks above the resistance at 24,400, it would signal bullish momentum.
Catalysts:
Stabilizing global macroeconomics.
Strong earnings by large-cap companies.
Infrastructure and manufacturing-led growth supported by government spending.
Targets:
Immediate Target: 25,550.
Long-Term Target: 27,000 (new highs, provided favorable conditions persist).
Bearish Case
Support Breaks at 23,200: A breakdown would open the door to further selling, with targets around 22,800 or lower.
Catalysts:
Weak global cues, like rising bond yields or geopolitical tensions.
Negative earnings surprises or downgrades of key constituents.
Targets:
Immediate Target: 22,500.
Long-Term Target: Below 22,000 (in case of broader market corrections).
Actionable Trading Strategies
Bullish Strategy
Buy Entry: Above 24,400 with strong volumes.
Target: 25,550 and higher.
Stop Loss: Below 24,000 to minimize risk.
Bearish Strategy
Sell Entry: Below 23,200 with volume confirmation.
Target: 22,500 or lower.
Stop Loss: Above 23,600 to protect against reversals.
Disclaimer
This analysis is for educational and informational purposes only and should not be considered as financial or investment advice. Trading and investing in the stock market carry risks, and past performance is not indicative of future results. Always conduct your own research or consult with a certified financial advisor before making any investment decisions.

lecture for option traderOption trading gives the buyer the right but not the obligation to buy (call option) or sell (put option) a certain underlying asset at a predetermined price within a stipulated period. Options trading involves strategies that provide traders with various market positions to make gains or mitigate the spot market risk.
You don't need a considerable sum of money to become an options trader. You can start small with a capital of less than Rs 2 lakhs too. However, as you start small, you need to be a careful trader so that you can cut down on the possibility of losses and enhance the return potential of your trades.
