gail stock : gail
trade : long (cash segment)
buy @ 193 above
sl @ 182
target 1 @ 205
target 2 @ 225
note :
this information is only for education
Stockmarketanalysis

hindcopperstock : hindcopper
trade : long (cash segment)
buy @ 326 above
sl @ 307.5
target 1 @ 365
target 2 @ 400
note :
this information is for education only

capacite stock : capacite
trade : long (cash segmenet)
buy @ 294
sl @ 287
target 1 @ 310
target 2 @ 320
note :
this information is for education only

mmp industries ltdstock : mmp industries ltd
trade : long (cash segment)
buy @ 307 above
sl @ 293
target 1 @ 325
target 2 @ 355
note :
this information is only for education

ESCORTS: Channel BreakoutPrices have given a breakout of the channel. This suggests that prices are likely to recover towards INR 3290-3300 in the coming weeks. Any weakness is likely to hold above the support of 2800.

LICI: Channel BreakoutStock is rising in an impulsive manner after giving a breakout of the corrective channel. Stock is likely to extend its gains towards 1080-1100 zone with any weakness holding above the support zone of 940.

sunpharmastock : sunpharma
trade : long (cash segment)
buy @ 1635
sl @ 1613
target @ 1705
note :
this information for education only

rainbow stock : rainbow
trade : long (cash segment)
buy @ 1327 above
sl @ 1248
target @ 1490
note :
this information is only for education

REVERSAL IN AVENUE SUPERMARTSAvenue Supermarts is BULLISH on Monthly timeframe and has changed its price structure on Weekly timeframe which gives a strong conviction that it is going to test its ATH once again. There is a scope of accumulation if it is available at a discounted price between 4200 and 4300 . The idea will be invalid below 4000 . The targets are crystal clear according to price action. Hourly timeframe should be followed for a good entry with a minimum risk for a greater reward.

L&T: Cup & Handle FormationLT: CUP and Handle Formation: Prices are likely to resume it's uptrend towards 4100-4150 zone in the coming weeks, with any weakness holding above 3500 zone.
The Cup with Handle is a bullish continuation pattern that marks a consolidation period followed by a breakout. It was developed by William O'Neil and introduced in his 1988 book, How to Make Money in Stocks.
As its name implies, there are two parts to the pattern: the cup and the handle. The cup forms after an advance and looks like a bowl or rounding bottom. As the cup is completed, a trading range develops on the right-hand side and the handle is formed. A subsequent breakout from the handle's trading range signals a continuation of the prior advance.
Trend: To qualify as a continuation pattern, a prior trend should exist. Ideally, the trend should be a few months old and not too mature. The more mature the trend, the less chance that the pattern marks a continuation or the less upside potential.
Cup: The cup should be “U” shaped and resemble a bowl or rounding bottom. A “V” shaped bottom would be considered too sharp of a reversal to qualify. The softer “U” shape ensures that the cup is a consolidation pattern with valid support at the bottom of the “U”. The perfect pattern would have equal highs on both sides of the cup, but this is not always the case.
Cup Depth: Ideally, the depth of the cup should retrace 1/3 or less of the previous advance. However, with volatile markets and over-reactions, the retracement could range from 1/3 to 1/2. In extreme situations, the maximum retracement could be 2/3, which conforms with Dow Theory.
Handle: After the high forms on the right side of the cup, there is a pullback that forms the handle. Sometimes this handle resembles a flag or pennant that slopes downward, other times it is just a short pullback. The handle represents the final consolidation/pullback before the big breakout and can retrace up to 1/3 of the cup's advance, but usually not more. The smaller the retracement, the more bullish the formation and significant the breakout. Sometimes it is prudent to wait for a break above the resistance line established by the highs of the cup.
Volume: There should be a substantial increase in volume on the breakout above the handle's resistance.
Target: The projected advance after breakout can be estimated by measuring the distance from the right peak of the cup to the bottom of the cup.

LONG TERM VIEW FOR ALKYL AMINESOn monthly basis, price has made a significant correction and is currently at the Fibonacci level of 0.618, which is the "Golden Ratio" for a price. The whole area from 2000 to 2150 is a huge demand zone for the buyers to accumulate in bits. The price will confirm it's change of structure above 2800 on a higher timeframe.

BANKNIFTY INTRADAY LEVELS FOR 19.03.2024BankNifty is trading within a range (46600 in the upper side and 46300 in the downside), so there is no scope for option buyers within this range (option sellers can deploy non-directional strategies as long as market stays within this range); they should wait for range shift for a directional trade. Traders should be conservative in their position sizes if there is a breakout in the upper side, and can be a little bit aggressive in a trade in the lower side. Option buyers should scalp within the range if there is a bearish reversal (double top) at the resistance level in 5 mins timeframe; target would be the day's low.

JIO FINANCIAL: HOLDING THE SUPPORTSock has bounced back from the support zone and currently hovering near it's previous swing high on daily charts. As per the current formation stock is likely to move up towards it's resistance zone with any weakness holding above 200-195 zone.

LONG TERM VIEW FOR "DELHIVERY"The current monthly chart is showing a perfect price-action for value-investing. The main advantage why we should consider reversal trading as our best-shot strategy is a good risk-to-reward ratio. The XABCD patterns for the current impulse wave helps us to find out the potential long term targets for the scrip.

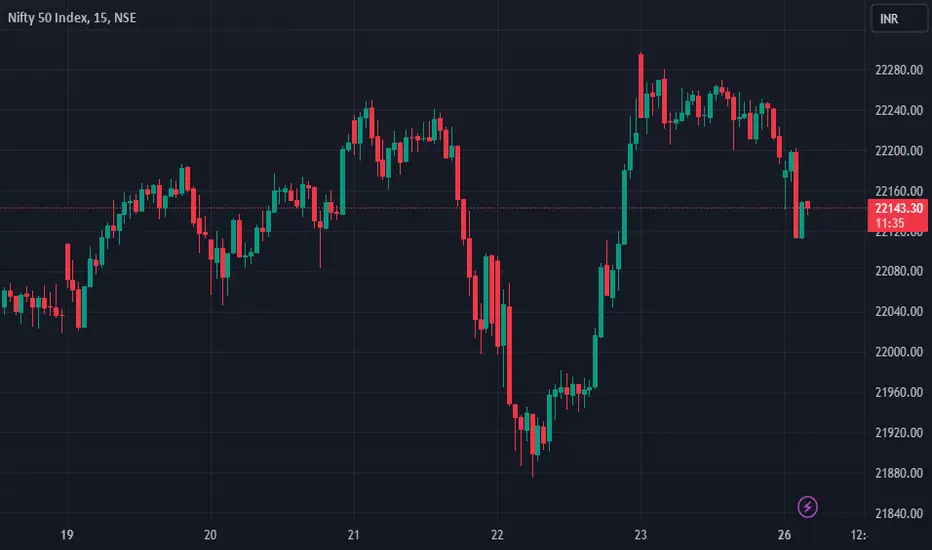
Pre-market Analysis Nifty Bank Nifty 26 February 2024Market Recap
Nifty declined 0.02% to close at 22212.70
Bank Nifty declined 0.23% to close at 46811.75
India VIX declined 1.48% to close at 14.97
banknifty reversal finda small reversal on banknifty chart on friday or monday .. BN can move in down side as yesterday low or more..

Maruti coming in the zone for a high probable shortMaruti coming in the zone for a high probable short.
Short at 7825
SL: 7980
Target : 2R

swing trade for 1 monthTechnical Analysis for Federal Bank:
Stock Name: Federal Bank
Chart Pattern: Breakout of channel
Trade Duration: Swing trade for 1 month
Entry: Buy on current market price (CMP) at ₹164.7
Stop Loss: ₹10
Target: ₹20
Volume: Huge volumes and good closing on Friday

Shaily Engineering Plastics Ltd| Momentum StockShaily Engineering Plastics Ltd| Momentum Stock
The Company is engaged in the manufacture and sale of injection moulded precision plastic components, sub-assemblies for various requirements of Original Equipment Manufacturers (OEM).
Financial= medium
Market Cap = ₹ 1,907 Cr. ROCE = 10.5 % ROE = 7.87 %
Debt to equity = 0.51 Profit Var 3Yrs = 8.31 % Sales growth 3Years = 21.3 %
Return on assets = 4.41 %
This stock is now in momentum as well as chart is looking very good.
but fundamental is little bit medium. but product range is future oriented.
this ia debt free company.
Note: I am not SEBI registered financial Adviser. I solely present my views on chart .I do not charge any kind of service. This is not buy sell recommendation.
If you like my ideas than like boost and follow me for more ideas.
Thanks and comment freely

Pre-market Analysis Nifty Bank Nifty 14 February 2024Market Recap
Nifty advanced 0.59% to close at 21,743.25
Bank Nifty advanced 1.38% to close at 45,502.40
India VIX declined 1.59% to close at 15.81

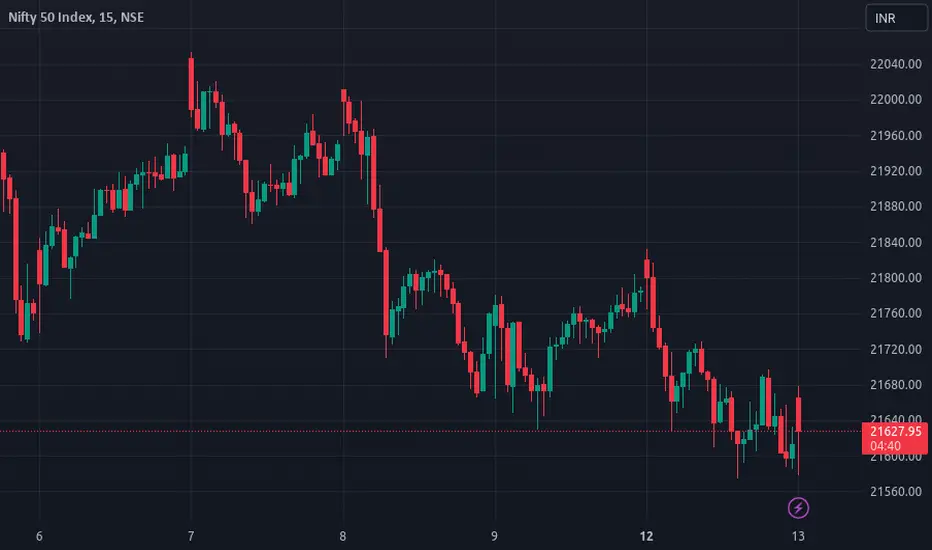
Pre-market Analysis Nifty Bank Nifty 13 February 2024Market Recap
Nifty declined 0.76% to close at 21616.05
Bank Nifty declined 1.65% to close at 44882.25
India VIX advanced 3.98% to close at 16.06
PETRONET LNG (Monthly breakout)PETRONET LNG looks promising as it near it's multi-year breakout. Closing above 240 can fire
NOTE: I'm not a SEBI REG. Study before investing.

Pre-market Analysis Nifty Bank Nifty 08 February 2024Market Recap
Nifty advanced 0.01% to close at 21,930.50
Bank Nifty advanced 0.28% to close at 45,818.50
India VIX declined 1.77% to close at 15.51
