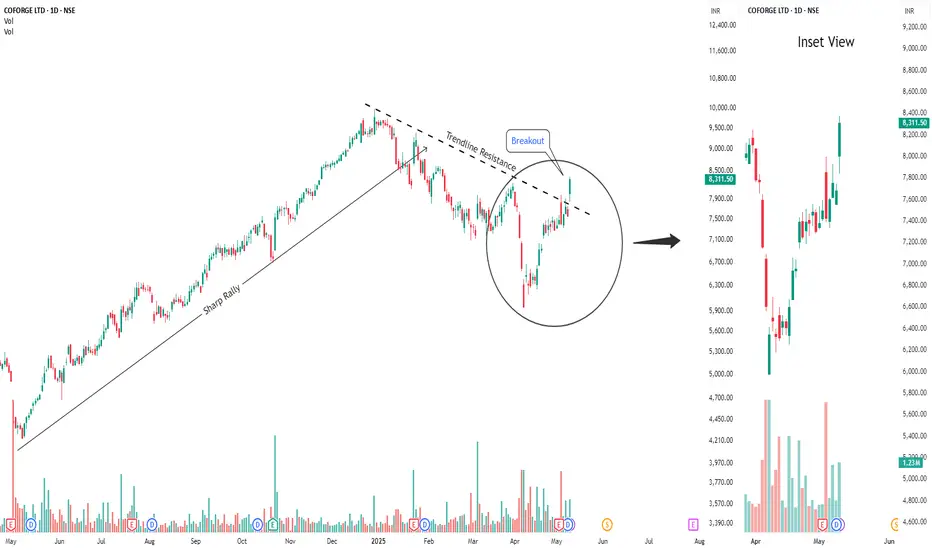
Buy Coforge Short Term Trading Advice by Goodluck Capital
Buy Coforge
Buy Range- 8000 - 8200
Target- 8750 - 8850
StopLoss- below 7700
Upside Potential- 8% -9%
Approx trade duration 14 - 15 days
Stocksanalysis
Heads Up! ITC Looks Ready to FlyAfter a steady decline from its highs, ITC has made a strong comeback, bouncing perfectly off its trendline support. And now—it’s broken past its trendline resistance!
📈 This breakout could be the start of a new bullish wave, with momentum likely to carry the stock higher in the sessions ahead.
💰 Dividend Alert: ITC has announced a final dividend of ₹7.85 per share, with the ex-date on 28th May. This is the highest dividend declared by ITC in the last 5 years. That could bring some serious action in the next couple of trading days.
🎯 All eyes on ITC—this might just be the breakout we’ve been waiting for!

Buy Premier Explosives Short Term Trading Advice by Goodluck Capital
Buy Premier Explosives
Buy Range- 444 - 466
Target- 520 - 540
StopLoss- below 400
Upside Potential- 15% -20%
Approx trade duration 20 - 25 days

Buy Data Patterns India Limited Short Term Trading Advice by Goodluck Capital
Buy Data Patterns India Limited
Buy Range- 2075 - 2222
Target- 2475 - 2550
StopLoss- below 1944
Upside Potential- 15% -20%
Approx trade duration 20 - 25 days

Breakout Alert: Tata Steel and Mazagon Dock Power Up for a Surge◉ Tata Steel NSE:TATASTEEL
● The stock price has recently broken out of a falling broadening wedge pattern, signaling a potential upward movement.
● With the government's plans to impose taxes on steel imports, the stock could experience a rally in the near future.
◉ Mazagon Dock NSE:MAZDOCK
● The price has formed a bullish Pole & Flag pattern on the chart.
● Following a fresh breakout, the stock is expected to continue its upward trajectory.

Momentum Stocks to Watch: INDIGO & NH Gear Up for Rally◉ Interglobe Aviation NSE:INDIGO
● The stock has formed a Symmetrical Triangle pattern on the daily chart.
● Following a recent breakout, the price is anticipated to witness substantial upward movement in the coming days.
◉ Narayana Hrudalaya NSE:NH
● After a prolonged consolidation phase, the stock has developed a Rounding Bottom pattern.
● With the price breaking out of this pattern, it is now trending upward, signalling potential for further gains in the near term.

Auto Index Nears Breakdown: Hero Motocorp a Top Short Pick◉ Auto Sector Overview NSE:CNXAUTO
● The auto sector has recently experienced significant selling pressure, driving the index to hover just above its key support level at 22,000.
● However, there are concerns that this support level may not hold for long, potentially leading to a breakdown and continuation of the downtrend.
In light of this scenario, short positions in select stocks within the sector could present a viable trading opportunity.
◉ Hero Motocorp Technical Analysis NSE:HEROMOTOCO
● On the weekly chart, Hero Motocorp has formed a Head & Shoulders pattern, a classic bearish reversal signal.
● The price has recently breached the neckline of this pattern, indicating a potential for further downside movement. This breach reinforces the bearish outlook for the stock.
◉ OI Data Analysis
● Open interest data shows a buildup of new short positions during recent trading sessions, further supporting the bearish sentiment.
● Additionally, the option chain data highlights a significant concentration of put writers at the 3900 level.
● With this level now breached, the stock is expected to maintain its negative momentum, potentially leading to further declines.

FMCG Sector in Bearish Grip: Short Sellers Eyes on Colpal◉ FMCG Sector Overview NSE:CNXFMCG
● The Nifty FMCG index appears to be in a bearish phase, having formed a bearish engulfing pattern near a key support level.
● This suggests a potential breach of the support level in the near term.
Given this scenario, there may be an opportunity to consider short positions in select stocks within the sector.
◉ Colgate Palmolive Technical Analysis NSE:COLPAL
● On the weekly chart, Colgate Palmolive has developed a Head and Shoulders pattern, a classic bearish reversal formation.
● The stock is currently hovering near the neckline, and a breach of this level appears imminent, which could signal further downside.
◉ OI Data Analysis
● Open interest analysis reveals, significant long unwinding during the recent trading session, reflecting a shift in investor sentiment toward the negative side. This further supports the bearish outlook for the stock.
● The option chain data indicates that the 2,600 level could act as an immediate support, as it has the highest concentration of put writers. However, if this level is breached, the stock could see additional downward momentum.

CreditAccess Grameen: A Turnaround in Sight Short Term Trading Advice by Goodluck Capital
Buy CreditAccess Grameen
Buy Range- 990 - 1030
Target- 1200 - 1250
StopLoss- below 845
Upside Potential- 20% -25%
Approx trade duration 20 - 25 days
◉ Technical Analysis
● After a substantial decline, the stock is now showing signs of recovery, bouncing back from its trendline support.
● Additionally, the increasing trading volume is reinforcing the likelihood of a turnaround, indicating a potential reversal in the stock's fortunes.
◉ Fundamental Rationale
The Reserve Bank of India's (RBI) recent liquidity infusion of over ₹1.5 lakh crore is expected to boost economic growth and create a favorable environment for microfinance institutions (MFIs) like CreditAccess Grameen. Here are the key benefits:
● Improved Liquidity for Lending: The injection will help MFIs meet their short-term funding requirements, reducing their reliance on expensive sources of funding.
● Potential Interest Rate Cuts: Lower interest rates will enable CreditAccess Grameen to access cheaper capital, making loans more affordable for low-income customers.
● Boost to Rural Economy: Budget 2025's focus on rural development through increased government spending will enhance the repayment capacity of borrowers, reducing credit risks for MFIs. This will create a favorable environment for CreditAccess Grameen to operate and expand their services.

Stocks in Focus: Biocon, Bharat Dynamics & Apollo Micro Systems1. Biocon NSE:BIOCON
● The stock reached a peak of ₹483 in December 2020, then experienced a downturn, entered a prolonged consolidation phase.
● This phase led to the formation of an Inverted Head & Shoulder pattern.
● Following a recent breakout, the stock is now poised for upward movement.
2. Bharat Dynamics NSE:BDL
● After hitting an all-time high around ₹1,795, the stock saw a decline of nearly 50% and eventually found support at ₹890.
● From this point, the price rebounded and recently surpassed its trendline resistance, setting the stage for substantial future gains.
3. Apollo Micro Systems NSE:APOLLO
● The stock underwent significant consolidation after marking an all-time high near ₹161.
● With a fresh breakout, the price is now set to exceed its past high and make new highs.

Margin Concerns Weigh on HDFC Bank Shares, Down 2.2%◉ HDFC Bank's Quarterly Update
HDFC Bank, the largest constituent of the Nifty 50 index, has released its quarterly performance update, highlighting a notable divergence in deposit and loan growth. Specifically, the bank reported a 15.8% year-on-year increase in deposits, significantly outpacing the 3% year-on-year growth in loans.
◉ A Cloud of Uncertainty
Experts believe this gap could negatively impact the bank's net interest margin, possibly reducing its net profit.
◉ Investors Take a Step Back
This news caused a stir in the market, leading to a 2.2% drop in the share price yesterday (Jan 06).
◉ Technical Observations
● The stock price has fallen below its trendline support and is currently trending downward.
● A minor support is anticipated around ₹1,700.
● If the stock price drops below this level, the next support is projected to be close to ₹1,600.

Uptrend Uproar: 3 Stocks with Strong Technical Momentum◉ Jubilant Foodworks NSE:JUBLFOOD
● The stock price has consolidated and formed a Cup & Handle pattern.
● Following a recent breakout, the price is now set for an upward movement.
◉ Kalyan Jewellers NSE:KALYANKJIL
● Amid a strong upward trend, the stock price took a breather and formed an Inverted Head & Shoulder pattern.
● A breakout is anticipated soon, which could propel the stock to new heights.
◉ United Spirits NSE:UNITDSPR
● The stock is on a robust uptrend and has developed a Rounding Bottom pattern, indicating a probable continuation of this trend.
● After a recent breakout, the price is positioned to rise further.

Pharma Sector Shines Amidst Market WeaknessOn December 19, 2024, the pharmaceutical sector in India experienced a notable uptrend, with the Nifty Pharma index rising over 1.8%, making it the only sector to gain in an otherwise weak market.
The significant surge in delivery volume indicates a substantial influx of foreign capital into the sector.
◉ Several factors contributed to this positive movement:
1. Defensive Nature of the Sector: Amidst economic uncertainties, investors often turn to defensive sectors like pharma, which offer relatively lower risk compared to cyclical sectors.
2. Positive Market Sentiment: The overall sentiment for the pharma sector was buoyed by expectations of strong growth in the Indian pharmaceutical market, projected to reach $130 billion by 2030 and $450 billion by 2047.
3. Resilient to US Tariffs: India is a major supplier of generic drugs to the US, which could help shield this sector from tariffs due to its critical role in healthcare and the ongoing demand for affordable medications.
◉ Specific Stock Performances:
1. Ipca Laboratories NSE:IPCALAB : Up 5.4%
➖ The stock has formed a Bullish Pole & Flag pattern, and following a breakout, it is set to continue its upward movement.
2. Dr. Reddy's Laboratories NSE:DRREDDY : Up 4.3%
➖ The price has broken out of a falling trendline, signalling strong bullish momentum.
➖ This breakout, supported by a significant rise in trading volume, indicates growing investor interest.
3. Abbott India NSE:ABBOTINDIA : Up 3.4%
➖ The stock is currently in a consolidation phase within a parallel channel.
➖ After rebounding from the lower boundary, the price is now on an upward trend.
◉ Conclusion
The Pharma sector's strong performance is driven by key players' impressive gains, contrasting with the broader market's decline. This divergence makes the sector an attractive investment opportunity. With a promising outlook and strong fundamentals, the Pharma sector is well-positioned for continued growth.

Bullish Breakthroughs: 3 Stocks Marching Towards Big Gains1. Pricol NSE:PRICOLLTD
● Pricol's stock price has formed a Rounding Bottom Pattern, signalling a potential trend continuation.
● Following a successful breakout, the stock has resumed its upward trajectory, suggesting further gains.
2. Prestige Estate NSE:PRESTIGE
● A bullish Pole & Flag Pattern has emerged on Prestige Estate's chart.
● The recent breakout is likely to propel the price to higher levels, presenting a buying opportunity.
3. Borosil Renewables NSE:BORORENEW
● Borosil Renewables' stock price has formed a Falling Wedge (Continuation) Pattern after undergoing a prolonged consolidation phase.
● The recent breakout suggests a significant upward move, positioning the stock for substantial gains.

Breakout Blitz: 3 Stocks to Supercharge Your Portfolio◉ Affle (India) NSE:AFFLE
● In the midst of an upward trend, the stock previously formed a Rounding Bottom pattern, and after a breakout, the price experienced a significant surge.
● However, around the 1,715 level, the stock encountered substantial resistance, leading to a decline followed by a period of consolidation.
● Recently, another Rounding Bottom pattern has been developed, and with a recent breakthrough, the stock is now trading at an all-time high, with expectations for continued growth.
◉ KFin Technologies NSE:KFINTECH
● The stock price is evidently trending upward, characterized by a succession of higher highs and higher lows.
● After effectively breaking out of the Rounding Bottom pattern, the stock saw a significant increase, approaching its previous all-time high around the 1,190 level.
● However, it encountered substantial resistance at that point, leading to a pullback and a subsequent consolidation phase.
● Now, following a recent breakout, the stock has positioned itself above the breakout zone and is ready for a potential upward rally.
◉ EID Parry NSE:EIDPARRY
● After a period of consolidation, the stock price has developed an Inverted Head & Shoulders pattern.
● Following the breakout, the price initially climbed sharply but soon entered a significant consolidation phase, resulting in the formation of a Broadening pattern.
● Currently, the stock has achieved a breakthrough and is set to enjoy additional gains.

Thangamayil shining: The strong financials caused a price surge!Company Overview
Thangamayil Jewellery Limited (TMJL) is a rapidly growing company in India with a chain of retail jewellery stores in Tamil Nadu. They specialize in selling Gold, Silver, Diamonds, and Platinum, with gold being the main source of income. The majority of their ornaments are purchased from dealers in states like Andhra Pradesh, Gujarat, Kerala, and West Bengal for sale in their stores. Established in 1947, Thangamayil is headquartered in Madurai, India.
Market Capitalization
● Current Market Cap - ₹ 5,128 Cr.
● Market Cap 3-years back - ₹ 802 Cr.
● The figures indicate that the company has increased over six times in the past three years, which is truly remarkable.
Revenue & Profit Growth
● In the last three years, this stock has demonstrated an impressive compounded annual growth rate of 28% in its sales figures.
● Meanwhile, the total profit growth during this period has been a modest 12%.
● The company has successfully maintained a operating profit margin of 6%, which has risen from 4% in FY24.
● For the fiscal year 2024, the earnings per share have seen a remarkable increase, soaring from 29.10 in fiscal year 2023 to 44.91.
Increasing Product Demand
● Inventory Turnover Ratio
➖ This ratio typically assists in determining whether the growth in sales is primarily due to rising product prices or if it is also influenced by increased demand for the product.
➖ Current Inventory Turnover - 3.14
➖ Inventory Turnover 3 years ago - 2.63
➖ These figures indicate that product demand has risen over the past three years.
Valuation
● P/E Ratio
The company's present price-to-earnings (PE) ratio stands at 42.3, significantly higher than its 1-year median PE of 31. When we look at the industry average PE of 31.6, it indicates that the stock might be considered somewhat overvalued at this time.
● PEG Ratio
The company has a PEG ratio of 1.3, indicating that its current P/E ratio is valid.
● Intrinsic Value
➖ Thangamayil Jewellery is currently trading at ₹1870, which is nearly 2.5 times its intrinsic value of ₹764, indicating that the stock is overvalued at this moment.
➖ When we compare Thangamayil to its competitors, such as Titan and Kalyan Jewellers, some interesting insights emerge. Titan's current market price (CMP) stands at ₹3560, which is nearly 5.5 times its intrinsic value of ₹652. Meanwhile, Kalyan Jewellers has a CMP of ₹545, approximately 4.7 times its intrinsic value of ₹115.
➖ These numbers don't necessarily indicate that Titan and Kalyan Jewellers are overvalued; rather, they suggest that Thangamayil could be an attractive investment choice.
Debt Analysis
● Debt to Equity Ratio
➖ The company carries a debt of approximately ₹532 Cr., resulting in a debt-to-equity ratio of 1.08.
➖ When discussing debt, it's important to note that for a small-cap company, this isn't necessarily a major concern. The key factor to consider is whether the company can consistently meet its loan interest payments.
➖ To assess this, we should examine the interest coverage ratio.
● Interest Coverage Ratio
With an interest coverage ratio of 5.62, it’s evident that the company is well-equipped to manage its loan interest payments regularly.
Cash Flow Analysis
● Operating cash flow has seen a remarkable surge, soaring to 330 crore from just 10 crore in FY23.
● The CFO/PAT ratio is currently at 0.74 of the five-year average, indicating that the company is quite proficient at converting its profits into cash.
Shareholding Pattern
● The promoters have maintained their 67.33% stake for the last three quarters.
● Foreign Institutional Investors (FIIs) have been steadily raising their stakes since June 2023, now holding 1.08%.
● Domestic Institutional Investors (DIIs) have also grown their stakes to 12.08% in June 2024, up from 11.46% in June 2023.
● At the same time, retail investors have been consistently selling their shares over the past few quarters.
Mutual Fund Holding
● Notable small-cap funds such as SBI Small Cap Fund and DSP Small Cap Fund have made substantial investments in this stock, representing 0.63% and 1.55% of their total assets under management, respectively.
● Additionally, ICICI Prudential Exports and Services Fund has recently added (in July 2024) its position in this stock, accounting for approximately 1.11% of its overall portfolio value.
Technical Aspects
● From a technical standpoint, this stock appear to be currently overextended. Any pullbacks could provide a valuable opportunity to take positions.
● Stock Volume & Delivery surged by 3.4 times & 3.2 times respectively vis-a-vis their 5 day average with a 5.48% move in price.
Conclusion
While the company primarily functions in Tamil Nadu, it's fascinating to note that this state accounts for the largest portion (40%) of India's overall gold consumption. Furthermore, the company is gearing up to make its mark in the Chennai market by launching a flagship store along with 3-4 satellite locations.
Given the increasing demand for gold jewelry, we anticipate that Thangamayil Jewellery will thrive in the industry in the years ahead.

Crisil: The Credit Rating Agency is Set for Significant Growth!
The price is currently on an upward trajectory, characterized by a series of higher highs and higher lows.
After hitting resistance around the 3,740 level, the stock price pulled back but found strong support near the 2,700 level.
It then bounced back and surpassed its previous resistance.
This breakout was significant, as it emerged from the Rounding Bottom pattern that had formed during the consolidation phase.
Following the breakout, the stock price stabilized just above the breakout zone for a while.
Then, with a dramatic surge, the stock reached an all-time high of ₹6200.
However, a wave of selling pressure caused the price to drop back to its trendline support.
At present, the stock price is steadily climbing, indicating promising growth potential.

SHARDACROP & DBCORP: Two Bright Spots in a Challenging MarketSharda Cropchem
● The stock price is evidently experiencing a robust upward trend.
● After a brief consolidation phase, it developed a Rounding Bottom pattern, and following a breakout, it has surged to an all-time high.
● The increasing buying volume suggests that the stock could continue to rise significantly.
D.B. Corp
● The stock price is currently moving within an Ascending Parallel channel.
● After reaching an all-time high around the 404 mark, the stock experienced a pullback to its trendline support level.
● Having rebounded from this support, the stock price is now poised for upward movement.

INDHOTEL & PAGEIND Shock Dalal Street with Q2 Gains, Stocks SoarThe Indian Hotels
◉ Key Financial Metrics
● Net Profit: IHCL's consolidated net profit soared by 232% year-on-year to ₹554.6 crore, up from ₹167 crore in the same quarter last year.
● Revenue: The company achieved a revenue increase of 27.4%, reaching ₹1,826 crore, compared to ₹1,433 crore a year ago.
● EBITDA: Earnings before interest, taxes, depreciation, and amortization (EBITDA) rose by 40% to ₹565 crore, with an EBITDA margin of 29.9%.
◉ Operational Highlights
● IHCL's hotel segment revenue grew by 16%, supported by a strong occupancy rate of 75% in its international portfolio.
● The company signed 42 new hotels, expanding its portfolio to 350 properties globally.
◉ Technical Standings
● The stock has broken through its previous resistance and is nearing the upper boundary of its ascending channel.
● A breakout above this level could fuel further gains.
Page Industries
◉ Key Financial Metrics
● Net Profit: Increased by 30% to ₹195.25 crore, up from ₹150.27 crore in the same quarter last year.
● Revenue: Rose by 11.06% to ₹1,246.27 crore, compared to ₹1,122.11 crore a year ago, supported by a 6.7% increase in sales volume (55.2 million pieces sold).
● EBITDA: Grew by 22.1% to ₹281.5 crore, reflecting improved operational efficiency and stable input costs.
◉ Strategic Outlook
● The company is focused on digital transformation and e-commerce initiatives, maintaining its margin guidance for FY25 at 19-21%, which underscores its commitment to sustained profitability.
◉ Technical Standings
● The stock's uptrend remains intact, with higher highs and lows.
● Recent breakout, accompanied by strong volume, suggests the rally will continue.

Ujjivan Small Finance Bank Builds Momentum for Rebound◉ Since its launch, the stock has faced a dramatic decline, dropped nearly 80% from its peak.
◉ Once it found support around the 12.5 mark, the stock began to rise again, formed an Inverted Head & Shoulders pattern in the process.
◉ After breaking out, the price surged to an all-time high near the 61 level, only to experience another notable drop.
◉ At present, the stock is trading at the previous breakout point and is expected to rebound shortly.

The Outperformer's Guide: Top Stocks from Each SectorThis analysis highlights key sectors and stocks to watch.
1. Nifty IT NSE:CNXIT
● The Nifty IT sector has demonstrated resilience during the recent negative market sentiments.
● Notably, it has formed a Descending Broadening Wedge pattern and expected to breakout soon.
➖ Stock to Watch - Coforge NSE:COFORGE
● The stock is currently trading just below its all-time high with a strong uptrend.
● Investors can consider accumulating shares on any dips.
2. Nifty Finance NSE:CNXFINANCE
● The Nifty Finance sector has recently breached its trendline support and is now approaching its next key support level, ranging from 22,500 to 22,700.
➖ Stock to Watch - Axis Bank NSE:AXISBANK
● The stock is currently trading at its support level, offering a potential short to mid-term trading opportunity.
3. Nifty PSU Bank NSE:CNXPSUBANK
● The Nifty PSU Bank sector has consolidated within a range and is nearing its support zone.
➖ Stocks to Watch - State Bank of India NSE:SBIN
● The stock is approaching its trendline support level.
● A buying opportunity may arise if the price reaches the 770 level.
4. Nifty Pharma NSE:CNXPHARMA
● After experiencing a downturn, the Nifty Pharma sector is now approaching its trendline support level.
➖ Stocks to Watch - Divis Laboratories NSE:DIVISLAB
● The price is overall in an uptrend.
● Following a record peak, the stock is now nearing its trendline support level.
● The best buy zone is between 5,500 and 5,600.
5. Nifty Media NSE:CNXMEDIA
● The Nifty Media sector is expected to witness a potential pullback towards the 1,720-1,760 level.
➖ Stocks to Watch - Network18 Media NSE:NETWORK18
● The stock is trading just above its trendline support zone, presenting a short to mid-term trading opportunity.
6. Nifty Realty NSE:CNXREALTY
● The Nifty Realty index is currently trading above its support zone.
➖ Stocks to Watch - Oberoi Realty NSE:OBEROIRLTY
● The stock is trading at the support zone and expected to rise soon.
7. Nifty FMCG NSE:CNXFMCG
● After a downfall, index is approaching its trendline support level
➖ Stocks to Watch - Varun Beverages NSE:VBL
● VBL is trading above its support zone, offering a short to mid-term trading opportunity.
8. Nifty Metal NSE:CNXMETAL
● The Nifty Metal sector is trading above its support zone,
➖ Stocks to Watch - Ratnamani Metals & Tubes NSE:RATNAMANI
● The stock price has formed an Ascending Triangle pattern and is currently trading above the support level.
9. Nifty Oil & Gas NSE:NIFTY_OIL_AND_GAS
● The Nifty Oil & Gas sector is also trading above its support zone.
➖ Stocks to Watch - Aegis Logistics NSE:AEGISLOG
● The stock price is close to breaking through its trendline resistance.
● If it can maintain its position above this level, a rally may be imminent.
10. Nifty Auto NSE:CNXAUTO
● Lastly, the Nifty Auto sector is trading above its support zone.
➖ Stocks to Watch - Eicher Motors NSE:EICHERMOT
● Eicher Motors is consolidating within a rectangle pattern, indicating a potential breakout.

A Healthcare Face-Off: Apollo vs. Narayana◉ Abstract
India's hospital industry is growing rapidly, valued at ₹8.35 lakh cr. ($98.98 B) in 2023, with a projected CAGR of 5.8-8.0% from 2024 to 2032. Apollo Hospitals and Narayana Hrudayalaya are two leading players, with Apollo being the largest private hospital network and Narayana Hrudayalaya known for cost-effective cardiac care. Narayana Hrudayalaya appears undervalued with a P/E ratio of 33.5 and more profitable (ROCE: 27%), making it an attractive investment option. Apollo Hospitals seems overvalued with a P/E ratio of 83.4 but remains viable for strategic entry points. Both companies are poised for growth driven by increasing healthcare demands and infrastructure expansion.
Read full analysis here........
◉ Introduction
The hospital industry in India is experiencing significant growth, with the market valued at approximately ₹8.35 lakh cr. ($98.98 B) in 2023. Projections indicate a robust compound annual growth rate (CAGR) of 5.8% to 8.0% from 2024 to 2032, potentially reaching between 13.87 lakh cr. and 16.33 lakh cr. ($164.4 B - $193.6 B) by 2032, depending on various market analyses.
◉ Growth Drivers of the Indian Hospital Industry
● Increased Healthcare Expenditure:
➖ Rising public and private spending on healthcare, with government health expenditure aiming for 2.5% of GDP by 2025.
➖ Expanding middle class with higher disposable incomes and greater access to health insurance.
● Technological Advancements:
➖ Adoption of healthcare technologies such as telemedicine and robotic automation, improving service delivery.
➖ National Digital Health Blueprint promoting innovations in e-health.
● Policy Support and Foreign Investment:
➖ Favourable government policies allowing 100% FDI in healthcare, attracting significant investments.
➖ Public-private partnerships enhancing healthcare access, especially in underserved areas.
● Demand for Specialized Services:
➖ Increasing incidence of lifestyle diseases driving demand for specialized healthcare.
➖ Growth in medical tourism as India becomes a preferred destination for cost-effective treatments.
These factors are collectively propelling the growth of the hospital industry in India, positioning it for a promising future.
◉ Key players in the Indian hospital sector
1. Apollo Hospitals leads the sector with a market capitalization of approximately ₹98,646 Cr, establishing itself as the largest private hospital network in India.
2. Max Healthcare closely follows, boasting a market capitalization of around ₹97,820 Cr.
3. Fortis Healthcare is another key participant in the market, with a market capitalization of ₹48,249 Cr.
4. Global Health also ranks among the premier healthcare institutions, holding a market capitalization of ₹28,786 Cr.
5. Narayana Hrudayalaya is recognized for its cost-effective cardiac care services and maintains a notable market share with a market capitalization of ₹26,086 Cr.
In this report, we will conduct an in-depth analysis and comparison between two of India's leading healthcare providers, Apollo Hospitals and Narayana Hrudayalaya. This comprehensive evaluation will assess their technical and fundamental aspects,
◉ Company Overviews
● Apollo Hospital NSE:APOLLOHOSP
Apollo Hospitals was founded in 1983 by Dr. Prathap C Reddy, a visionary in the evolution of modern healthcare in India. As the first corporate hospital in the country, Apollo Hospitals is celebrated for leading the charge in the private healthcare transformation.
Today, Apollo Hospitals stands as Asia's leading integrated healthcare services provider, boasting a strong footprint throughout the healthcare landscape. This includes a diverse range of services such as hospitals, pharmacies, primary care and diagnostic clinics, as well as various retail health models.
● Narayana Hrudalaya NSE:NH
Narayana Hrudayalaya Limited is involved in providing medical and healthcare services both in India and abroad. It functions through two main divisions: Medical and Healthcare Related Services, and Others. The organization is responsible for acquiring, owning, and managing a variety of healthcare facilities, including hospitals, clinics, health centres, diagnostic centres, and nursing homes, among other related operations. Its range of services encompasses cardiology, cardiac surgery, nephrology, urology, neurology, neurosurgery, endocrinology, orthopaedics, internal medicine, obstetrics, gynaecology, pediatrics, neonatology, gastroenterology, and oncology. Additionally, the company is active in the health insurance sector. Established in 2000, its headquarters is located in Bengaluru, India.
◉ Technical Analysis
● Apollo Hospitals
➖ The stock faced a significant obstacle near the 5,800 level, resulted in a steep drop.
➖ It later found support around 3,500 and rebounded.
➖ Following an extended period of consolidation, the price developed a Rounding Bottom pattern.
➖ A breakout ensued, leading to a price increase, but it encountered resistance close to 6,800, which triggered a pullback to the breakout point.
➖ Following a successful retest, the price surged past the previous high, reaching a new peak at 7,545.
➖ However, due to prevailing negative market sentiments, the price has since retraced and is currently trading just above its immediate support zone.
● Narayana Hrudalaya
➖ The stock price is overall in an uptrend.
➖ After reaching an all-time high close to the 1,445 level, the price experienced a decline and has since entered a consolidation phase.
➖ A Symmetrical Triangle pattern has formed on the chart.
➖ We expect an upward breakout from this pattern, which could lead to a significant price rally.
◉ Relative Strength
➖ The chart reveals that both Apollo and Narayana Hrudayalaya have underperformed the Nifty Healthcare index. Although Apollo has given a descent 31% return, Narayana lagged significantly, yielding a modest 17% return. In contrast, the Nifty Healthcare index delivered an impressive 41% return.
◉ Service Wise Revenue Breakdown
● Apollo Hospitals
The company operates through three primary segments, each contributing significantly to its revenue.
➖ Healthcare services account for approximately 52% of total revenue, forming the largest share.
➖ The retail pharmacy business generates nearly 41% of total sales, while the retail health and diagnostics segment contributes the remaining 7%.
● Narayana Hrudalaya
➖ The company operates exclusively in the healthcare services sector, deriving all its revenue from this single segment.
◉ Revenue & Profit Analysis
● Apollo Hospitals
Year-over-Year
➖ The company's fiscal year 2024 performance was marked by strong growth, with revenue reaching ₹19,059 crore, a 15% increase from ₹16,612 crore in FY23.
➖ EBITDA surged to ₹2,394 crore, up from ₹2,065 crore in FY23, while the EBITDA margin improved to 13% from 12%.
Quarter-over-Quarter
➖ In the latest quarter ending September 2024, the company achieved its highest-ever sales of ₹5,589 crore, significantly up from ₹5,086 crore in June 2024. This quarter-on-quarter growth has been consistent since March 2022.
➖ EBITDA for the quarter was an impressive ₹816 crore, a 21% increase from ₹675 crore in June 2024.
➖ Diluted EPS (LTM) rose substantially to ₹83.31 from ₹72.13 in June 2024.
● Narayana Hrudalaya
Year-over-Year
➖ In FY24, our company achieved remarkable sales growth, surging 11% to ₹5,018 crore from ₹4,525 crore in FY23.
➖ EBITDA soared to ₹1,173 crore, up from ₹987 crore in the same period, with an impressive EBITDA margin of 23%.
Quarter-over-Quarter
➖ Our quarterly sales reached an all-time high of ₹1,400 crore in September, representing a 4% increase from ₹1,341 crore in June.
➖ Although EBITDA growth was modest, it still improved to ₹308 crore in September from ₹304 crore in June 2024.
➖ However, Diluted EPS experienced a decline, dropping to ₹38.85 from ₹39.72.
◉ Valuation
● P/E Ratio
➖ Apollo Hospitals' current P/E ratio stands at 83.4, down from its 1-year median of 107.7. However, this remains significantly above the industry average of 56.9, indicating overvaluation.
➖ In contrast, Narayana Hrudalaya's P/E ratio of 33.5 is slightly above its 1-year median of 32.8 and substantially below the industry average, suggesting undervaluation.
● P/B Ratio
➖ Apollo's P/B ratio of 13.15 indicates considerable overvaluation compared to the industry average of 7.18.
➖ Narayana Hrudalaya's P/B ratio of 8.14 also suggests overvaluation, albeit to a lesser extent.
● PEG Ratio
➖ Narayana's PEG ratio of 0.49 positions it as an attractive investment opportunity, especially when compared to Apollo's considerably higher PEG of 2.43.
◉ Profitability Analysis
➖ Apollo Hospitals ROCE - 15% in FY24
➖ Narayana Hrudalaya ROCE - 27% in FY24
The significant difference in ROCE between the two healthcare giants underscores Narayana Hrudalaya's superior profitability. Narayana's impressive ROCE of 27% demonstrates its ability to efficiently utilize its total capital, comprising both equity and debt, to generate substantially higher returns.
◉ Cash Flow Analysis
➖ Apollo Hospitals has demonstrated impressive growth in its operating cash flow, surging 39% to ₹1,920 crore in FY24 from ₹1,377 crore in FY23. This robust growth underscores the company's efficiency in converting profits into cash, highlighting its strong financial health and liquidity position.
➖ In contrast, Narayana Hrudalaya has shown sluggishness in turning profits into cash, with its operating cash flow declining 2% to ₹1,067 crore in FY24 from ₹1,085 crore in FY23.
◉ Debt Analysis
➖ Apollo Hospitals' debt stands at ₹7,371 crore, resulting in a debt-to-equity ratio of 0.98, which, although relatively high, is not alarming. However, the company's low interest coverage ratio of 4.69 raises concerns about its ability to service its debt. This vulnerability may complicate repayment of borrowed loans, potentially straining Apollo's financial stability.
➖ In contrast, Narayana Hrudalaya's debt of ₹1,703 crore and debt-to-equity ratio of 0.53 indicate robust financial health. Furthermore, its impressive interest coverage ratio of 8.34 suggests the company is well-positioned to manage its debt obligations, ensuring greater financial flexibility and stability.
◉ Shareholding Pattern
● Apollo Hospitals
➖ In the September quarter, Foreign Institutional Investors (FIIs) increased their stake in Apollo Hospitals to 45.37%, up from the previous quarter.
➖ Conversely, Domestic Institutional Investors (DIIs) reduced their holdings to 19.94%, a significant decrease from 24.77% in the last quarter.
● Narayana Hrudalaya
➖ In contrast, Narayana Hrudalaya witnessed a decline in institutional investor holdings. FIIs reduced their stake to 9.69%, down from 10% in the previous quarter.
➖ Domestic Institutional Investors (DIIs) also decreased their holdings to 7.9%, down from 8.22% in the June quarter.
◉ Conclusion
Following a comprehensive analysis of both technical and fundamental aspects, we conclude that Narayana Hrudalaya appears to be favorably positioned from a valuation perspective, presenting an attractive investment opportunity.
However, this does not diminish Apollo Hospitals' potential. Although the stock currently appears overvalued, investors can consider accumulating shares during dips, making it a viable option for those seeking strategic entry points.
The healthcare sector's promising growth trajectory, fueled by rising healthcare demands and infrastructure expansion, positions both companies for potentially excellent returns in the near future.

The Breakout Retest Play: 5 Stocks to Consider1. Infosys NSE:INFY
● The stock has formed a Rounding Bottom pattern, and after the breakout, it rose significantly, reaching an all-time high near 1,990.
● Currently, the stock is trading slightly above the breakout level following a minor pullback.
➖ Best buy level: 1790 - 1830
2. ITC NSE:ITC
● The stock encountered resistance between the 470 and 480 levels multiple times.
● After breaking through this range, the price surged to an all-time high of 528.
● The price then faced rejection at this peak and has since retreated to the breakout level, where it is now rising again.
➖ Best buy level: 470 - 480
3. Lupin NSE:LUPIN
● The stock achieved a breakout after nearly nine years in August 2024.
● Following an initial upward movement, the stock price pulled back for a retest and is now trending upward once more.
➖ Best buy level: 2000 - 2050
4. Birlasoft NSE:BSOFT
● After breaking out of the Rounding Bottom pattern, the stock price surged to an all-time high of 856 before declining.
●The stock is currently trading at the breakout level, which appears to be a strong support.
➖ Best buy level: 550-560
5. Emami NSE:EMAMILTD
● After a prolonged consolidation, the stock developed an Inverted Head & Shoulder pattern.
● Following the breakout, the price surged to an all-time high of 860 but faced strong rejection from that level.
● The stock is now approaching a retest of the previous breakout level.
➖ Best buy level: 595 - 600
