RELIANCE — Dead Bounce or Structural Reclaim?CMP: 1,468
The uptrend is broken. That’s not opinion — that’s structure.
Lower highs. Momentum rollover. 200 DMA lost, then violently reclaimed.
Now we’re in the only zone that matters.
Price flushed into 1,360s.
Sharp recovery followed.
Currently testing the underside of the breakdown region around 1,470–1,490.
This is not random movement.
This is a re-pricing phase.
---
What This Actually Is
• Short-term averages curling up
• Price attempting to reclaim the 200 DMA (~1,460–1,480 cluster)
• Volume expanded on the flush — recovery volume improving but not dominant
This is a decision pocket.
Markets don’t hover here.
They resolve.
---
The Levels That Matter
Above 1,485–1,490 (acceptance, not a wick)
→ Path opens toward 1,520–1,560
→ That confirms the flush was exhaustion, not trend continuation
Failure below 1,440
→ Bounce was corrective
→ Retest of 1,400–1,360 liquidity becomes probable
---
We’re sitting at a harmonic pivot — price aligning with long-term average and prior supply.
These clusters tend to produce expansion, not drift.
No prediction.
Only conditional positioning.
#Reliance #MarketStructure #SwingTrading #NSE #PriceAction #Liquidity #TradingView
Stockstobuy

Buy on Dips - SCHNEIDER Analysis**SCHNEIDER - Buy on Dips | Strong Demand Zone + Triple Bottom**
📊 **Strong Price Action at Key Demand Zone**
Triple bottom formation at critical support - classic accumulation pattern:
**Why Buy on Dips:**
✅ Triple bottom shows institutional accumulation - **Demand Zone:** 561-600 (tested 3x since May 2025)
✅ Price defending demand zone with conviction
✅ Strong bounce from support - buyers stepping in
✅ All major MAs trending upward
**Targets:**
- **Tgt 1:** 862 (+12%) / - **Tgt 2:** 920 (+20%) / - **Tgt 3:** 1,000 (+30%)
**Strategy:**
Accumulate on any dip towards 730-750 zone. Strong hands at support making this a low-risk, high-reward setup.
**SL:** Below 730 (weekly close)
**Disclaimer:** This is for educational purposes only and not financial advice.
Always do your own research and consult with a financial advisor before making any investment decisions.
Trade at your own risk.

Automotive Axles - ATH Breakout - Investment Ideas#Automotive Axles Limited - Technical Analysis
Current Price: 1,790.80
#Breakout & Retest = Opportunity
#Technical Setup
Strategy: Swing to Short Term Trade
✅ **ATH Breakout + Retest** - Successfully retested breakout zone
✅ **Higher High Formation** - Clear uptrend structure
✅ **EMAs Sorted** - Bullish alignment confirmed
✅ **Trendline Breakout** - Long-term resistance conquered
#Key Levels
Support: 1,520 (Tight SL) | 1,504 (Major support)
Swing Targets:
- T1: 2,078
- T2: 2,189
- T3: 2,284
Short-Term Targets:
- T1: 2,546
- T2: 2,800
- T3: 2,933
- Grand T4: 3,125
#tradesetup
Entry: Current levels (1,790 - 1,800)
Stop Loss: 1,520 (daily closing basis)
Risk-Reward: 1:3+ (excellent)
Timeframe: 2-6 months
Disclaimer: For educational purposes only. Not investment advice. Trading involves substantial risk. Consult a SEBI-registered financial advisor before making investment decisions. Past performance doesn't guarantee future results.
#AutomotiveAxles #SwingTrading #BreakoutTrading #TechnicalAnalysis #NSE #AutoStocks #ShortTermTrading #StockMarket #ATHBreakout #IndianStocks

Understanding Stock Market TradingBasics of Stock Trading
At its core, stock trading involves purchasing a company’s equity, known as a share, with the expectation that its value will increase over time, providing capital gains or dividend income. Shares represent ownership in a company, giving shareholders certain rights, such as voting at annual general meetings and receiving dividends. The stock market operates under the principles of supply and demand. When demand for a stock increases, its price rises; when supply exceeds demand, the price falls.
There are two main types of stock market participants: retail investors (individuals) and institutional investors (mutual funds, banks, hedge funds, etc.). Retail investors often trade in smaller volumes and rely on personal research or brokerage platforms, whereas institutional investors handle large volumes of trades and have significant market influence.
Stock Exchanges and Trading Platforms
Trading occurs on stock exchanges—centralized platforms where buyers and sellers meet. Globally, major exchanges include the New York Stock Exchange (NYSE), NASDAQ, London Stock Exchange (LSE), and India’s National Stock Exchange (NSE) and Bombay Stock Exchange (BSE). These exchanges enforce strict regulations to ensure transparency, fair pricing, and investor protection.
In addition to traditional exchanges, trading has evolved through online brokerage platforms and mobile apps, which provide real-time market data, charts, and research tools. These platforms allow investors to place different types of orders, such as market orders, limit orders, and stop-loss orders, enabling greater control over trading strategies.
Types of Stock Market Trading
Stock trading is broadly categorized based on the time horizon and strategy:
Day Trading:
Day traders buy and sell stocks within the same trading day, aiming to profit from short-term price fluctuations. They rely heavily on technical analysis, charts, and real-time data. This type of trading is high-risk and requires quick decision-making and strict risk management.
Swing Trading:
Swing traders hold stocks for a few days to weeks, attempting to capture price movements during trends. This approach balances the intensity of day trading with a longer-term perspective and often uses a combination of technical and fundamental analysis.
Position Trading:
Position traders adopt a long-term approach, holding stocks for months or years. Their focus is on the underlying fundamentals of companies, economic trends, and growth potential rather than short-term market fluctuations.
Scalping:
Scalping is a high-frequency trading strategy where traders make numerous trades within minutes or seconds to capture small price differentials. It demands high precision, speed, and low transaction costs.
Fundamental and Technical Analysis
Successful stock trading relies on analysis, which can be divided into fundamental and technical approaches:
Fundamental Analysis:
This involves evaluating a company’s financial health, management, industry position, and growth prospects. Key metrics include earnings per share (EPS), price-to-earnings (P/E) ratio, revenue growth, profit margins, and debt levels. Macroeconomic factors like interest rates, inflation, and GDP growth also influence fundamental analysis. Investors using this method aim to identify undervalued stocks that are likely to grow over time.
Technical Analysis:
Technical analysis studies historical price movements and trading volumes to forecast future trends. Traders use charts, patterns, and indicators such as moving averages, Relative Strength Index (RSI), and Bollinger Bands. This method is widely used in short-term trading strategies like day trading and swing trading.
Many traders combine both methods to maximize insights. For instance, a swing trader may use fundamental analysis to select stocks and technical analysis to determine entry and exit points.
Derivatives and Advanced Trading
Beyond buying and selling stocks, traders can use derivatives such as options, futures, and contracts for difference (CFDs) to hedge risks or speculate.
Options give the right, but not the obligation, to buy or sell a stock at a predetermined price.
Futures are contracts to buy or sell an asset at a future date at a fixed price.
CFDs allow traders to speculate on price movements without owning the underlying asset.
These instruments amplify both potential profits and risks, requiring thorough understanding and careful risk management.
Risk Management and Psychology
Trading involves risk, as prices can fluctuate due to market volatility, economic events, or unexpected company performance. Effective risk management strategies include:
Setting stop-loss orders to limit potential losses
Diversifying across sectors and asset classes
Using position sizing to prevent excessive exposure
Equally important is trading psychology. Emotional control is critical, as fear and greed can drive impulsive decisions. Successful traders cultivate discipline, patience, and the ability to stick to their trading plans even under market stress.
Regulation and Compliance
Stock markets are heavily regulated to protect investors and maintain fair trading. Regulatory bodies, such as the Securities and Exchange Commission (SEC) in the U.S. and the Securities and Exchange Board of India (SEBI), enforce rules on transparency, insider trading, market manipulation, and reporting. Compliance ensures investor confidence and smooth functioning of markets.
Trends and Technology in Trading
Modern stock trading has been transformed by technology. Algorithmic trading and high-frequency trading leverage computers to execute trades at extremely high speeds based on predefined rules. Artificial intelligence and machine learning are increasingly used to analyze market data, detect patterns, and optimize trading strategies. Moreover, mobile trading apps and robo-advisors have democratized access, allowing even small investors to participate actively in markets.
Sustainability and ESG (Environmental, Social, and Governance) investing are also emerging trends, where traders consider non-financial factors while making investment decisions.
Conclusion
Stock market trading is both an art and a science. It provides opportunities for wealth creation, liquidity, and portfolio diversification, but it is not without risks. Success depends on a combination of knowledge, strategy, discipline, and emotional resilience. Whether you are a long-term investor focusing on fundamentals or a short-term trader analyzing technical charts, understanding market dynamics, regulatory frameworks, and risk management principles is essential.
The stock market reflects the broader economy and human behavior, making it a fascinating yet challenging domain. With the right approach, education, and patience, trading can be a rewarding avenue for financial growth and personal development.

Reliance Industries – Demand Re-engaging at a High-Probability Reliance Industries – Demand Re-engaging at a High-Probability Zone
• CMP: ₹1458.80
• Sharp selloff has retraced into a major demand pocket near ₹1440–1460
• Price reacting around the long-term moving average — historically a strong participation zone
• Selling momentum is slowing; candle structure shows rejection from lower levels
• This looks more like liquidation + absorption, not fresh distribution
• Risk is now clearly defined below structural support
🎯 Trade Plan
• Long Zone: ₹1460–1445
→ Target 1: ₹1515
→ Target 2: ₹1560
→ Stop-Loss: ₹1435
• If ₹1440 breaks decisively, step aside — no hero trades
💡 What matters here isn’t the fall — it’s where the fall stopped. This is where large money typically starts probing, quietly.
#Reliance #MarketStructure #DemandZone #SwingSetup #PriceAction #NSEStocks #TradingView

LTTS : Near Key Support | Trend Continuation WatchTimeframe: Daily
Trend Context: Corrective phase nearing completion
Current Price Zone: ~4,380
🔍 Market Structure & Technical Observations
Elliott Wave Perspective (Educational View):
The stock appears to be completing a corrective Wave-C near the 4,360–4,390 zone.
This zone aligns with prior demand and acts as a potential reversal pocket.
If Wave-C holds, the next impulsive leg (Wave-5) can begin.
Moving Average Insight:
Price has pulled back toward the short-term moving average, often seen near corrective endings.
Sustaining above this base improves odds of a trend resumption.
Support & Risk Zone:
Critical support: 4,360–4,390
Invalidation level: Daily close below 4,290
A close below this would indicate deeper correction, not accumulation.
Volume Behavior (Contextual):
No panic volume seen during decline, suggesting controlled profit booking, not distribution.
🎯 Trade Strategies
🟢 1. Swing Trading Strategy (Cash / Positional)
Buy Zone: 4,360–4,420 (on stabilization / reversal candle)
Stop Loss: Daily close below 4,290
Upside Targets:
Target 1: 4,770–4,830 (Major supply / F&O target zone)
Target 2: 5,120 (Swing projection)
📌 This setup offers a favorable Risk–Reward if price respects the Wave-C base.
🟡 2. F&O / Options Strategy (Educational)
Prefer bull call spreads or call buying only after confirmation.
Ideal confirmation:
Strong close above 4,480–4,500
OR bullish structure on lower timeframe from support
Avoid aggressive naked calls below 4,360, as volatility expansion works both ways.
🎓 Educational Notes (Why This Zone Matters)
Corrections often end where:
Prior breakout occurred
Fibonacci retracement clusters
Market sentiment turns pessimistic
The 4,360–4,390 zone ticks multiple boxes → making it a decision zone, not blind buy.
⚠️ Risk Management Guidelines
Do not average blindly below support.
Size positions assuming stop loss will be hit.
Options traders must factor in time decay — direction alone is not enough.
🧾 Summary & Conclusion
LTTS is currently at a make-or-break zone.
If the 4,360–4,390 support holds, the stock has the potential to resume its primary uptrend toward 4,830 and 5,120 in the coming weeks.
Failure to hold 4,290 on daily closing basis invalidates the bullish structure.
Disclaimer:
This analysis is for educational purposes only. I am not a SEBI registered analyst.
Markets are uncertain, and I may be wrong — please manage risk responsibly.

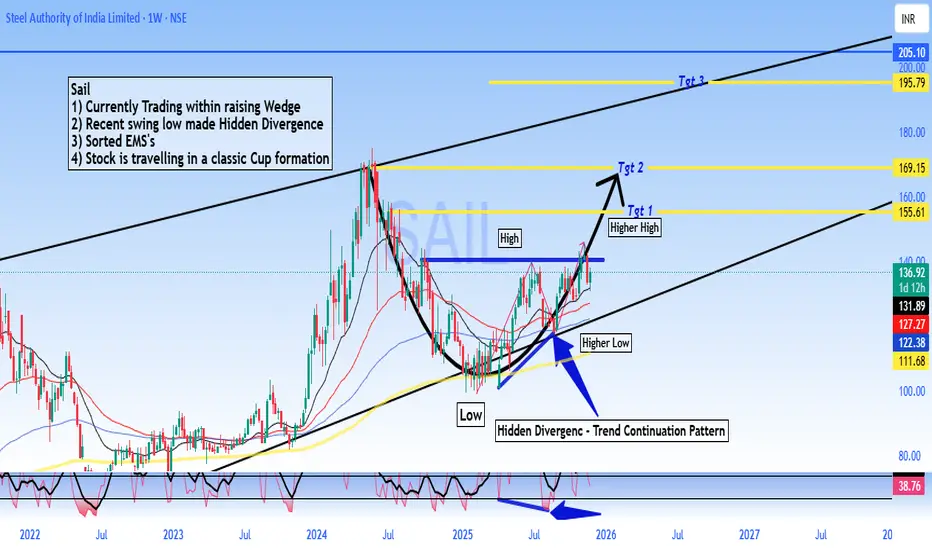
SAIL - Buy - Technical Analysis# Steel Authority of India Limited (SAIL) - Technical Analysis Report
Current Price: 136.92
Timeframe: Weekly Chart Analysis
Technical Setup Overview
SAIL is presenting a compelling technical picture with multiple bullish indicators aligning for a potential significant upward move. The stock is currently trading within a well-defined rising wedge pattern and has recently formed a **Hidden Divergence** on the weekly chart - a classic trend continuation signal.
Key Technical Observations
Rising Wedge Pattern:
The stock is trading within a rising wedge formation, which typically indicates consolidation before a breakout. The current price action suggests the stock is in the later stages of this pattern.
Hidden Divergence - Bullish Continuation Signal:
A **Hidden Divergence** has formed on the weekly timeframe.
- This pattern typically signals trend continuation and suggests the uptrend is likely to resume with strength
Sorted EMA Structure:
The Exponential Moving Averages are properly aligned, indicating a healthy bullish trend structure with multiple moving averages providing dynamic support.
Cup Formation in Progress:
The stock appears to be carving out a **classic Cup pattern**, which is a well-known bullish continuation formation. This pattern suggests accumulation and potential for a significant breakout move.
Price Targets & Projections
Based on the technical structure, here are the potential price targets:
Target 1: 155.61 (Higher High breakout level)
Target 2: 169.15
Target 3: 195.79
These targets are derived from the pattern structure and represent key resistance zones where profit-taking may occur.
Trading Strategy Considerations
For Swing Traders:
- Current levels offer a potential entry opportunity for medium to long-term positions
- A move above ₹140 could confirm the continuation pattern
- Stop loss can be placed below the recent higher low at 122 for risk management
Risk Factors to Monitor
- Failure to hold above ₹122 would invalidate the bullish hidden divergence
- Breakdown below the rising wedge support would change the outlook
- Sector performance and broader market conditions should be monitored
- Steel industry fundamentals and commodity price trends
🔔 Conclusion
SAIL is exhibiting strong technical characteristics with the Hidden Divergence pattern, sorted EMA structure, and cup formation all pointing toward potential upside. The current price action within the rising wedge presents an interesting risk-reward setup for traders and investors with appropriate risk management.
DISCLAIMER
This analysis is for educational and informational purposes only and should NOT be considered as investment advice or a recommendation to buy, sell, or hold any securities. - I am not a SEBI registered analyst or investment advisor - This is purely a technical analysis based on chart patterns and indicators - Past performance and technical patterns do not guarantee future results - Trading and investing in stocks involves substantial risk of loss - Always conduct your own research and due diligence before making any investment decisions - Consult with a qualified financial advisor before taking any investment positions - The author holds no responsibility for any profits or losses incurred based on this analysis - Risk management and position sizing are crucial - never invest more than you can afford to lose
**Trade/Invest at your own risk. Do your own analysis.**
#SAIL #SteelAuthorityOfIndia #StockMarket #TechnicalAnalysis #NSE #IndianStocks #ChartAnalysis #TradingView #StockTrading #HiddenDivergence #CupPattern #PriceAction #SwingTrading #Investing #MarketAnalysis #SteelSector #Commodities #TradingStrategy #ChartPatterns #TechnicalIndicators
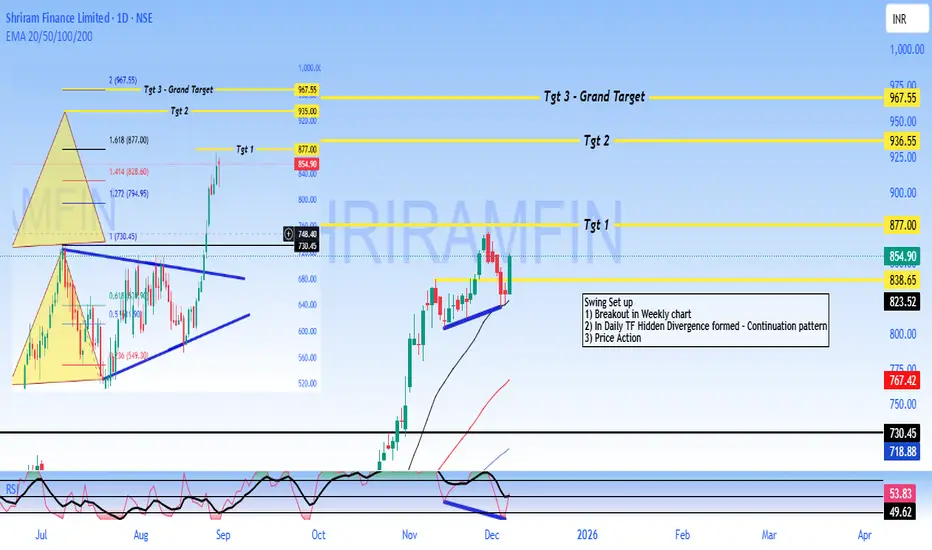
SHRIRAM - Buy - SwingTrading #Shriram Finance Limited - #Technical Analysis
Price: 854.90
#Technical Setup
Pattern: Continuation pattern with bullish hidden divergence following weekly breakout
Key Levels:
- Target 1: 877.00
- Target 2: 936.55
- Target 3: 967.55
- Support: 838 - 825 (critical)
- Major Support: 730.45
#Outlook
The chart shows a swing trading setup with upside potential toward 877 - 967 if support at 838 holds. A break below 825 would invalidate the bullish structure.
DISCLAIMER
This is NOT investment advice. This analysis is for educational purposes only. Trading involves substantial risk of loss. Always conduct your own research and consult a SEBI-registered financial advisor before making investment decisions. Past performance and technical patterns do not guarantee future results. The author assumes no responsibility for any losses incurred.
HINDUNILVR: Smart Money Accumulation Zone After CHoCH?📘 HINDUNILVR (HUL) — Technical Analysis | Structure Shift & Golden Retracement Setup
(Timeframe: Daily)
HINDUNILVR is currently trading around ₹2,265 after a prolonged corrective phase.
The chart reflects a Change of Character (CHoCH) followed by a controlled retracement into a high-probability demand zone, where the next directional move is likely to emerge.
🔍 Market Structure & Price Action
The stock previously witnessed a strong bullish extension, reaching the 113%–128% Fibonacci extension zone, indicating an overextended move.
Post extension, price showed loss of bullish momentum, leading to a CHoCH — a clear signal of shifting market control.
CHoCH highlights early trend transition and often leads to range-bound or corrective price action, rather than an immediate trend reversal.
📌 CHoCH helps traders prepare for structural transitions before confirmation from higher highs.
📐 Fibonacci & Wave Context
The decline from point A to B appears corrective, not impulsive.
Price has now entered the Golden Retracement Zone (50%–78%) of Wave A.
This zone is typically where Wave B or Wave 2 attempts to develop.
Institutional participants often accumulate positions here due to favorable risk–reward.
📌 Failure to hold this zone often results in a deeper correction or trend reversal.
🎯 Key Levels from the Chart
Major Demand Zone: ₹2,230 – ₹2,200
Invalidation Level: Day close below ₹2,200
First Target: ~₹2,630 (≈ 78% retracement of Wave AB)
Second Target: ₹2,826 – ₹2,888
🧭 Trading Strategy (Swing / Positional)
Look for long opportunities only inside the ₹2,230–₹2,200 zone.
Prefer confirmation signals such as:
– Bullish rejection wicks
– Higher-low formation
– Minor CHoCH on lower timeframes
Avoid aggressive entries without confirmation.
🛑 Risk Management
Strict stop loss: Day close below ₹2,200
A close below this level indicates weak demand and opens the risk of extended downside correction.
Partial profit booking recommended near Target 1.
Trail stop aggressively if price sustains above ₹2,630.
📚 Educational Notes
Golden Retracement (50%–78%) is where institutions seek value-based entries.
CHoCH ≠ Trend Reversal — it signals momentum loss, not instant bearishness.
Confirmation always comes from structure + demand holding, not prediction.
🔮 Probable Scenarios
Bullish Case:
Holding above ₹2,200 → Base formation → Gradual recovery toward ₹2,630 → ₹2,826–2,888.
Bearish Case:
Day close below ₹2,200 → Demand failure → Deeper corrective phase.
📌 Conclusion
HINDUNILVR is positioned at a critical inflection zone.
Risk is clearly defined, while upside potential remains asymmetric.
This is a wait-for-confirmation accumulation setup, not a chase trade.
⚠ DISCLAIMER
I am not a SEBI-registered analyst.
This analysis is for educational purposes only and should not be considered investment advice.
Always use your own analysis and risk management.

Sharda crop - Buy - Technical Analysis#Sharda Cropchem Ltd - Technical Analysis
Current Price: 908.30
#Key Observations
Bullish Structure:
- Price broke above the descending trendline (RSI HD pattern)
- Successfully formed Higher Low at ~ 855, confirming uptrend continuation
- Currently in "Price Action" zone after Higher High at 1,181
Critical Levels:
- Support: 855-895 (recent Higher Low zone)
- Resistance: 965 (0.9 Fib), 1,018 (0.618 Fib), 1,181 (recent high)
- Key Breakout: Above 1,018 could target 1,106-1,181 range
Technical Indicators:
- RSI in neutral zone showing momentum building
- Price action suggests consolidation before next move
- Previous resistance zone (blue box) now acting as support
The chart shows a bullish reversal pattern with higher lows forming. A sustained move above 965-1,018 zone could signal continuation toward the 1,181-1,300 levels. Watch for volume confirmation on breakouts.
DISCLAIMER: This is for educational purposes only and not investment advice. Trading in stocks involves substantial risk of loss. Always do your own research and consult with a certified financial advisor before making investment decisions. Past performance is not indicative of future results.

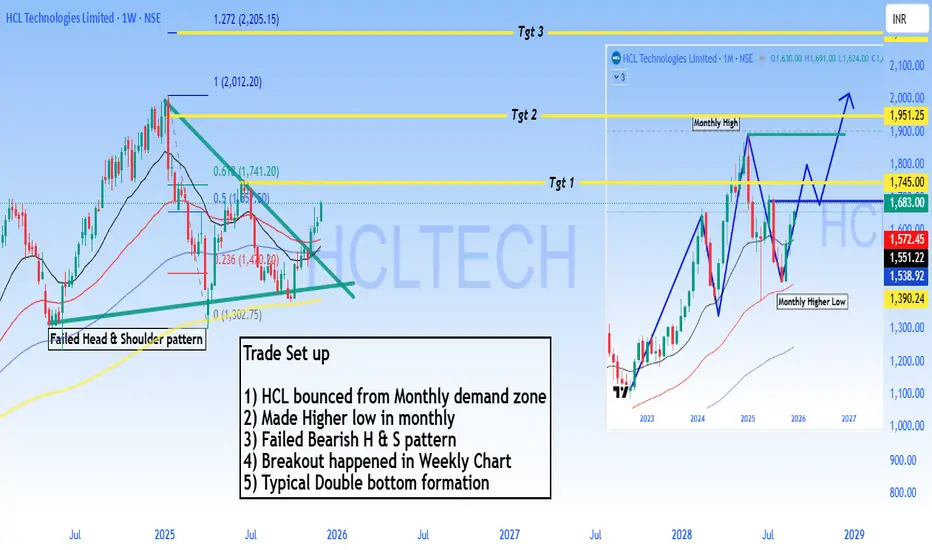
HCLT - Buy - Technical Analysis#HCL Technologies Limited - Technical Analysis
Price: 1,683.00 |
#Trade Setup - Bullish Reversal
#Outlook
Strong bullish setup with 4-35% upside potential. The failed bearish head & shoulder pattern combined with monthly demand zone bounce suggests institutional accumulation. Breakout above 1,745 opens path to 1,951 and beyond.
Pattern Analysis:
1. Bounced from monthly demand zone - Strong support established
2. Made higher low in monthly chart - Trend reversal signal
3. Failed Bearish Head & Shoulders pattern - Bears trapped, bullish continuation
4. Breakout confirmed on weekly chart - Momentum shift
5. Typical double bottom formation - Classic reversal pattern
Technical Structure:
- Monthly higher low at 1,390 confirms bullish structure
- Failed H&S pattern invalidation is highly bullish
- Price now targeting previous resistance zones
Target Levels:
- Target 1: 1,745.00
- Target 2: 1,951.25
- Target 3: 2,272.70
Support: 1,572 - 1,551 (critical zone)
⚠️ DISCLAIMER
**NOT investment advice.** Educational analysis only. Trading involves substantial risk of loss. Past patterns don't guarantee future results. Always do your own research and consult a SEBI-registered financial advisor. Author assumes no responsibility for losses.
#HCLTech #StockMarket #NSE #TechnicalAnalysis #ITStocks #IndianStockMarket #SwingTrading #Trading #FinTwit #TradingView #ChartAnalysis #StocksToWatch #Nifty50 #TechStocks
#Bajaj Finance Limited - BUY - Technical Analysis#Bajaj Finance Limited - #Technical Analysis
Price: 1,048.00
#Swing Trading Setup
Pattern: #Range #breakout with #consolidation above breakout zone. #Triangle/Box pattern breakout with target hit. Currently forming double bottom pattern.
Key Technical Points:
1. Range breakout & consolidating above breakout area
2. EMA's sorted & aligned - price trading above all EMAs
3. Triangle/Box pattern breakout - target achieved, now forming double bottom
4. Classic divergence in recent bounce area confirming retracement completion
Target Levels:
- Target 1: 1,103.80
- Swing Target 2: 1,155.00
- Grand Target: 1,225.00
Support: 1,026 - 1,018 (critical zone)
#Outlook
Strong bullish structure with potential upside of 10-17% toward targets. The double bottom formation suggests the retracement phase is complete. Price sustaining above ₹1,048 confirms continuation toward higher targets.
⚠️ DISCLAIMER
This is NOT investment advice. For educational purposes only. Stock trading involves substantial risk. Past performance doesn't guarantee future results. Always do your own research and consult a SEBI-registered financial advisor before investing. Author assumes no responsibility for losses.
#BajajFinance #StockMarket #NSE #TechnicalAnalysis #SwingTrading #IndianStockMarket #Trading #FinTwit #ChartAnalysis #StocksToWatch #TradingView #MarketAnalysis

SBI Buy - Range Breakout - Technical analysis#State Bank of India - #TechnicalAnalysis - #sbin
Price: 948.85 |
#Technical Setup
Pattern: #Swing trade setup with All-Time High (ATH) breakout confirmed on monthly chart. #Pullback/base formation in progress before next upward move.
Strategy: Conservative buy on breakout on candle-closing basis
Entry: Buy above 973.30
Stop Loss: 944.45
**Key Levels:**
- Target 1: 1,025.00
- Target 2: 1,055.80
- Grand Target: 1,144.00
- Support: 961.78 - 944.45
#Technical Observations
1. **Range & ATH Breakout** confirmed on monthly timeframe
2. Current pullback/base formation before next leg up
3. **EMA's aligned** confirming uptrend structure
4. **Hidden Divergence (HD)** formed in RSI - trend continuation pattern
5. Price action remains constructive on daily chart
⚠️ DISCLAIMER
**This is NOT investment advice.** This analysis is for educational purposes only. Stock trading involves substantial risk of loss. Past performance and technical patterns do not guarantee future results. Always conduct your own research and consult a SEBI-registered financial advisor before making any investment decisions. The author assumes no responsibility for trading losses incurred.

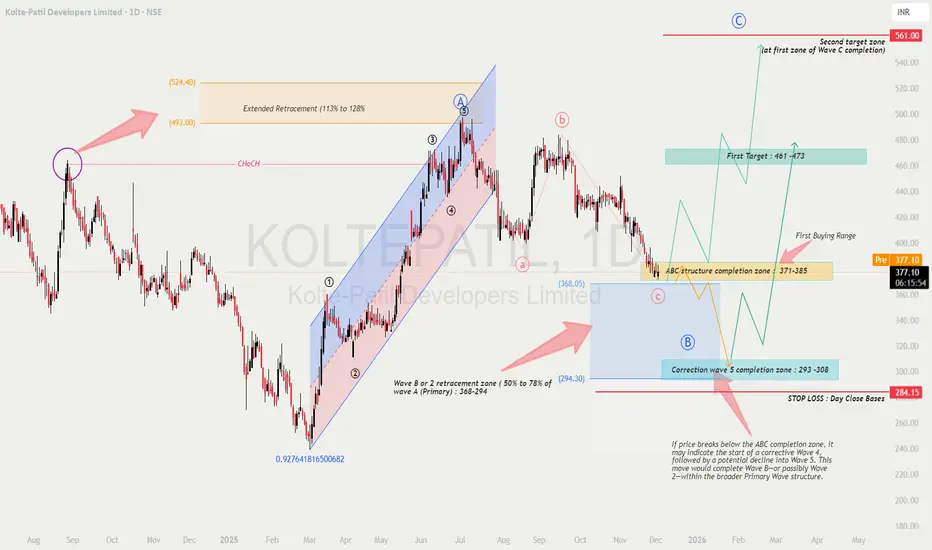
KOLTEPATIL - Wave Analysis
Educational breakdown based solely on chart structure
🔍 1. Chart Findings & Market Structure
The chart shows a clear Elliott Wave progression, where the previous impulse (Primary Wave A) topped near ₹493–524, followed by a corrective ABC decline.
✔ Key Observations
Primary Wave A formed an impulsive rally inside a rising channel.
The price later broke structure (CHoCH) indicating loss of momentum.
Current price (₹377) is trading inside the ABC structure completion zone of ₹371–385, a critical decision area.
A deeper correction toward ₹293–308 remains possible if Wave C extends.
🎓 2. Educational Points (Why These Levels Matter)
📘 A. Extended Retracement Zone: 113–128%
The chart marks ₹493–524 as the extended retracement area, which often acts as:
A wave A termination area
Strong reversal zone
Liquidity grab region
This supports the idea that the major impulse from March–July is complete.
📘 B. Wave B / Wave 2 Retracement
A natural correction for Wave B or Wave 2 typically pulls back 50–78% of the previous impulse.
This gives the ₹368–294 broad range as the acceptable retracement.
📘 C. Completing Wave C (Corrective ABC)
Wave C generally equals Wave A or 1.272–1.618 extension of Wave A.
The chart’s projection supports a potential completion:
First zone: ₹371–385 (current test)
Final zone: ₹293–308 (if extended C-wave unfolds)
📉 3. Current Price Action Insight
Price is currently hovering near the ABC structure completion zone (₹371–385).
No strong bullish reversal candle is visible yet—indicating buyers are waiting for confirmation.
Price remains in a downward corrective structure, but nearing exhaustion.
This phase is ideal for planning, not rushing.
🔮 4. Future Prediction Based on Wave Theory
Two scenarios emerge:
🟦 Scenario 1: ABC Correction Completes at Current Levels (₹371–385)
If the current demand zone holds:
Price forms a wave B bottom and begins Primary Wave C upward.
Expected targets:
🎯 First Target: ₹461–473
🎯 Final Target: ₹561 (Primary Wave C completion zone)
🟥 Scenario 2: ABC Correction Extends to ₹293–308
If ₹371–385 fails:
Market enters the correction wave 5 completion zone (₹293–308).
From this demand block, a stronger bullish reversal is expected.
Long-term bullish structure remains intact if it stays above ₹284 (stop level).
🛒 5. Buying Strategy (Educated Approach)
🟩 FIRST BUYING RANGE: ₹371–385 (Conservative Entry)
Enter only if:
Strong bullish candle (engulfing / pin bar / OB reclaim)
RSI bullish divergence
Price closes above structure high (minor CHoCH)
🟦 SECOND BUYING RANGE: ₹293–308 (High-Value Entry)
A deeper correction provides:
Lower risk
Maximum R:R
Stronger probability of reversal
Use this zone if the first one fails.
⚖ 6. Risk–Reward Analysis
If entering at ₹371–385
Stop-Loss: Below ₹284 (daily close basis)
Upside Potential: Up to ₹561
Reward : Risk Ratio: Approx 3.5–4.2 R
If entering at ₹293–308
Stop-Loss: Below ₹284
Upside Potential: Up to ₹473–561
Reward : Risk Ratio: Approx 5–7 R (excellent)
🔐 7. Confirmation Strategies for Better Entries
Use any two or more of the following:
✔ 1. Market Structure Shift
Wait for a CHoCH above the last swing high inside the zone.
✔ 2. Volume Expansion
Rising green volume during rebound increases reliability.
✔ 3. Bullish Divergence (RSI or MACD)
Signals weakening sellers.
✔ 4. Break & Retest Method
Let price break a minor resistance
Enter on retest to confirm strength
✔ 5. Demand Zone Reaction
Look for:
Long tail candles
Absorption wicks
Order block reclaim
These indicate smart money interest.
🧠 8. Summary & View
The stock is in the final leg of a correction and is approaching highly reactive Fibonacci zones.
Structure favors a bullish wave (Primary Wave C) in the coming months if key support holds.
📌 First confirmation: Bounce from ₹371–385
📌 Strongest bullish case: Reversal from ₹293–308
📌 Invalidation: Close below ₹284
The long setup has strong wave logic, clean levels, and attractive R:R.
⚠️ Disclaimer
This analysis is for educational purposes only and reflects wave-structure interpretation based solely on the provided chart.
I am not a SEBI-registered analyst.
Please conduct your own research or consult your financial advisor before trading or investing.
SRF LTD - Short term Investment#SRF Limited - Technical Analysis
Current Price: 2,927.30
Quick Overview
Strategy: Short to Long Term Investment
Pattern: Multi-year consolidation breakout (Jan'21-Feb'25) with successful retest
#Technical Setup
✅ Long Consolidation Breakout & Retest - 4-year base broken
✅ Buy on Dips - Current correction = opportunity
✅ Sorted EMAs - All moving averages bullish
✅ Higher Highs - Clean uptrend structure
#Key Levels
Support:
- 2,838 (Immediate)
- 2,720 (Strong)
- 2,400 (Major - Weekly SL)
Targets:
- T1: 3,163
- T2: 3,472
- T3: 4,049
Entry Zones:
- Primary: 2,850 - 2,950 (Current)
- Secondary: 2,720 - 2,800 (on dips)
Risk-Reward: 1:2.3 (to final target)
#Strategy - Build positions in tranches during dips. Hold for short term for optimal returns. Book partial at ₹3,163, hold core for higher targets.
Disclaimer: For educational purposes only. Not investment advice. Markets are subject to risks. Consult a SEBI-registered advisor before investing. Past performance doesn't guarantee future results.
#SRFLimited #LongTermInvesting #BreakoutTrading #TechnicalAnalysis #NSE #ChemicalStocks #PatiencePaysPremium #IndianStockMarket #PositionalTrading

BIL - Buy - ATH Breakout#Bhartiya International Limited - Technical Analysis Report
Current Price: 879.85
Market Overview
Bhartiya International is displaying strong bullish momentum after successfully retesting its 2017 high breakout level. The stock is currently sustaining above recent highs, indicating robust buyer interest and potential for further upside.
Technical Setup
Swing Trade Configuration:
- Entry Zone: Current levels around 880
- Stop Loss: 851.50 (below recent consolidation)
- Risk-Reward: Favorable with multiple upside targets
Price Targets:
- Near-term: 961 / 1018 / 1099 / 1253
- Long-term: 1330 / 1720
Key Technical Observations
1. **2017 High Breakout Retest:** The stock has successfully broken out and retested the 2017 high resistance, which has now converted into support. This is a classic bullish pattern indicating strength.
2. **50-period EMA Support:** Price is sustaining above the 50 EMA, confirming the uptrend remains intact.
3. **Hidden Divergence:** The chart shows hidden divergence on lower timeframes, typically indicating trend continuation - a bullish signal for swing traders.
4. **Higher Highs Formation:** The stock is consistently making higher highs, demonstrating strong momentum and buyer dominance.
Trading Strategy
The setup favors swing traders looking for medium-term gains. The retracement and previous all-time high methodology suggests a structured approach to profit booking at each target level while maintaining a trailing stop loss.
Targets based on Fibonacci retracement, previous retracement patterns, and historical ATH analysis.
**Disclaimer:** This analysis is for educational purposes only. Please conduct your own research and consult with a financial advisor before making investment decisions. Past performance does not guarantee future results.

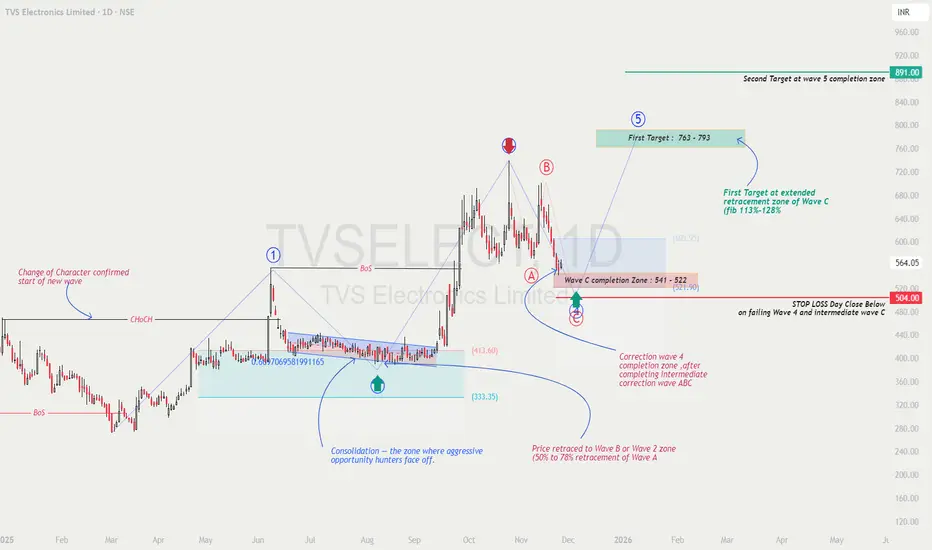
High-Probability Elliott Wave Setup on TVSELECTTVS ELECTRONICS – Wave C Completion Zone Hit | Wave 5 Rally Setup Loading?
🧠 Market Structure & Wave Breakdown
TVS Electronics is forming a textbook Elliott Wave structure.
After a powerful impulsive Wave 1, the price has completed a clean A–B–C corrective phase, and is now sitting inside the crucial Wave C completion zone (₹541–₹522) 🔥.
This zone aligns with:
50–78% retracement of Wave A (typical Wave B/2 retracement)
Demand + structure support from previous consolidation
Market psychology reset after an overextended Wave B
This is where the early reversal of Wave 5 typically begins 📈.
📚 Educational Insights
🔄 ChoCH – Change of Character:
The earlier breakout confirmed a structural shift, marking the start of the new Elliott Wave cycle.
When ChoCH appears again near lows, it often signals the end of corrections.
📉 A–B–C Corrections Explained:
Price forms Wave A (sharp drop) → Wave B (retracement) → Wave C (final flush).
Wave C often completes at deeper zones like the 113–128% extension, which aligns with this chart.
🌀 Wave C Completion Zone (541–522):
This zone marks exhaustion of sellers and transition to accumulation, especially when aligned with fibs AND structural support.
🚀 Wave 5 Expectations:
Wave 5 is usually driven by renewed momentum, volume expansion, and trend continuation.
Targets come from fib extensions of Wave 4.
🎯 Prediction & Targets
If the price reverses from the ₹541–₹522 support and breaks structure upward:
🎯 First Target (Wave 5 Mid-Zone): ₹763 – ₹793
🎯 Second Target (Wave 5 Completion): ₹891
A break above ₹605.95 (previous micro-structure high) will confirm the bullish wave activation.
🛑 Stop Loss (Closing Basis): Below ₹504
This level invalidates the Wave 4 / Wave C completion structure.
💡 Trading Strategy (Educational Purpose Only)
🟢 Entry Zone: ₹541–₹522
Look for bullish reversal patterns → Hammer, Engulfing, Double Bottom, or ChoCH.
📈 Confirmation Entry:
Break above ₹605.95 + retest → safer Wave 5 trend-following entry.
🎯 Profit Booking:
• Partial at ₹763–₹793
• Final around ₹891
⚖️ Risk Management:
• Use SL below ₹504 (daily close).
• Risk max 1–2% of capital.
• Don’t chase candles — wait for clean structure break.
🧩 Summary & Outlook
TVS Electronics has now entered the Wave C completion zone, a high-probability demand and reversal area.
If buyers step in here and structure flips bullish, a Wave 5 rally toward ₹763 → ₹891 could unfold.
This setup aligns perfectly with Elliott Wave principles, Fibonacci confluence, and structural demand. ⚡
⚠️ Disclaimer
I am not a SEBI-registered analyst.
This analysis is for educational purposes only — not financial advice.
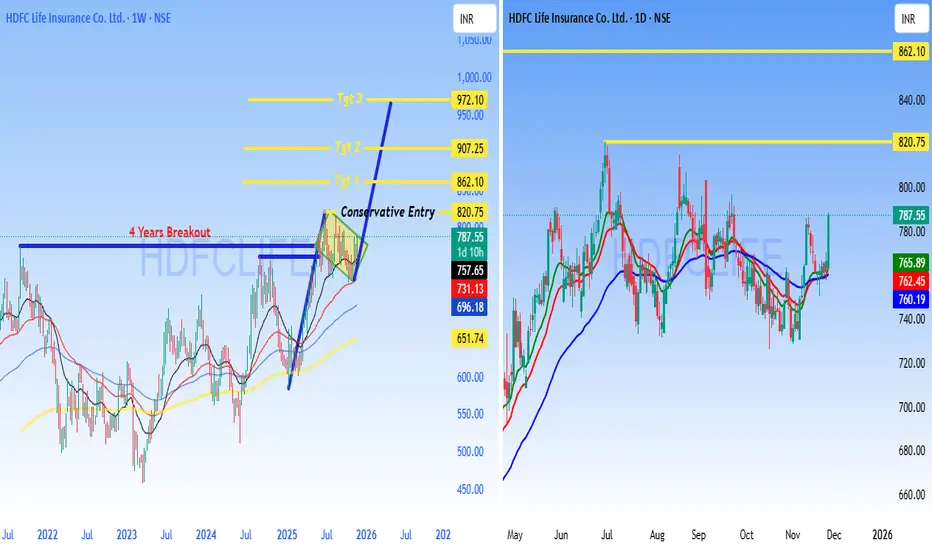
HDFCLIFE - BUY - Technical AnalysisHDFC Life Insurance - 4-Year Breakout Setup
HDFCLIFE (NSE) Current Price: 787.55
Date: November 27, 2025
Key Highlight: 4-YEAR BREAKOUT CONFIRMED
HDFC Life has broken out from a **4-year consolidation zone** around 787, signaling a major technical development with significant upside potential.
Technical Setup
4-Year Resistance Breakout - Stock cleared multi-year hurdle
Strong Volume Confirmation - Breakout supported by buying interest
Higher Highs Pattern - Bullish structure on daily chart
Moving Averages Aligned - Trending above key EMAs
Price Targets
Target 1: 862.10
Target 2: 907.25
Target 3: 972.10
Conservative Entry: 820.75 (post-retest confirmation)
Trading Plan
Entry Zone: 787-820
Stop Loss: Below 757 (breakout invalidation)
Risk:Reward: 1:3+ favorable setup
Strategy: Long-term breakout traders can accumulate; conservative traders wait for pullback to ₹820 zone.
- 4-year resistance breakouts often lead to sustained rallies
- Insurance sector showing strength
- Strong institutional interest in HDFC Life
- Technical + fundamental alignment
Risk Management
- Use stop loss below 757
- Position size: Risk only 1-2% capital
- Trail stop loss as targets are achieved
- Monitor broader market conditions
DISCLAIMER
**NOT investment advice. For educational purposes only.** I am NOT a SEBI registered analyst. This is technical analysis based on chart patterns. Trading involves substantial risk. Do your own research (DYOR). Consult a financial advisor before investing. Trade at your own risk.
**#HDFCLIFE #Breakout #StockMarket #NSE #TechnicalAnalysis #Insurance #Trading #IndianStocks #ChartAnalysis #SwingTrading #BreakoutTrading #TradingView #StockAlert #BullishSetup #PriceAction**
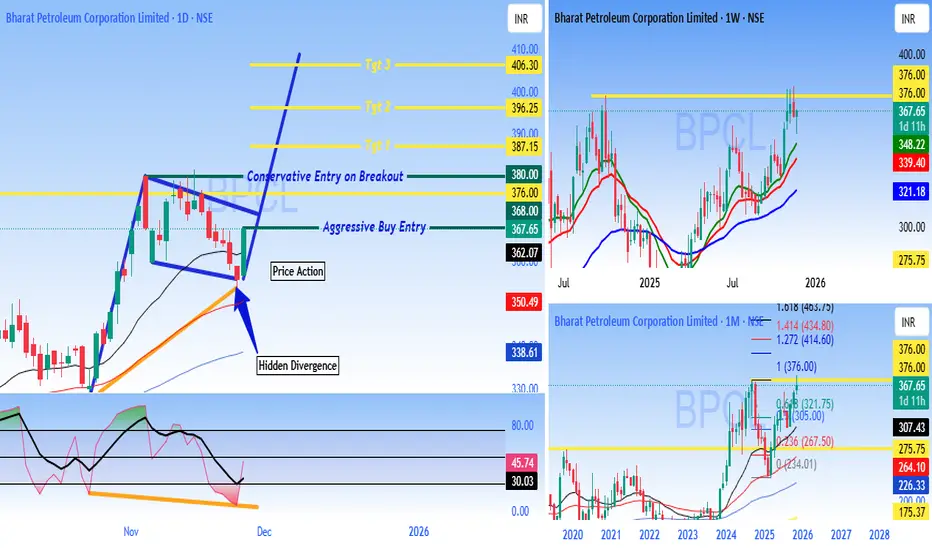
BPCL - Buy - ATH breakout - Technical Analysis#Bharat Petroleum Corporation Limited (BPCL) - #Technical Analysis Report
Current Price: 356.80 (Daily)
Multi-Timeframe Technical Analysis:
BPCL is displaying strong bullish momentum across multiple timeframes with a compelling technical setup featuring **Hidden Divergence** and a clear breakout structure on the daily chart.
Daily Chart Analysis - Key Technical Patterns:
1. Hidden Divergence Confirmed
- Classic Trend continuation signal indicating the uptrend is likely to resume with strength
2. Breakout Structure
- Stock has broken out from a consolidation zone around ₹362
- Currently trading above key resistance turned support
3. Trade Entry:
Aggressive Buy Entry:
As #Priceaction has formed already for traders who want immediate entry Buy will be active above 367.65
Conservative Entry on Breakout:
Initiate trades on candle close above 380
Price Targets
Target 1: 387.15
Target 2: 396.25
Target 3: 406.30
These targets are based on Fibonacci extensions and resistance zones from the pattern structure.
Weekly & Monthly Chart Context
Weekly Chart Shows:
- Strong uptrend since 2024 lows
- Stock trading near multi-year highs around 367-370 zone
- Higher highs and higher lows pattern intact
- Moving averages well-aligned in bullish configuration
Monthly Chart Indicates:
- Long-term recovery from 2020-2023 correction phase
- Breaking out from multi-year resistance zone
- Potential for extended rally toward ₹376-400 zone
Momentum Indicators
- Hidden divergence on daily timeframe = Bullish continuation
- Price action showing strength above key moving averages
- Volume expansion on breakout candles (positive sign)
- RSI/Momentum indicators supporting the upward move
The combination of bullish patterns and momentum indicators suggests potential for continuation toward higher targets. Traders should maintain strict risk management and adjust positions based on price action at key levels.
DISCLAIMER
This analysis is for educational and informational purposes only and should NOT be considered as investment advice or a recommendation to buy, sell, or hold any securities - I am NOT a SEBI registered analyst or investment advisor - This is purely a technical analysis based on chart patterns, indicators, and price action - Past performance and technical patterns do not guarantee future results - Trading and investing in stocks involves substantial risk of loss and may not be suitable for all investors - Always conduct your own research, due diligence, and analysis before making any investment decisions - Consult with a qualified financial advisor before taking any investment positions - The author/analyst holds no responsibility for any profits or losses incurred based on this analysis - Risk management is crucial - never invest more than you can afford to lose - Stop losses are mandatory for capital protection - Markets can remain irrational longer than you can remain solvent
Trade/Invest at your own risk. DYOR (Do Your Own Research).
#BPCL #TechnicalAnalysis #StockMarket #NSE #IndianStocks #Trading #HiddenDivergence #Breakout #OilAndGas #PSU #ChartAnalysis #TradingView #SwingTrading #DayTrading #PriceAction #StockTrading #MarketAnalysis #OMC #EnergyStocks #BullishSetup
Buy MCX#MCX (Multi Commodity Exchange) Technical Analysis Summary
Current Market Price : ₹8,051.50
Dow Theory Analysis
The chart perfectly demonstrates **Dow Theory principles** in action:
Bullish Structure
Higher Highs : Clear progression from previous peaks
Higher Lows : Each dip maintains above previous lows
Fresh Higher High : Recent peak establishing new uptrend confirmation
Key Technical Levels
Daily Resistance : 8,339.00
Weekly Resistance : 8,901.50
Previous ATH : 9,115.00
Multiple Pattern Confirmations
1. Flag & Pole Pattern : - Bullish continuation pattern Suggests upward momentum continuation
2. Harmonic Pattern :
- Trading near point B
- Activation Level : 8,148.50
- 1st Target : 9,115 (Previous ATH)
- 2nd Target : 9,964 (Current projection)
Do your own analysis before Initiating any Trades.

Sunpharma Buy - Trade confirmationSunpharma - Bullish Breakout
1) Strong Trendline Breakout
2) From recent low made Higher High
3) Solid Range Breakout
4) EMA crossover and Sorted.
Disclaimer - Charts shared are for educational purposes only. It’s not a trade recommendation. Market are subject to financial risk, Do your own analysis before initiating any Trade.

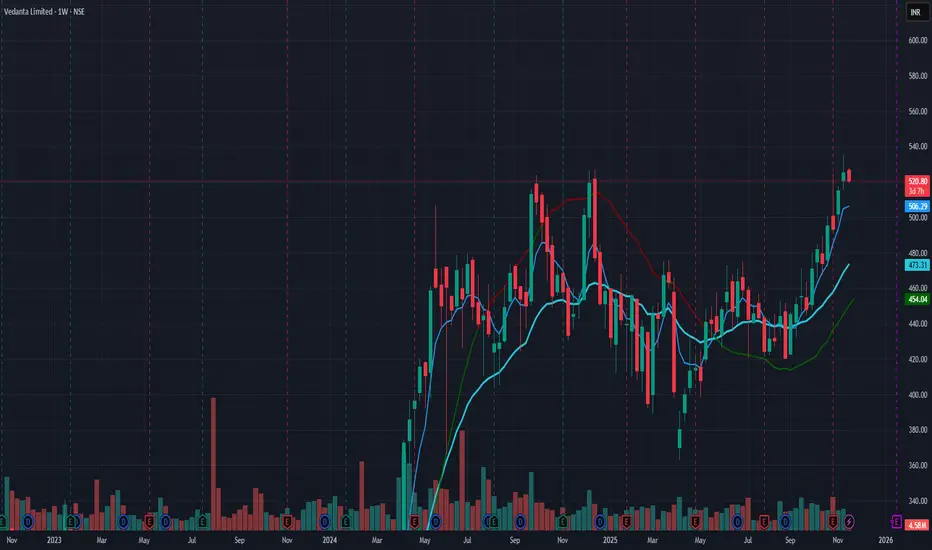
Vedanta: Strength Looks Simple — Patience Makes It ProfitableEveryone wants to catch the trend,
but few can sit through it without second-guessing themselves.
That’s what separates disciplined traders from impulsive ones.
🔎 Technical Context
On the daily chart, price is in a clean uptrend — higher highs, higher lows.
Currently hovering around ₹520, testing a short-term pause after a sharp rally.
20 & 50 MAs are rising and well-aligned → strong structure.
Volume expansion confirms institutional participation.
Switch to the weekly chart:
A powerful breakout above ₹480 ended months of consolidation.
Price is now in its first retest phase — the zone where conviction is tested.
This is not weakness — it’s digestion after strength.
🧠 Mindset Lesson
Most traders exit here, thinking “it’s gone too high.”
But that’s just emotion disguised as logic.
Professionals do the opposite:
they scale in or hold steady, guided by process — not feeling.
True mastery is sitting through discomfort when the trend is working,
and doing nothing while everyone else overreacts.
Trading looks like timing,
but in reality, it’s temperament.
👉 The edge isn’t in finding trends — it’s in surviving them.
💡 Save this as a reminder. Follow for daily trader mindset + educational insights that sharpen execution and patience.
L&T Multiyear BreakoutLarsen & Toubro Limited - Multi-Timeframe Breakout Analysis
Current Price:4,004.40
CRITICAL SETUP ALERT
L&T is at a pivotal moment with breakouts confirmed on weekly and monthly timeframes. The stock is now in a crucial period that will determine the validity of this range breakout.
KEY TECHNICAL OBSERVATIONS
Weekly Chart Analysis:
- Nearly 1.9 Years of Consolidation (2023-2025) between 3,200-3,800
- Clean breakout above 3,800 resistance with strong momentum
- All major EMAs (20/50/100/200) aligned bullishly
- Long accumulation phase suggests institutional participation
Monthly Chart Analysis :
- Breakout confirmed above 4,250 resistance box
- Strong bullish candle with healthy volume expansion
- EMAs: 20 | 50 |100 I 200 - all rising
Current Status:
✅ Breakout happened on weekly/monthly charts
⏳ Awaiting confirmation via follow-up candle close
📈 Price holding above breakout zone shows strength
🎯 PRICE TARGETS
Based on the range breakout and Fibonacci projections:
- Target 1: 4,451.25 (Immediate resistance)
- Target 2: 4,809.60 (Major psychological level)
- Target 3: 5,424.35 (Extended target - 35% upside)
- Target 4: 5,750+ (Bullish scenario)
📌 CRITICAL LEVELS
Support Zones:
- S1: 3,740 (Breakout retest level)
- S2: 3,611 (20 EMA on weekly)
- S3: 3,419 (Consolidation top - breakdown level)
WHAT MAKES THIS SETUP SPECIAL?
1. Time Factor: 1.9 years of consolidation = strong base building
2. Multi-Timeframe Alignment: Breakout on both weekly AND monthly charts
3. Volume Confirmation: Significant expansion during breakout
4. Long-Term Trend: Steep uptrend from 2020 lows still intact
For Conservative Traders:
- Wait for successful retest of 3,740-₹3,800 zone
- Confirm with strong bounce and volume
- Enter on confirmation with tighter stops
For Long-Term Investors:
- Accumulate on any dip to 3,700-3,800
- Strong fundamental backing (Infrastructure leader)
- Multi-year breakout suggests sustained momentum
- Target: 5,500-6,000 (12-18 months)
- ❌ Failure Signal: Close below 3,740 = False breakout, back to range
What to Watch:
1. Monthly candle close (crucial for pattern confirmation)
2. Volume sustenance above breakout level
3. No bearish engulfing on weekly/monthly timeframe
4. Hold above previous consolidation high (3,800)
DISCLAIMER:
This analysis is for educational purposes only and NOT financial advice.
- Technical patterns may fail; past performance doesn't guarantee future results - Breakouts can be false; always use stop losses - Conduct your own research and consult a financial advisor - The author may or may not hold positions in L&T - Trading/investing involves substantial risk of capital loss - You are solely responsible for your investment decisions
**Trade responsibly with proper risk management.**
#LarsenToubro #LT #Breakout #TechnicalAnalysis #NSE #Infrastructure #RangeBreakout #MultiTimeframe #BlueChip #IndianStocks
