HEROMOTOCO – Wave 5 Setup Unfolding After Ideal Wave 4 📘 HERO MOTOCORP – Wave 5 Setup from Textbook Elliott Structure
Timeframe: Weekly
Structure: Impulsive (1–2–3–4 complete) → Preparing for Wave 5
Type: Positional Swing Setup | Elliott Wave Based
🔍 1. Elliott Wave Structure Breakdown:
Wave 1: ₹1,475 to ₹3,629
Wave 2: Retraced to ₹2,146.85 (between 50%–78.6% Fib of Wave 1)
Wave 3: Impulse to ₹6,246.25
Wave 4: Currently correcting between 38.2%–61.8% Fib of Wave 3 (₹4,680–₹3,712)
✅ Price found support near ₹3,344, which is just below 61.8% retracement – a common zone for Wave 4 completion.
🟫 2. Wave 4 Support Zone – ₹3,712 to ₹3,344:
This zone is acting as a potential reversal base with:
Fib retracement confluence: 38.2%–61.8% of Wave 3
Failed breakdown attempts followed by recovery candles
CHoCH observed in lower timeframes – suggests momentum shift
🟩 3. Breakout Confirmation Level – ₹4,680:
Breaking above ₹4,680–₹4,800 range would confirm Wave 5 activation
Indicates structure validation + bullish resumption
Close above this zone = strength & momentum breakout
📈 4. Wave 5 Target Projection – ₹6,595 to ₹7,019:
Calculated using:
113%–127% Fibonacci extension of Wave 3
Historical rally symmetry from Wave 1 and 3
Target zone offers positional upside potential of ~55%+
🛑 5. Stop Loss & Invalidation Level:
SL Zone: ₹3,344
Sustained breakdown below this invalidates Wave 4 base
Can lead to sharp drop toward ₹2,600–2,900 (next Fib cluster)
✅ 6. Trade Plan (Swing):
Accumulation Zone: ₹3,700 – ₹4,300 (if support structure holds)
Breakout Entry: Close above ₹4,680–4,800
Stop Loss: ₹3,344
Target: ₹6,595–7,019 (Wave 5 zone)
🧠 7. Why This Setup Matters:
Elliott Wave Confluence: Clean 1–2–3–4 formation
Textbook Fib Behavior: Wave 2 and Wave 4 within ideal retracement ranges
Defined R:R Structure: Tight invalidation + 1:2+ reward
Momentum Setup: Wave 5 can unfold rapidly once confirmed
📌 Conclusion:
HERO MOTOCORP is poised for a potential Wave 5 rally after a well-behaved corrective Wave 4.
A breakout above ₹4,680 could trigger bullish continuation toward ₹7,000+.
This is a classic trend continuation setup for wave-based swing traders.
Stockstotrade

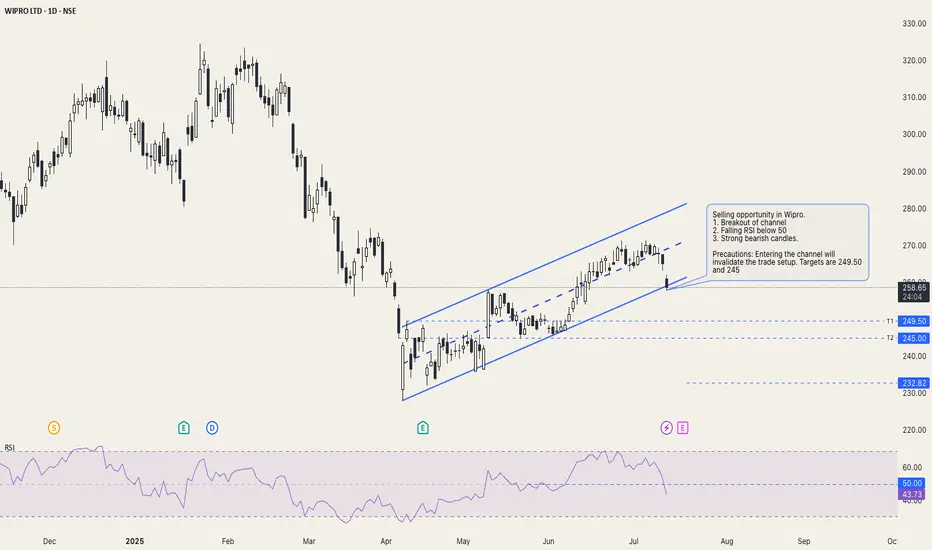
Channel breakout in Wipro: BearishSelling opportunity in Wipro.
1. Breakout of channel
2. Falling RSI below 50
3. Strong bearish candles.
Precautions: Entering the channel will invalidate the trade setup. Targets are 249.50 and 245
(ignore the 232 line)
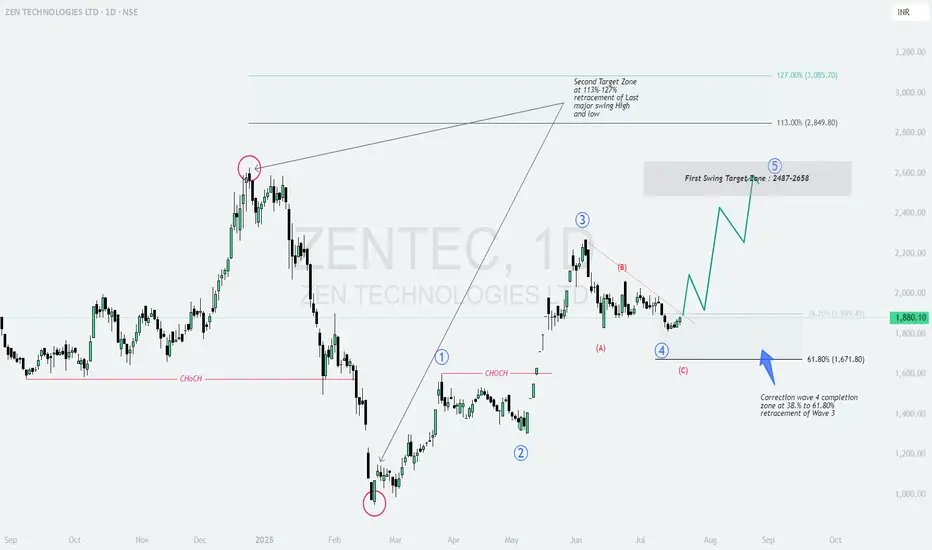
ZENTEC: Wave 4 Correction Complete – Ready for the Next wave?ZEN TECHNOLOGIES LTD (NSE: ZENTEC) – Daily Chart Analysis 🚀
Elliott Wave Structure | Fibonacci Retracement | Swing Targets
1. Why This Setup? 🤔
ZEN Technologies is showing a classic Elliott Wave structure, and the recent price action suggests a high-probability bullish reversal. Here’s why:
Wave 4 Correction Completed: The stock has retraced between the 38.2% (₹1,899) and 61.8% (₹1,671) Fibonacci levels of Wave 3, which is a textbook correction zone for Wave 4.
ABC Pattern: The correction unfolded as an ABC pattern, with the (C) leg finding support in the golden fib zone.
Change of Character (CHoCH): Multiple CHoCH points on the chart indicate a shift from bearish to bullish sentiment, suggesting that sellers are exhausted and buyers are stepping in. 🟢
2. Key Levels & Trade Plan 📊
Current Price: ₹1,880
Support Zone: ₹1,899–₹1,671 (38.2%–61.8% retracement of Wave 3) 🟢
First Swing Target Zone: ₹2,487–₹2,658 🟢
Second Target Zone: ₹2,849–₹3,085 (113%–127% extension of last major swing) 🟢
Why these targets?
The first target zone aligns with the projected completion of Wave 5, based on previous impulse waves.
The second target zone is calculated using the 113%–127% Fibonacci extension of the last major swing, a common area for extended moves in strong trends.
3. Risk Management 🛡️
Entry: Accumulate near current levels or on dips into the support zone. 🟢
Stop Loss: Daily close below ₹1,670 (61.8% retracement) to protect capital. 🔴
Targets:
1️⃣ First Target: ₹2,487–₹2,658 🟢
2️⃣ Second Target: ₹2,849–₹3,085 🟢
4. Technical Summary & Cautions 🟠
The completion of Wave 4 correction sets the stage for a potential Wave 5 rally .
Bullish momentum is likely to pick up above ₹1,900, with strong upside potential towards the target zones.
Caution: If price closes below ₹1,670 on a daily basis, the bullish setup is invalidated and further downside is possible. 🟠
Watch for confirmation candles and volume spikes for added conviction! 📈
Conclusion:
ZEN Technologies is offering a high-probability swing setup after a healthy correction. The risk/reward is attractive for positional traders, provided stops are respected. The technicals suggest a new uptrend could be starting, with clear targets and a logical stop loss. 🟢
Like & Follow for more setups! 👍✨
#ZENTEC #ElliottWave #SwingTrade #TechnicalAnalysis #TradingView #Stocks #NSE #Fibonacci #Breakout #StockMarket 🚀
HILTON : Reversal confirmed?
## 📘 \ HILTON METAL FORGING – Potential Reversal Setup Based on Elliott Wave Completion\
\ Timeframe:\ Daily
\ Structure:\ Completed 5-Wave Impulse (Bearish) → Recovery in Progress
\ Type:\ Swing Trade Setup | Wave Theory Based
---
### 🔍 \ 1. Context and Background:\
HILTON has completed a \ five-wave impulsive decline\ from highs of \~₹190 to a bottom near ₹50, signaling the end of a strong downtrend.
According to \ Elliott Wave Principles\ , after a completed 5-wave impulse, a corrective \ ABC structure\ (retracement) generally follows.
Current chart indicates that \ Wave 5 is complete\ and recovery is underway in the form of Wave A → B → C.
---
### 🔢 \ 2. Wave Count Overview:\
* \ Wave 1:\ Initial sharp decline
* \ Wave 2:\ Pullback to previous support
* \ Wave 3:\ Extended and steep fall
* \ Wave 4:\ Retracement to 50%-61.8% Fib zone (₹119.99–₹130.94)
* \ Wave 5:\ Final sell-off completing around ₹50–52 zone with capitulation
\ Note:\ Volume on Wave 5 bottom shows signs of exhaustion and early accumulation.
---
### 🧩 \ 3. Current Structure – Recovery Begins:\
* The chart marks the \ first rally without volume\ (Wave A)
* Followed by a correction forming \ Wave B (intermediate zone: ₹58–67)\
* Now tracking potential for Wave C upside, targeting key retracement zones
---
### 🎯 \ 4. Trade Levels and Projections:\
* \ Entry Zone:\ ₹58–67 (Wave B demand zone)
* \ First Target:\ ₹56–62 (gap-fill and prior resistance – conservative swing)
* \ Second Target:\ ₹132–142 (Extended retracement of Wave 4) – for positional traders
* \ Stop Loss:\ Below ₹56 (especially if the recovery wave fails or structure breaks)
---
### 🔍 \ 5. Technical Confluences:\
* \ Wave 4 retracement zone:\ ₹119.99–130.94 = 50–61.8% of Wave 3
* \ Extended retracement target:\ ₹132–142 (potential C-wave projection)
* \ Volume Analysis:\ Low volume rally followed by corrective dip shows early signs of base building
---
### ✅ \ 6. Strategic Notes:\
* \ This setup is ideal for swing or short-term positional traders\ aiming for 1:2+ RR
* Structure aligns with post-impulsive recovery behavior as per Elliott Wave
* \ Low-risk accumulation\ possible near ₹58–62 with defined SL
* Best trades come from structure + sentiment shift – both are visible here
---
### 📌 \ Conclusion:\
HILTON METAL appears to have \ completed its 5-wave downtrend\ and is entering a corrective phase.
The current \ Wave B zone (₹58–67)\ offers a good risk-managed opportunity to participate in the \ Wave C upside\ toward ₹132–142.
Traders must monitor price action and volume closely around the current level and protect downside with a stop below ₹56.

View on Larsen and Toubro (L&T) L&T current price: 3458 on 1/02/2025
The stock has taken support at 3407 but unable to cross 3630 after testing it twice, now this level is acting as Resistance, if fails to trade above this level we can see it trading a range of 3630-3407.If the stock sustains above 3630, we may upside move to 3800-3900.

BUY HINDCOPPERBuy hindcopper as it is oversold stock, making inverted head and shoulder also ema crossover giving a strong buy signal.

Coal India set to cross all time high If you look at the set up of COAL India. it looks very strong.
CMP 504. strop loss 498. target : 560.
RR: more than 1:10.
Why COAL India.?
During last month it has show nice rally from 480 to 520. and it has given nice pull back and now with positive momentum it is set to cross ATH. RR is unmatchable.

Exide Industries Have A Look Exide Industries Touch All Time High In a Month Of July And Cool Down and following a Trend line
After Following The Trendline . The Stock Given Us Breakout Of Trendline .
There My Point Of View , The Stock Have A more Potential to Touch Again AllTime High its Move in Percentage 18% Can Move After A Good Pull Back . 52 Week High Magnetic Setup Activate & Give Us Gain Of 17-18% from Breakout .
Please Look at In This Chart .
Thank You For Giving Time On My Post .

Cholafin view for Intraday 23rd September #CHOLAFIN
Cholafin view for Intraday 23rd September #CHOLAFIN
Buying may witness above 1615
Support area 1592-1600. Below ignoring buying momentum for intraday
Selling may witness below 1592
Resistance area 1610-1615
Above ignoring selling momentum for intraday
Charts for Educational purposes only.
Please follow strict stop loss and risk reward if you follow the level.
Thanks,

ZENSARTECHZensartech is moving after giving a reversal candle. Stock looks promising for a target of 650-750
NOTE: I'm not a SEBI REG. Study before investing.

IMAGCIAA World LTD (Range Breakout On WTF)IMAGCIAA World LTD has given a Range Breakout on Weekly time frame with good volume. The stock can possibly head towards 120, 150 levels in the coming few weeks. Stop loss could be placed at 76.25 (low of weekly closing).
Disclaimer: This post is for educational purpose, and not a recommendation. I am not a SEBI registered analyst. Investors must consult a financial advisor before making any investment.

SENSEX Intraday and weekly zones.I have marked some important zones to watch for your trades. You may crosscheck with your trading setup. MINT MONEY 💚🚀

MPHASIS (Weekly Breakout Candidate)MPHASIS (CMP: 2,873) has given a breakout on weekly chart. The stock has formed a cup and handle pattern on weekly chart. Possible upside from current level remains for 3,000, 3,200, 3,500. Also increasing volumes can be seen on weekly chart. #MPHASIS
Disclaimer: This post is for educational purpose, and not a recommendation. I am not a SEBI registered analyst. Investors must consult a financial advisor before making any investment.

VMARTThe stock is giving a solid comeback from the bear grip. Enter with a small qty
NOTE: I'm not a SEBI REG. Study before investing.

WHIRLPOOL OF INDIAWhirlpool is making a bullish divergence and after a big beat results stock may rise.
1450-1555-1700-2000

Falling wedge trading set up1. Beautiful falling wedge with 5 months consolidation breakout
2. Clean & crisp structure for its continuation of uptrend
3. 1:4+ RR minimum

PATELENG: QIP done! What's next?PATELENG fell 8-10% today due to QIP which was near 59 and now the price is trading at 58. Seems like it is in a Flag pattern and target should be 300 on a long term basis.
Short term targets should be: 80-100-105-120-135-153

INDIANHUME (Weekly BO)Stock rallying and made a successful POLE & Flag BO and expected to double from this point (299). TARGETS: 415-505-581-610
NOTE: I'm not a SEBI REG. Study before investing.

JKIL (Asc Triangle Breakout)J Kumar Infraproject Ltd (JKIL) has formed an Asc triangle pattern on DTF. The stock could head towards 800, 820 in the coming few days. Also, good volumes can be seen on the DTF. Stop loss can be placed at the low of Friday's closing candle which is 644. Support at 715.
Disclaimer: I am not a SEBI registered analyst. All the stocks are for educational purposes. Investors must consult a financial advisor before making any investment. It is not a buy or sell recommendation.

LONG setup in REC Ltd PSUAn On Neck Chart Pattern Breakout happened on the weekly Time frame of NSE:RECLTD
Price Action is well supported by the volume.
The stock is currently in uptrend making higher highs and higher lows.
One can add this stock into their stocks to buy list.
Initiate the long trade only according to the levels mentioned.
Stop loss will be on weekly closing basis.
Trend Analysis :- UP Trend
Chart Pattern :- On-Neck Chart Pattern
Technical Indicator :- Positive MACD Crossover

Bullish Flag pattern in SANGHVI MOVERSA Weekly Bullish Flag and Pole pattern is visible on the charts of
Flag and Pole pattern is a bullish continuation pattern and it is visible in charts after a meaningful appreciation in the NSE:SANGHVIMOV
MACD gave Positive crossover on Daily chart , Monthly chart and on weekly chart, it is on verge of giving positive breakout So, expecting the momentum to continue.
One can look to create a fresh position in the scrip near Rs. 740-760 levels with the stoploss of Rs. 620.55 on weekly closing basis. The 1st target will be 840.10 , 2nd target will be 928.10, 3rd target will be 1008.20, 4th target will be 1096.65 and fifth target will be 1184.55.

Electrosteel Cast: Flag BO on WTF for 15 to 18% TGT an MoreA bullish Flag and Poleon Daily chart of NSE:ELECTCAST is emerged with Very good volume.
Long position can be created in the scrip as per the price levels mentioned on the chart.
If you agree with the idea then hit the airplane icon and don't forget to follow me to all the latest updates.
The Risk Reqard Ration is 1:2.5 or more.
Exit the position if the stop loss is triggered on WCB.
I AM EAGERLY WAITING FOR YOUR COMMENTS ON THE STUDY...
Disclaimer: Content shared is for information and education purposes only and should not be treated as investment or trading advice. Please do your own analysis or take independent professional financial advice before making any investments based on your own personal circumstances. Investment in securities are subject to market risks, please carry out your due diligence before investing. And last but not the least, past performance is not indicative of future returns.

BIGBULL bReAkOuT A Weekly Bullish Flag and Pole pattern is visible on the charts of NSE:CAPLIPOINT
Flag and Pole pattern is a bullish continuation pattern and it is visible in charts after a meaningful apprication in the NSE:CAPLIPOINT
MACD gave Positive crossover on Daily chart and Monthly chart and weekly chart, it is on verge of giving positive breakout So, expecting the momentum to continue.
One can look to create a fresh position in the scrip near Rs. 1190 levels with the stoploss of Rs. 1090.45 on weekly closing basis. The 1st target will be 1293.10 , 2nd target will be 1397.10 and 3rd target will be 1499.20.
