Diwali Muhurat Pick - VMartDiwali Pick -1 -- VMart ::
Multiyear Breakout in progress and currently consolidating
Breaking out 4580 levels can fetch 10 to 20 percent possible upmove
Next report date
—
Report period
—
EPS estimate
—
Revenue estimate
—
−27.85 INR
−967.60 M INR
27.86 B INR
9.03 M
About VMART RETAIL LTD
Sector
Industry
CEO
Lalit Madangopal Agarwal
Website
Headquarters
Gurgaon
Founded
2002
ISIN
INE665J01013
FIGI
BBG0037S5RF3
V-Mart Retail Ltd. engages in the retails of readymade garments and accessories in India. It operates through the following segments: Retail Trade and Digital Marketplace segments. The Retail Trade segment includes domestic sale to customer at stores. The Digital Marketplace segment includes commission and other income by providing limeroad platform to vendors. The company offers fashion garments, home furnishings, general merchandise, toys, tableware, utensils, and other home utility items. The company was founded on July 24, 2002 and is headquartered in Gurgaon, India.

VMART GOOD FOR SWING VMART good above 4500 on Closing Basis.
Momentum indicators are Bullish.
Taken support From Trendline on Daily Time Frame.
Weak Below 4200 on CLB.
Ready For Upside 5000-5500+
For Educational Purpose only.

Flag and Pole Pattern in V-mart RetailNSE:VMART a Flag and Pole pattern is forming in V-mart Retail, it is in an Uptrend Currently and High Possibility that it will break the pattern and continue the upward trend.
If a Bullish flag pattern Breaks Out above 4500, the stock may move toward the pattern target after the breakout which i

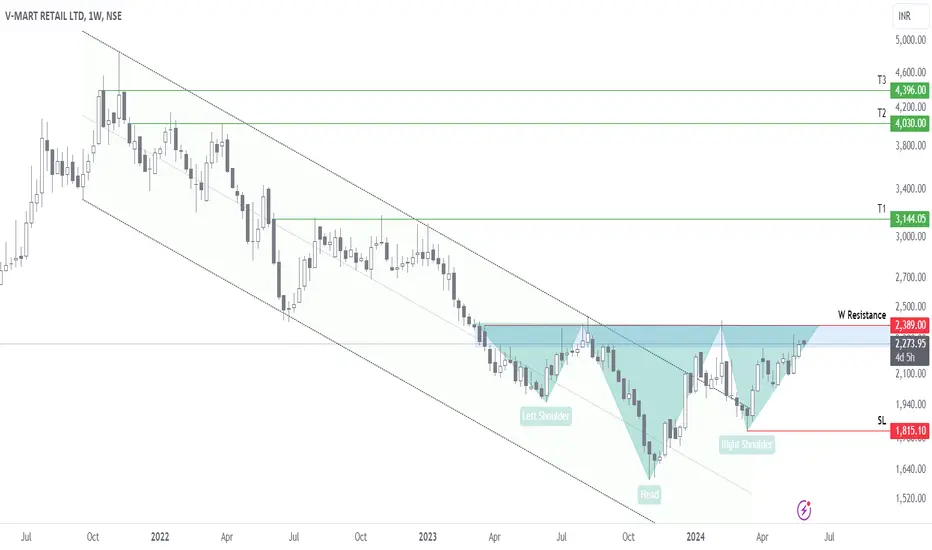
VMART Long IDEAVMART broke channel and now making Invested H&S.
It is in accumulation stage, good time to take pilot postion for Long term Investors.
Targets are given in chart
VMart - Breakout - Crucial levelsVMart : Long term
Weekly Flag Breakout
At resistance zone, sustaining 4500 levels would take this to much newer heights

VIEW ON VMART RETAILRecord high closing
In spite of market today's fall stock has closed in green
If it gets at lower levels then accumulate it
Target 4200
Stop loss 3910
I am just representing my views
For educational purpose only.

Short Term Trading Idea in V-Mart Retail for 15% UpsideHi,
NSE:VMART has given a Bullish Flag Breakout on Daily charts with very good volume.
MACD is also on the bullish side on Daily, Weekly and Monthly time frames. RSI is also on the bullish side on daily, weekly and monthly time frames.
In the current market scenario, I am expecting that the b

VMARTThe stock is giving a solid comeback from the bear grip. Enter with a small qty
NOTE: I'm not a SEBI REG. Study before investing.


VMART - good above 2400 VMART - can this be the new age DMART ?
Well that we will learn with time, however looking at other consumption stocks
this stock may see traction post budget.
One can enter between 2400 to 2600 and average up on its way ahead.
Strict Stop Loss of 2350
It also has given multiyear RSI breakout.
Di

See all ideas
An aggregate view of professional's ratings.
Displays a symbol's price movements over previous years to identify recurring trends.
Frequently Asked Questions
The current price of VMART is 3,934.30 INR — it has increased by 0.01% in the past 24 hours. Watch VMART RETAIL LTD stock price performance more closely on the chart.
Depending on the exchange, the stock ticker may vary. For instance, on NSE exchange VMART RETAIL LTD stocks are traded under the ticker VMART.
VMART stock has fallen by −2.74% compared to the previous week, the month change is a −1.64% fall, over the last year VMART RETAIL LTD has showed a 122.28% increase.
We've gathered analysts' opinions on VMART RETAIL LTD future price: according to them, VMART price has a max estimate of 6,544.00 INR and a min estimate of 2,900.00 INR. Watch VMART chart and read a more detailed VMART RETAIL LTD stock forecast: see what analysts think of VMART RETAIL LTD and suggest that you do with its stocks.
VMART reached its all-time high on Nov 11, 2021 with the price of 4,848.80 INR, and its all-time low was 103.25 INR and was reached on Jun 10, 2013. View more price dynamics on VMART chart.
See other stocks reaching their highest and lowest prices.
See other stocks reaching their highest and lowest prices.
VMART stock is 3.15% volatile and has beta coefficient of 1.00. Track VMART RETAIL LTD stock price on the chart and check out the list of the most volatile stocks — is VMART RETAIL LTD there?
Today VMART RETAIL LTD has the market capitalization of 77.87 B, it has decreased by −0.26% over the last week.
Yes, you can track VMART RETAIL LTD financials in yearly and quarterly reports right on TradingView.
VMART RETAIL LTD is going to release the next earnings report on Feb 11, 2025. Keep track of upcoming events with our Earnings Calendar.
VMART earnings for the last quarter are −28.60 INR per share, whereas the estimation was −19.07 INR resulting in a −49.93% surprise. The estimated earnings for the next quarter are 26.70 INR per share. See more details about VMART RETAIL LTD earnings.
VMART RETAIL LTD revenue for the last quarter amounts to 6.61 B INR, despite the estimated figure of 6.58 B INR. In the next quarter, revenue is expected to reach 10.75 B INR.
VMART net income for the last quarter is −565.10 M INR, while the quarter before that showed 121.40 M INR of net income which accounts for −565.49% change. Track more VMART RETAIL LTD financial stats to get the full picture.
As of Dec 11, 2024, the company has 10.94 K employees. See our rating of the largest employees — is VMART RETAIL LTD on this list?
EBITDA measures a company's operating performance, its growth signifies an improvement in the efficiency of a company. VMART RETAIL LTD EBITDA is 2.98 B INR, and current EBITDA margin is 7.95%. See more stats in VMART RETAIL LTD financial statements.
Like other stocks, VMART shares are traded on stock exchanges, e.g. Nasdaq, Nyse, Euronext, and the easiest way to buy them is through an online stock broker. To do this, you need to open an account and follow a broker's procedures, then start trading. You can trade VMART RETAIL LTD stock right from TradingView charts — choose your broker and connect to your account.
Investing in stocks requires a comprehensive research: you should carefully study all the available data, e.g. company's financials, related news, and its technical analysis. So VMART RETAIL LTD technincal analysis shows the neutral today, and its 1 week rating is buy. Since market conditions are prone to changes, it's worth looking a bit further into the future — according to the 1 month rating VMART RETAIL LTD stock shows the buy signal. See more of VMART RETAIL LTD technicals for a more comprehensive analysis.
If you're still not sure, try looking for inspiration in our curated watchlists.
If you're still not sure, try looking for inspiration in our curated watchlists.