How to Read Weak Pullbacks: Hindustan Unilever Case StudyMost traders love chasing green candles. Professionals study pullbacks — because they reveal who’s really in control.
🔎 What the Chart Shows (HUL)
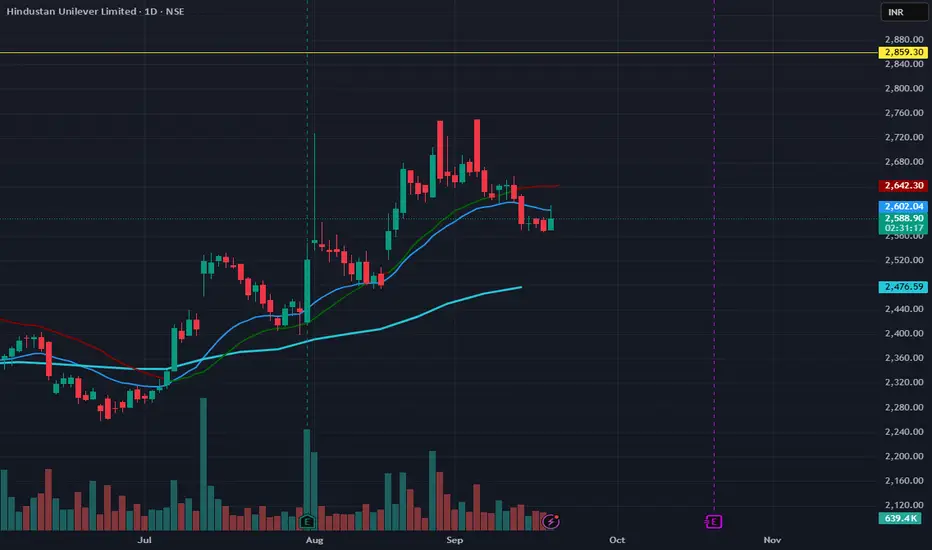
Strong run-up July–Aug → clear trend.
Recent pullback into 2600 zone.
20 & 50 MA curling sideways → buyers losing some steam.
200 MA still rising → long-term trend intact.
✅ How to Use This
Weak pullback (low volume, shallow retrace): Often resumes trend.
Strong pullback (heavy selling, breaks 50MA): Trend shift risk.
Here → buyers defending near ₹2,590–2,600. A bounce above ₹2,642 could confirm strength.
👉 Lesson: Don’t fear pullbacks — read them. They tell you if trend is resting or reversing.
💡 Save this chart. Follow for daily technical education with trader psychology.