LT forming a expanding channel BUY signals at 878I WILL LOOK AT BUYING OPPORTUNITIES AT LT because :
It is forming a kind of expanding pattern .
It has been taking the support of the lower trend line .
Now the price is again at its support level so will be looking at buying opportunities.
Entry : 878
Target : 1081
Stop loss : 840
Stocktowatch

NTPC Buy signal at 82 I will buy NTPC because :
It has been taking support at the trend line .
So will be looking at buying opportunities.
Book profit once it touches the resistance.
Entry : 82
Target : 101
Stop loss : 80

SHREECEM Buy signal at 21198I will go LONG on SHREECEM because:
The price is forming a Chanel or Rectangle Pattern .
The price is also under Support/Resistance zone.
It has touched the support (lower end of rectangle ) and may reach the resistance zone (upper end of rectangle ) .
Target would be the Resistance area . Book profit when it reaches the resistance zone .
Entry - 21198
Target - 23350
Stop loss - 20500

GODREJIND forming a expanding pattern , Buy at 376I WILL LOOK AT BUYING OPPORTUNITIES AT GODREJIND because :
It is forming a kind of expanding pattern .
It has been taking the support of the lower trend line .
Now the price is again at its support level so will be looking at buying opportunities.
Entry : 376
Target : 418/447/489
Stop loss : 344

MGL at it major support, Buy at 778 long term MGL has been taking support between the prices 743 and 766.
The price range between 743 and 766 has been acting a major support
for MGL , The price is again at its support level.
So will be looking at going long on MGL.
Entry : 778
Target : 957/1094/1200
Stop loss : 665


BHARAT DYNAMICS : ALGO BUY SIGNALHOW TO FOLLOW ALGO SIGNAL:
Deciding buy/sell
1.Strictly use only on 1 hour time frame.
2.Wait for a ‘X’ sign before mind make up. A red ‘X’ means look for selling opportunity , a green ‘X’ means look for buying opportunity.
Taking a position:
3.Wait for an arrow before entering into any position. A red arrow on upside of a bar pointing downward means open short position. A green arrow below the bar pointing upward means open buy position.
4.NOTE: Only after the the signalling of X , look for arrow. Do not buy/sell if you see any arrow before the signal of X.
5.STOP LOSS should be the most recent swing high/low or most recent STRONG CANDLE’S high/low.
While maintaining the position :
6.The small triangles after the each bar completion tells you to hold the position. The red triangles appearing upside on the bar tells you to hold the short position, whereas the green triangles appearing below the bars tells you to hold the long position.
Exiting the position:
7.After you create a buy position , if you see a green arrow above any bar pointing downward, then you should either book partially/leave the position for sometime. You will get another signal to re-enter.
8.Similarly, after you create a sell position , if you see a red arrow below any bar pointing upward, then you should either book partially/leave the position for sometime. You will get another signal to re-enter.
9.While being in position if you see any X signal which is opposite of your trade , then leave your position immediately.
10.When you see a big red circle dot then you must exit all your short positions. Contrary , when you see a big green circle dot , you must exit all your long positions. And then wait for a X-signal.
No Trading Zone:
11.When you get frequent X-signals in green-red-green-red & that too very close, then its means that stock is going to form a range. One should wait for the range break & move away to another stock. (THIS IS WHERE YOU WILL REQUIRE A PRACTICE TO IDENTIFY THE RANGE)

GODREJPROP forming a expanding channel BUY signals at 854I WILL LOOK AT BUYING OPPORTUNITIES AT GODREJPROP because :
It is forming a continuous channel pattern.
It is kind of expanding pattern .
It has been taking the support of the lower trend line .
Now the price is again at its support level so will be looking at buying opportunities.
Entry : 854
Target : 998
Stop loss : 817

AXISBANK Buy signal at 442 support at the trend lineI will buy AXISBANK because :
It has been taking support at the trend line .
It has touched the trend line 4 times and has not been able to break it.
So will be looking at buying opportunities.
Entry : 442
Target : 535
Stop loss : 417

DMART Buy signal at 1977 support at the trend lineI will buy DMART because :
It has been taking support at the trend line .
So will be looking at buying opportunities.
Entry : 1977
Target : 2236/2445
Stop loss : 1893

BUY signal COROMANDEL at 723 , Rectangle patternI will go LONG on COROMANDEL because:
The price is forming a Chanel or Rectangle Pattern .
The price is also under Support/Resistance zone.
It has touched the support (lower end of rectangle ) and may reach the resistance zone (upper end of rectangle ) .
Target would be the Resistance area . Book profit when it reaches the resistance zone .
Entry - 723
Target - 824
Stop loss - 697

HDFC SHORT at 1957 Good pinbarGOOD PIN BAR IN 1 day GOOD TIME TO SHORT
Entry - 1957
Target - 1880/1764
Stop loss - 2018

BUY signal HINDPETRO , Rectangle pattern I will go LONG on HINDPETRO because:
The price is forming a Chanel or Rectangle Pattern .
The price is also under Support/Resistance zone.
It has touched the support (lower end of rectangle ) and may reach the resistance zone (upper end of rectangle ) .
Target would be the Resistance area . Book profit when it reaches the resistance zone .
Entry - 175
Target - 240
Stop loss - 163

BPCL Buy signal at 345 support at the trend lineI will buy BPCL because :
It has been taking support at the trend line .
It has touched the trend line 2 times and has not been able to break it.
So will be looking at buying opportunities.
Entry : 345
Target : 442/490
Stop loss : 327

NAM_INDIA Buy signal at 262 support at the trend lineI will buy NAM_INDIA because :
It has been taking support at the trend line .
So will be looking at buying opportunities.
Entry : 262
Target : 327
Stop loss : 248


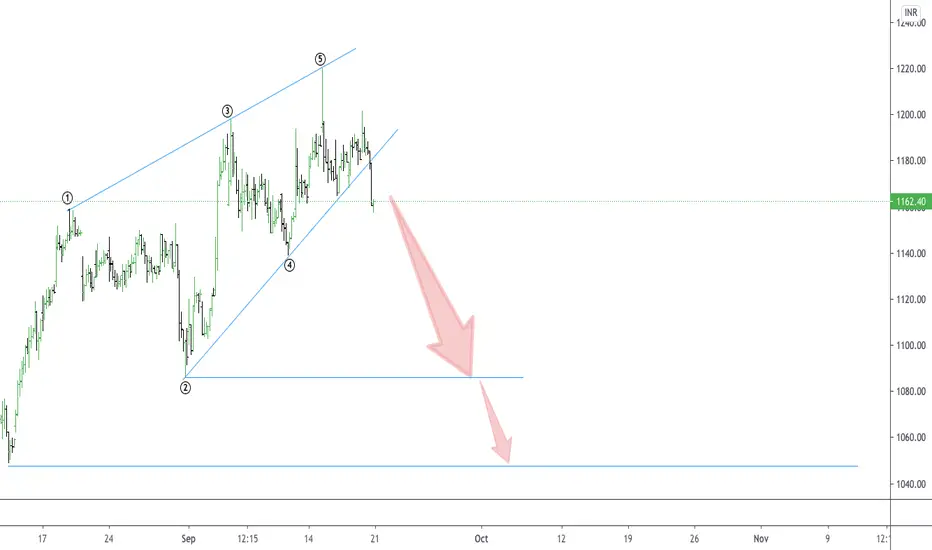
TITAN : CASE OF ENDING DIAGONALThis is the most common diagonal that can be found out at the ending of a main trend or main correction. It consists of all the waves 1-2-3-4-5 in a single or multiple zigzags. They can be found placed at 5th wave of an impulse wave or can been seen as a wave ‘C’ of a corrective waves zigzags or flat. After the termination of the ending diagonal, a swift & a sharp reversal takes place which bring the prices back to the level from where the diagonal began.
Here in the stock of TITAN, this ending diagonal is placed as a wave-C of a corrective move.
As you can see in the chart, this pattern looks like an ending diagonal having wave-1 wave-2 wave-3 wave-4 & wave-5 . Each of these five waves are having an internal structure of three waves. So as per the wave analysis we can say the stock price of TITAN are going to fall . It has been seen that the target level of ending diagonal wave is the origin of the diagonal or the wave 2. So one should see a selling opportunity in this stock & look for the target zone as mentioned in the chart.
ITC- a preparatory fall is coming soonKeep stop loss of 210 on closing basis and short the stock ITC for a target range of 180 & 160.


TATA MOTORS - Dhishkiyaoon idea !Coiling phenomenon taking place in TATA MOTORS. Take the trade in the respected direction of the Breakout.

Bullish Godrej PropertiesAscending Triangle or a bullish triangular wave structure. Buy for a target of 1000-1010.

McDOWELLS : range playoutBuy in the range of 600-590 , keep a stop loss below 580 for a target of 625/640's

Grasim-Good Buying opportunity here above Green Line
Grasim-Good Buying opportunity here - Easy Intraday Trade if sustains above 614
Target will be around 618-620
