SBICARDS : Everyone Gave Up… That’s When Bases Are Born📊 SBI Cards & Payment Services Limited – Weekly Technical Analysis
Timeframe: Weekly
CMP: ~₹771
Trend Context: Larger base formation after extended correction
Structure: ABC corrective wave + potential Cup & Handle completion
🔍 Big Picture Structure (What’s Really Happening)
SBI Cards earlier witnessed strong selling from an extended retracement / supply zone (113%–127%), which is a classic area where:
Long-term holders book profits
Institutions reduce exposure
Late breakout buyers get trapped
This led to a controlled ABC correction, not a breakdown of the long-term structure.
📘 Markets correct to reset positioning, not to punish everyone.
📐 Why the Marked Levels Matter (Trading Psychology Explained)
🟦 ABC Completion / Demand Zone: ₹720 – ₹770
This is the most important zone on the chart.
🧠 Why price can react here:
Sellers from higher levels have largely exited
Value buyers step in near prior accumulation areas
Shorts start covering as downside momentum fades
👉 This zone represents fear exhaustion, where selling pressure typically dries up.
📌 It also aligns with a potential “handle” completion of a larger Cup & Handle pattern.
🔴 Invalidation / Risk Level: ₹690 (Day Close Below)
Breakdown below this level damages base structure
Psychology shifts from “buying dips” to “capital protection”
Confidence erosion can invite fresh selling
📉 Below ₹690, downside risk increases sharply.
🔑 Upside Levels & Targets (Why They Matter)
🟠 First Target Zone: ₹990 – ₹1,020
Prior supply memory
Trapped traders look to exit here
Profit booking likely on first approach
📘 Markets often hesitate where pain was previously created.
🟢 Second Target: ₹1,127
Larger pattern projection
Psychological round-number magnet
Momentum & FOMO participation zone
📈 Acceptance above ₹1,020 can accelerate price toward this zone.
🟢 Bullish Scenario (Primary Probability)
If price:
Holds above ₹720–770
Forms a base or higher low on weekly chart
Then:
Gradual recovery toward ₹990–1,020
Break & sustain → ₹1,127
Confirms base-to-expansion transition
📘 Strong bases often look boring before they explode.
🔴 Bearish Risk Scenario
If price:
Closes below ₹690
Then:
Base structure weakens
Buyers step aside
Market searches for deeper liquidity zones
📉 This reflects loss of confidence, not just technical damage.
🎓 Educational Takeaways
Corrections end where fear peaks, not where hope feels strong
Fibonacci & pattern zones work because crowds react together
Bases form quietly; breakouts are loud
The best opportunities feel uncomfortable at entry
🧠 Emotion Map of This Chart
Zone Dominant Emotion
Highs Greed & Euphoria
Decline Denial
Base zone Fear vs Opportunity
Breakout Relief & Momentum
Targets FOMO
📘 Charts are stories of crowd psychology, not just price.
🔮 Price Outlook (Educational Projection)
Above ₹770: Base confirmation improves
Above ₹1,020: Momentum revival
Upside targets: ₹1,127
Below ₹690: Caution, structure weakens
🧾 Conclusion
SBI Cards appears to be transitioning from correction to base formation.
The ₹720–770 zone is a decision area that can decide whether the stock moves into a new accumulation phase or slips into deeper weakness.
📌 Big moves are born from boring bases.
⚠️ Disclaimer
This analysis is for educational purposes only.
I am not a SEBI registered analyst. Markets involve risk, and I can be wrong.
Please consult your financial advisor before making any trading or investment decisions.
Stocktrading

Update on NASDAQ BULLISH BIAS IDEA.This is how market respects the zone and levels.
I don't share signals and dreams , I share clarity and ideas for you to focus on.

Mastek 1Day Trend line Breakout Mastek has given a trendline breakout on the daily timeframe, indicating a potential shift in trend. Price has moved above the falling trendline with improving structure, suggesting fresh buying interest. If the breakout sustains, the stock may see further upside in the near term. A retest of the breakout zone can act as support, while failure to hold above the trendline may lead to consolidation. Traders should watch for follow-through and volume confirmation.

Best Method to Trade Large Cap Stocks in 2026 ?Hello everyone, in this video I am explaining how to identify strategy locations - where exactly you need to look on the charts to create a better strategy in terms of Large cap stocks .
However the Mid and small ones do not follow these rules . I hope I was able to share my experience .
Charts used in the video explanation are older than 3 months

Resistance to Flip + Equilibrium Mastery: Pure Price ActionLeft Chart (Monthly TF):
- Classic resistance-turned-support flip. Price tested this level multiple times historically (data >3 months old), holding firm as dynamic support. Proof that prior barriers evolve with pure price behaviour.
Right Chart (Weekly TF):
- Equilibrium at 0.5: Stock has danced around this pivot, building multiple resistances above/below—trading in balance like clockwork.
- Parallel Channel Magic( Red lines ): Counter-trendline + parallel upper line forms a textbook channel, showcasing how price respects geometry over time.
- Respected Demand Zone (Green): Multiple bounces here confirm its strength—demand alive and kicking historically.
Disclaimer: This is for educational purposes only, showcasing historical price action (>3 months old). Not financial advice, trade recommendations, or predictions. Always DYOR and trade at your own risk.

DIXON (Weekly) — Wave 4 Bottom Forming?Elliott Wave + Fibonacci Confluence 📈
The weekly chart of Dixon Technologies (India) Ltd. is unfolding a textbook Elliott Wave structure.
After a powerful Wave 3 impulse, the stock is currently digesting gains through a complex Wave 4 correction.
Price is now approaching a high-probability demand zone, where Fibonacci retracement meets Elliott Wave theory — often a fertile ground for trend resumption.
Let’s decode the structure and map the strategy ahead. 👇
📉 Technical Structure Breakdown
🔹 1. Elliott Wave Context (Weekly)
Wave 3 (Impulse Peak):
Strong vertical rally completing above ₹20,000, reflecting momentum expansion.
Wave 4 (Ongoing Correction):
A corrective, time-consuming phase — aligning well with the Principle of Alternation.
Internal Structure of Wave 4:
Wave (a): Sharp decline toward ₹12,000
Wave (b): Relief rally / dead-cat bounce into prior resistance
Wave (c): Final corrective leg now testing the Fresh Demand Generation Zone
📌 Key Demand Zone: ₹11,525 – ₹10,925
🔹 2. Fibonacci Confluence (Golden Zone)
The highlighted zone on the chart marks the probable Wave-4 completion area, aligning with:
0.382–0.5 Fibonacci retracement of the entire Wave-3 move
A classic Wave-4 retracement depth, which is typically shallow compared to Wave-2
This confluence strengthens the probability of structural support.
🔹 3. Price Action & Volume Clues
Price is attempting to stabilize and bounce from the lower end of the retracement band
Volume expansion at lower levels suggests:
Short covering by late sellers
Early accumulation by informed participants
📊 This behavior is commonly seen near intermediate cycle bottoms.
🎯 Trading & Investment Strategy
🛒 Entry Plan
Aggressive Entry:
Partial position around ₹12,165, with strict risk control
Conservative Entry:
Wait for a weekly reversal candle or strong demand reaction inside
₹10,925 – ₹11,525
🏁 Upside Targets
🎯 Short-Term: ₹15,369 (Previous structure resistance)
🎯 Mid-Term: ₹17,566 (Wave-(b) high / supply zone)
🚀 Long-Term (Wave-5 Projection):
Retest of ATHs with potential extension toward ₹22,000+, if impulse resumes
🛡️ Risk Management
Swing / Mid-Term SL: ₹10,915 (Below demand zone)
Hard Invalidation (Wave Count): ₹8,851
A break below this level invalidates the bullish Elliott Wave structure
⚠️ Position sizing is critical — Wave-4 trades require patience and discipline.
📚 Educational Insights (For Traders)
Principle of Alternation:
Wave-2 was sharp and deep → Wave-4 is expected to be complex / sideways
Why 0.382 Matters:
Wave-4 corrections often terminate near 38.2% retracement of Wave-3
Demand Generation Zones:
Areas where price consolidated before a breakout often act as magnets during corrections
💡 Final View
DIXON remains structurally bullish on the higher timeframe.
While the current correction feels uncomfortable, it is healthy and necessary within a long-term uptrend.
📌 The ₹11k–₹12k zone is a patience zone, where Wave-5 preparation may be underway.
➡️ Question for traders:
Is Wave-4 already complete, or do we see one final flush toward ₹10,900 before lift off?
Share your thoughts below 👇
⚠️ Disclaimer
This analysis is for educational purposes only.
I am not a SEBI registered analyst.
Markets are uncertain, and I may be wrong — please manage risk accordingly.

LTTS : Near Key Support | Trend Continuation WatchTimeframe: Daily
Trend Context: Corrective phase nearing completion
Current Price Zone: ~4,380
🔍 Market Structure & Technical Observations
Elliott Wave Perspective (Educational View):
The stock appears to be completing a corrective Wave-C near the 4,360–4,390 zone.
This zone aligns with prior demand and acts as a potential reversal pocket.
If Wave-C holds, the next impulsive leg (Wave-5) can begin.
Moving Average Insight:
Price has pulled back toward the short-term moving average, often seen near corrective endings.
Sustaining above this base improves odds of a trend resumption.
Support & Risk Zone:
Critical support: 4,360–4,390
Invalidation level: Daily close below 4,290
A close below this would indicate deeper correction, not accumulation.
Volume Behavior (Contextual):
No panic volume seen during decline, suggesting controlled profit booking, not distribution.
🎯 Trade Strategies
🟢 1. Swing Trading Strategy (Cash / Positional)
Buy Zone: 4,360–4,420 (on stabilization / reversal candle)
Stop Loss: Daily close below 4,290
Upside Targets:
Target 1: 4,770–4,830 (Major supply / F&O target zone)
Target 2: 5,120 (Swing projection)
📌 This setup offers a favorable Risk–Reward if price respects the Wave-C base.
🟡 2. F&O / Options Strategy (Educational)
Prefer bull call spreads or call buying only after confirmation.
Ideal confirmation:
Strong close above 4,480–4,500
OR bullish structure on lower timeframe from support
Avoid aggressive naked calls below 4,360, as volatility expansion works both ways.
🎓 Educational Notes (Why This Zone Matters)
Corrections often end where:
Prior breakout occurred
Fibonacci retracement clusters
Market sentiment turns pessimistic
The 4,360–4,390 zone ticks multiple boxes → making it a decision zone, not blind buy.
⚠️ Risk Management Guidelines
Do not average blindly below support.
Size positions assuming stop loss will be hit.
Options traders must factor in time decay — direction alone is not enough.
🧾 Summary & Conclusion
LTTS is currently at a make-or-break zone.
If the 4,360–4,390 support holds, the stock has the potential to resume its primary uptrend toward 4,830 and 5,120 in the coming weeks.
Failure to hold 4,290 on daily closing basis invalidates the bullish structure.
Disclaimer:
This analysis is for educational purposes only. I am not a SEBI registered analyst.
Markets are uncertain, and I may be wrong — please manage risk responsibly.

Learn a NEW Trading Strategy before 2026 StartsI make educational content videos for swing trading - in this video I am showcasing a new strategy with market structure - trigger points and activation .
Charts used are 3 months or older for Backtesting only
Happy New Year to everyone .

Price action understanding that will change the way you tradeI make educational content videos for swing trading . In this video I have used concepts like Trendlines, Counter trendlines, zones, Support and Resistance, Market fall, Targets and Exit plan for any trade setup and most importantly use of lines with multi time frame analysis .
Charts used are 3 months or older

HINDUNILVR: Smart Money Accumulation Zone After CHoCH?📘 HINDUNILVR (HUL) — Technical Analysis | Structure Shift & Golden Retracement Setup
(Timeframe: Daily)
HINDUNILVR is currently trading around ₹2,265 after a prolonged corrective phase.
The chart reflects a Change of Character (CHoCH) followed by a controlled retracement into a high-probability demand zone, where the next directional move is likely to emerge.
🔍 Market Structure & Price Action
The stock previously witnessed a strong bullish extension, reaching the 113%–128% Fibonacci extension zone, indicating an overextended move.
Post extension, price showed loss of bullish momentum, leading to a CHoCH — a clear signal of shifting market control.
CHoCH highlights early trend transition and often leads to range-bound or corrective price action, rather than an immediate trend reversal.
📌 CHoCH helps traders prepare for structural transitions before confirmation from higher highs.
📐 Fibonacci & Wave Context
The decline from point A to B appears corrective, not impulsive.
Price has now entered the Golden Retracement Zone (50%–78%) of Wave A.
This zone is typically where Wave B or Wave 2 attempts to develop.
Institutional participants often accumulate positions here due to favorable risk–reward.
📌 Failure to hold this zone often results in a deeper correction or trend reversal.
🎯 Key Levels from the Chart
Major Demand Zone: ₹2,230 – ₹2,200
Invalidation Level: Day close below ₹2,200
First Target: ~₹2,630 (≈ 78% retracement of Wave AB)
Second Target: ₹2,826 – ₹2,888
🧭 Trading Strategy (Swing / Positional)
Look for long opportunities only inside the ₹2,230–₹2,200 zone.
Prefer confirmation signals such as:
– Bullish rejection wicks
– Higher-low formation
– Minor CHoCH on lower timeframes
Avoid aggressive entries without confirmation.
🛑 Risk Management
Strict stop loss: Day close below ₹2,200
A close below this level indicates weak demand and opens the risk of extended downside correction.
Partial profit booking recommended near Target 1.
Trail stop aggressively if price sustains above ₹2,630.
📚 Educational Notes
Golden Retracement (50%–78%) is where institutions seek value-based entries.
CHoCH ≠ Trend Reversal — it signals momentum loss, not instant bearishness.
Confirmation always comes from structure + demand holding, not prediction.
🔮 Probable Scenarios
Bullish Case:
Holding above ₹2,200 → Base formation → Gradual recovery toward ₹2,630 → ₹2,826–2,888.
Bearish Case:
Day close below ₹2,200 → Demand failure → Deeper corrective phase.
📌 Conclusion
HINDUNILVR is positioned at a critical inflection zone.
Risk is clearly defined, while upside potential remains asymmetric.
This is a wait-for-confirmation accumulation setup, not a chase trade.
⚠ DISCLAIMER
I am not a SEBI-registered analyst.
This analysis is for educational purposes only and should not be considered investment advice.
Always use your own analysis and risk management.

PEL : Golden Retracement • Demand Reaction • Risk-Defined Trade📊 PRIMAL ENTERPRISES | 2H STRUCTURE-BASED SWING SETUP
Golden Retracement | Demand Reaction | Risk-Defined Trade
📌 Chart Context & Market Structure
Price has completed a strong impulsive decline from the prior swing high and is now reacting from the Golden Retracement Zone (Fib 50%–78%), which historically acts as a decision area between trend continuation and deeper correction.
This zone also overlaps with a higher timeframe demand pocket, increasing its technical significance.
Key observations from the chart:
Strong bearish impulse followed by slowing downside momentum
Price testing Fib 50%–78% retracement → value re-assessment zone
Clear invalidation level marked via hourly close below demand
🔍 Why This Zone Matters (Educational Insight)
📌 The golden retracement zone represents an area where:
Smart money evaluates whether the prior trend is still valid
Late sellers get absorbed by institutional demand
Failed demand here often leads to accelerated downside due to liquidity vacuum
If buyers defend this zone, price usually transitions into a corrective → impulsive recovery.
If demand fails, price seeks the next high-liquidity support below.
📈 Bullish Projection (Primary Scenario)
If price:
Holds above the golden retracement zone
Forms higher lows on lower timeframes
Shows acceptance above the immediate resistance
➡️ Expect a structural recovery phase.
Upside Path (Projection):
Near-term resistance breakout → momentum pickup
Sustained move above 1,237 confirms strength
Swing expansion toward 1,274 – 1,289 zone
This aligns with a mean-reversion + trend resumption structure.
📉 Bearish Risk Scenario (If Demand Fails)
If price:
Fails to attract buying interest within Fib 50%–78%
Breaks demand with an hourly close below 1,082
📌 It signals demand exhaustion and breakdown of value perception, increasing the probability of a deeper corrective leg toward the next higher-timeframe demand zone below.
This is why risk is clearly defined, not assumed.
🎯 Trade Strategy (Educational, Not Advisory)
Bullish Swing Strategy:
Entry: Demand hold + bullish structure confirmation
Stop Loss: Hourly close below 1,082
Targets: Partial near resistance → Swing target 1,274 – 1,289
Risk Management Logic:
Trade is invalid if demand fails — no hope-based holding
Position sizing based on SL distance
Patience required; no chasing breakouts
🧠 Key Learning Takeaway
📌 When price reacts at the golden retracement:
Acceptance = trend continuation
Rejection = deeper correction
The goal is not prediction — it is preparing for both outcomes with clarity and discipline.
🧾 Conclusion
This setup offers:
Clear structure
Defined risk
Favorable risk-reward if demand holds
Let price confirm. Let structure guide. Let risk stay controlled.
⚠️ Disclaimer
I am not a SEBI-registered analyst. This analysis is for educational purposes only. Please conduct your own analysis or consult a qualified financial advisor before taking any trades.

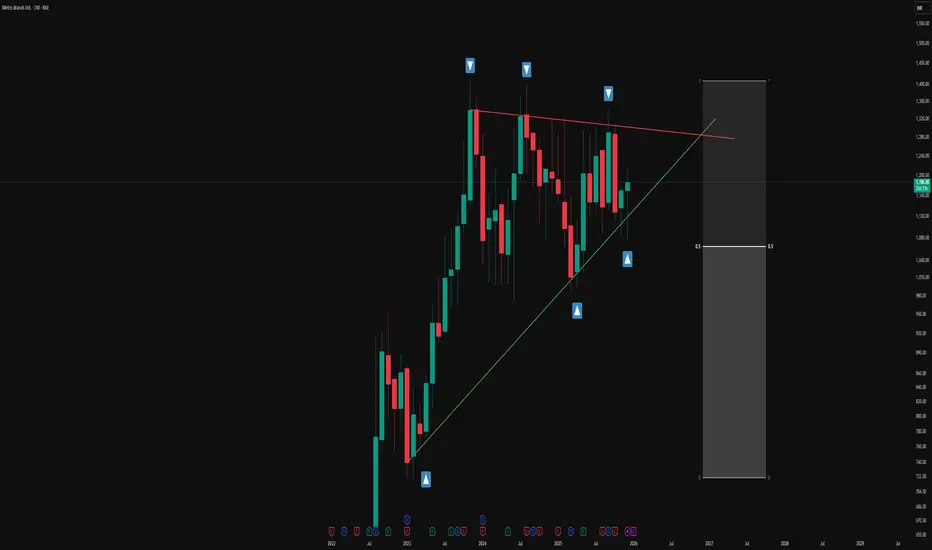
Seeing vs Believing: Multi-Pattern Structure vs Single-Line BOOn the left, the weekly chart is mapped as a full A+ type setup, where multiple structural elements work together instead of relying on a single, convenient line.
-A red counter trendline marks a series of lower-high rejection points, visually defining the “least liquidity” supply line that price has repeatedly respected.
-A dotted parallel channel outlines a broader multi-pattern context.
-A dashed hidden line adds another layer of structure, hinting at less obvious inflection zones that are not visible at first glance but often align with prior reactions.
-Finally, an orange line represents a higher time frame resistance level, bringing in a top-down perspective so that the current weekly price action is seen in relation to a dominant, bigger-picture barrier.
On the right, by contrast, the chart is reduced to a single white line drawn in a way that “forces” the candles to appear as if they are breaking out.
This is a great example of chart psychology in action: instead of objectively mapping all relevant patterns, many traders draw what they want to see—one clean breakout line—ignoring hidden structures, multi-timeframe confluence, and complex pattern overlap.
The intention of this post is purely observational and educational, not forecasting.
It aims to show how a professional, multi-pattern approach (CT lines, channels, hidden lines, and higher timeframe levels) can radically change the way a chart is interpreted compared to the simplistic, single-line breakout mindset that dominates retail thinking.
Disclaimer: This post is for educational and illustrative purposes only and does not constitute investment, trading, or financial advice. Always do your own research and consult a registered financial professional before making any trading decisions.

Simple Triangle Pattern on a Monthly Time FrameOverview -
This monthly chart illustrates a symmetrical triangle pattern defined by a series of higher lows and relatively stable swing highs, framed by a green ascending trendline and a red counter-trendline. The structure is presented in an observational manner to highlight how price has evolved within these converging boundaries over an extended period.
Triangle structure -
1.The green line represents the primary trendline, drawn from successive higher swing lows where price has repeatedly found support and turned back up. Each time price touches or approaches this green line, the contact is marked with a blue upward arrow box to emphasize how buyers have consistently responded around this rising level. Together, these points of contact visually document the stepping pattern of higher lows that contributes to the lower boundary of the triangle.
2.The red line acts as the counter-trendline, connecting multiple prominent swing highs where upward movement has stalled and reversed. Blue downward arrow boxes are placed at these touchpoints to highlight how price has respected this sloping resistance zone over time. The repeated interaction with the red line shows how sellers have been active around this upper boundary, creating a series of contained pushes to the upside.
Understanding -
The overall construction emphasizes how multiple touches on both the trendline (T) and counter-trendline (CT) are used to validate the presence of this symmetrical triangle. Rather than focusing on any single candle, the chart showcases the cumulative behaviour of price over many months, making it a useful visual example for studying how support and resistance can evolve into a geometric pattern on a higher time frame.
Disclaimer: This description is purely educational and observational, intended to explain chart structure and pattern formation. It does not constitute investment advice, trade recommendations, or any suggestion to buy, sell, or hold any financial instrument.
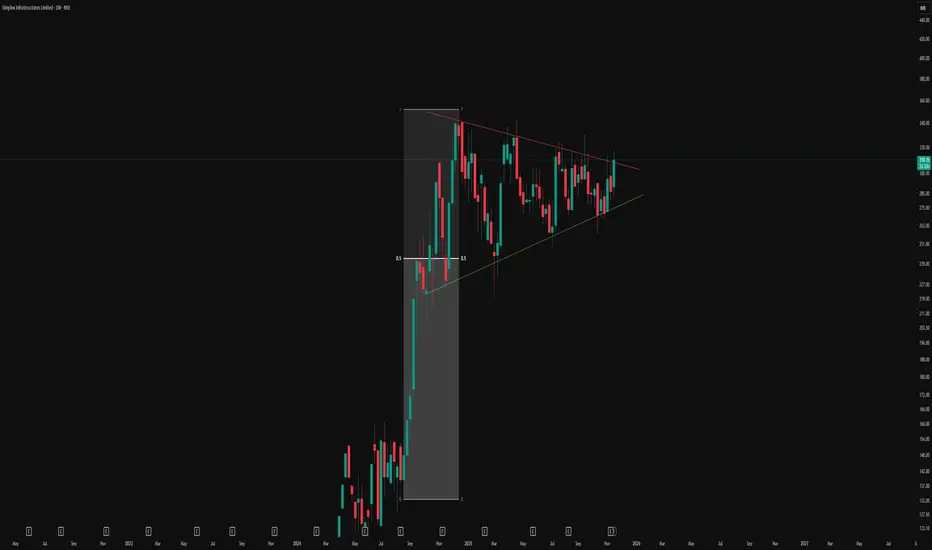
Symmetrical Triangle Formation with 50% EquilibriumVisual Structure and Pattern
-This chart illustrates a textbook symmetrical triangle pattern forming after a strong directional move.
-The red line represents the counter trendline (CT), connecting a series of lower highs.
-The green line marks the ascending trendline, connecting the sequence of higher lows.
-These converging lines encapsulate a contracting price structure, where volatility reduces over time, emphasizing indecision and consolidation among market participants.
-Symmetrical triangles predominantly represent phases where markets consolidate after an impulsive run, and both sides (bulls and bears) gradually reach a point of agreement before the next expansion.
-The 50% equilibrium level within triangles often acts as a magnet for price, attracting liquidity and providing reference for institutional flows, a concept vital for advanced swing trading and risk management.
This post is strictly for educational and analytical purposes, focusing only on chart structures and observable patterns. No content here should be taken as an indication of future price direction or as investment advice.
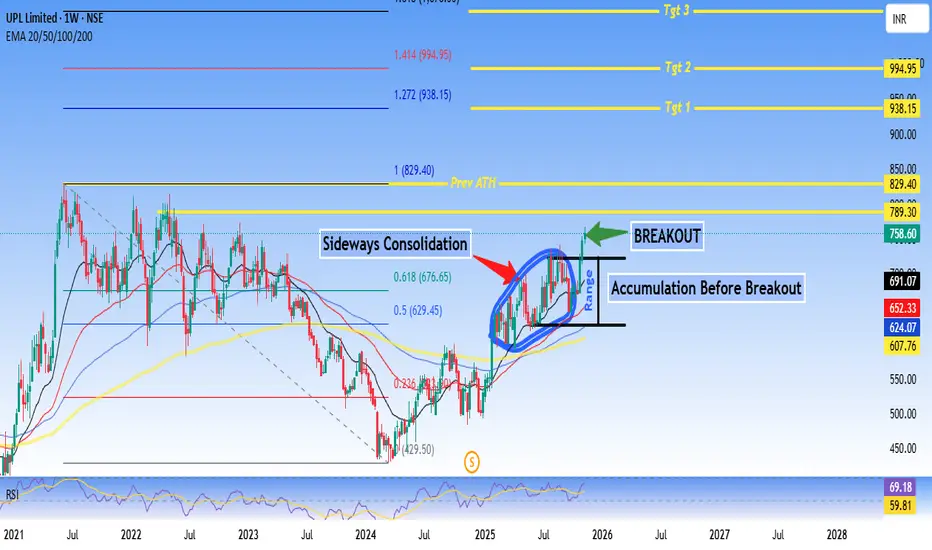
UPL Limited approaching Prev ATH - Technical AnalysisUPL Limited - #Breakout Setup After #Accumulation Phase
Current Price: 691.07
Good For Swing to Short-term Trading.
Technical Summary:
UPL is showing a classic accumulation-to-breakout pattern after an extended sideways #consolidation phase. The stock has broken out from a well-defined range with strong volume confirmation and is now positioned for potential upside momentum.
Key Technical Highlights:
✅ Breakout Confirmed: Price breaking above 768 resistance zone with volume expansion
✅ Accumulation Phase Complete: Extended consolidation (2024-2025) suggesting smart money accumulation
✅ EMA Alignment: 20/50/100/200 EMAs converging and starting to fan out bullishly
✅ RSI Strength: At 69.18, showing momentum without being overbought
✅ Fibonacci Levels: Currently between 0.236-0.5 retracement, plenty of upside room
Price Targets:
- Target 1: 938.15 (+35% from current levels)
- Target 2: 994.95 (+44%)
- Target 3: 1,050+ (Extended target)
Support Levels:
- Immediate: 676 (0.618 Fib)
- Strong: 629 (0.5 Fib + breakout level)
- Critical: 607 (20 EMA)
Risk-Reward: Favorable at current levels with defined support zones and multiple upside targets.
Disclaimer:
This analysis is for educational and informational purposes only and should NOT be considered as financial advice or a recommendation to buy/sell any security.
- Technical analysis is based on historical price patterns and may not predict future performance - Past performance is not indicative of future results - Trading and investing involve substantial risk of loss - Always conduct your own research and due diligence - The author may or may not hold positions in the discussed security - Price targets are projections based on technical levels and not guaranteed outcomes - Market conditions can change rapidly, invalidating technical setups - Use appropriate position sizing and risk management strategies
** Trade at your own risk. You are solely responsible for your trading/investment decisions.**
#UPL #TechnicalAnalysis #Breakout #Accumulation #StockMarket #NSE #SwingTrading #ChemicalSector #FibonacciRetracement #RSI
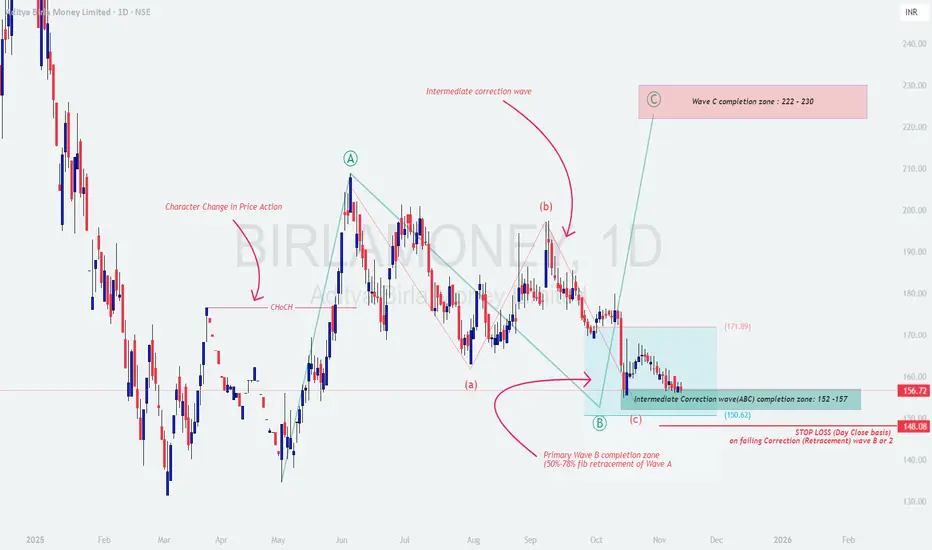
BIRLAMONEY – Wave C Rally Loading?🧠 Chart Context & Wave Structure
The chart displays a classic Elliott Wave corrective setup after a strong impulsive rally (Wave A).
Following the impulsive move, price entered a multi-stage correction, forming a clear (a-b-c) structure within Wave B.
Key Observations:
📈 Character Change in Price Action (ChoCH) signaled the initial shift from bearish to bullish structure.
Wave A marked a strong impulsive leg confirming bullish sentiment.
The ongoing Wave B correction is now nearing completion within the 50%-78% Fibonacci retracement zone of Wave A.
The Intermediate correction (ABC) seems to be completing between ₹152 – ₹157, aligning with strong confluence support.
📚 Educational Insights
1️⃣ Character Change in Price Action (ChoCH):
Marks the structural shift from lower highs/lows to higher highs/lows — the first clue of trend reversal.
2️⃣ Fibonacci Retracement Principle:
Most corrective waves retrace 50%–78.6% of the prior impulsive leg.
This “Golden Pocket” zone often acts as a high-probability reversal area where smart money accumulates.
3️⃣ Wave Structure Psychology:
Wave A: Impulsive rally driven by renewed optimism.
Wave B: Corrective pullback – often mistaken as a bearish reversal.
Wave C: Next impulsive leg resuming the primary uptrend; often equals or exceeds Wave A in magnitude.
🎯 Price Projection & Prediction
Wave B completion zone: ₹152 – ₹157 ✅
Wave C potential target zone: ₹222 – ₹230 🎯
Invalidation / Stop-Loss zone: Below ₹148 (Closing basis) 🚫
If price sustains above ₹157 and breaks ₹171.89, it strengthens the bullish probability for Wave C extension.
💡 Trading Strategy (Educational Purpose Only)
1️⃣ Entry Plan:
Watch for bullish reversal patterns (Hammer, Bullish Engulfing, or Double Bottom) near ₹152–₹157.
Aggressive Entry: Partial accumulation in this zone.
Conservative Entry: Wait for breakout confirmation above ₹165–₹171.89 zone.
2️⃣ Targets:
🎯 Target 1: ₹190 (Intermediate resistance)
🎯 Target 2: ₹222 – ₹230 (Wave C completion zone)
3️⃣ Stop-Loss:
Keep Closing basis SL below ₹148, as a break below it invalidates the current corrective completion structure.
⚖️ Risk Management Tips
Risk only 1–2% of your total trading capital per trade.
Avoid aggressive averaging during corrections.
For options traders — enter directional positions only after structure confirmation.
Combine structure + volume confirmation for high-probability setups.
Remember: Elliott Waves show probability, not certainty.
🧩 Summary & Conclusion
Aditya Birla Money appears to be completing its intermediate corrective Wave (ABC) within the ₹152–₹157 zone — a strong support confluence area.
If the structure holds, a potential impulsive Wave C rally could unfold toward ₹222–₹230 in the coming weeks.
Patience and confirmation will be key before entering this potential move.
⚠️ Disclaimer
I am not a SEBI-registered analyst.
This analysis is purely for educational and informational purposes only and should not be taken as investment advice.
Please consult your financial advisor before making any trading decisions.
The Psychology Behind Winning TradesThe Psychology Behind Winning Trades 🧠💹✨
Introduction – Hook:
📊 “Why do some traders consistently win 💰 while others struggle 💔?”
It’s rarely the strategy—it’s the mindset behind the trade! 🧠🌟
Your emotions, thoughts, and biases control your decisions, even with perfect technical skills. 🎯
1️⃣ What is Trading Psychology?
Trading psychology is the study of how emotions and mental habits affect trading decisions. 🌈🧘♂️
It’s about understanding:
How fear 😨, greed 😍, or impatience ⏳ impacts your trades
Why you sometimes ignore your rules 📝
How discipline 💪 can make the difference between profit 🏆 and loss 💸
💡 Tip: Even the best strategies fail if your mind isn’t in control. 🧠✨
2️⃣ Common Psychological Traps & How They Appear in Trades
Trap Emoji Effect Example in Trading
Fear 😨 Exiting too early Closing a winning trade because you’re scared of losing profits 💔
Greed 😍 Holding losing trades Waiting for a loss to “come back” and losing more money 💸
FOMO 🏃♂️💨 Jumping impulsively Entering trades last minute because everyone else is trading 🚀
Revenge Trading 😤🔥 Emotional loss-chasing Trying to recover losses by taking bigger, risky trades 💣
💡 Insight: Recognizing these emotions is the first step to controlling them. 🌟
3️⃣ How to Master Your Trading Mind
1️⃣ Pre-Trade Preparation 🧘♀️✅
Check your emotional state before trading 🕊️
Confirm your trade plan is clear 📋✨
2️⃣ During the Trade ✋🎯
Stick to your rules, don’t let emotions take over 💪🔥
Avoid impulsive exits or entries ⏱️❌
3️⃣ Post-Trade Reflection 📖🖊️
Keep a Trading Journal: note emotions, mistakes & wins ✨📓
Review trades to improve your mindset over time 📈🌟
4️⃣ Pro Tips for Winning Psychology
🔥 Mindset Checklist:
Am I trading calmly? 😌💭
Am I following my plan? 📋✅
Am I chasing losses or profits emotionally? ⚖️💡
💡 Daily Mindset Practice: Meditation 🧘♂️, journaling ✍️, or reviewing trades 📊 can help you stay disciplined under pressure 💎🌟
5️⃣ Why It Matters
Trading without psychology = strategy leaks money 💸💨
Emotional control = consistency, higher win rates, confidence 🏆💪
Professionals don’t just trade charts—they trade themselves 🧠✨
6️⃣ Engagement Section
👇 Question for your audience:
“What’s the biggest psychological trap YOU’ve faced in trading? Share your story below! 💬💭💖”

Delhivery’s Technical Setup: A Case Study in Breakout MomentumDelhivery stock is trading at ₹485 and approaching a key resistance level of ₹488 on the weekly chart. A successful breakout above this level could signal a strong bullish continuation, especially with RSI trending toward 70.
Delhivery Ltd., a prominent logistics player in India, is currently showcasing a textbook example of a bullish technical setup. As of early November 2025, the stock is trading around ₹485, just shy of a crucial resistance level at ₹488 on the weekly chart. This moment presents a valuable learning opportunity for traders and investors seeking to understand breakout dynamics and trend reversals.
🔹 Breaking the Downtrend: June 2025
The first major technical milestone occurred in June 2025, when Delhivery successfully broke above its long-standing downtrend line. This line had previously acted as a ceiling, suppressing upward price movement. The breakout was not just a fleeting spike—it was followed by sustained trading above the trendline, confirming the shift in market sentiment from bearish to bullish.
🔹 Resistance at ₹488: The Next Barrier
Now, the stock is testing the ₹488 resistance level, a price point that has historically capped upward momentum. Resistance levels are critical in technical analysis because they represent zones where selling pressure tends to emerge. However, when a stock approaches such a level with strong momentum and supportive indicators, the probability of a breakout increases.
A weekly close above ₹488 would not only mark a successful resistance breakout but also reinforce the bullish reversal initiated in June. This could pave the way for a new upward leg in the stock’s trajectory.
🔹 RSI: Strength in Momentum
The Relative Strength Index (RSI) adds further weight to the bullish case. Currently, RSI is above 50, indicating positive momentum. More importantly, it is poised to cross above 70, a zone typically associated with strong bullish trends.
Unlike other indicators, RSI is a pure momentum gauge. When it moves from neutral (50) toward the overbought zone (70+), it reflects increasing buying interest. In the context of a resistance breakout, this RSI behavior suggests that the breakout could be supported by genuine strength, not just speculative spikes.
🧠 Educational Takeaways
Trendline Breakouts: A breakout above a long-term downtrend line signals a potential reversal in sentiment. Confirmation comes from sustained trading above the line.
Resistance Levels: These act as psychological and technical barriers. A breakout above resistance, especially on higher timeframes like weekly charts, is a strong bullish signal.
RSI Confirmation: RSI moving above 50 and approaching 70 adds credibility to the breakout. It shows that momentum is building, not fading.
📌 Conclusion
Delhivery’s current price action offers a compelling case study in breakout trading. With the stock trading at ₹485, just below the ₹488 resistance, and RSI showing bullish momentum, traders should watch closely. A confirmed breakout could validate the bullish reversal and open the door to higher price targets.
Live chart Study

CAPLIPOINT : A Textbook Elliott Wave Correction Unfolding
\ Timeframe:\ Daily
\ Structure:\ Corrective to Impulsive
\ Type:\ Educational Swing Setup
---
🔍 \ 1. Context and Background:\
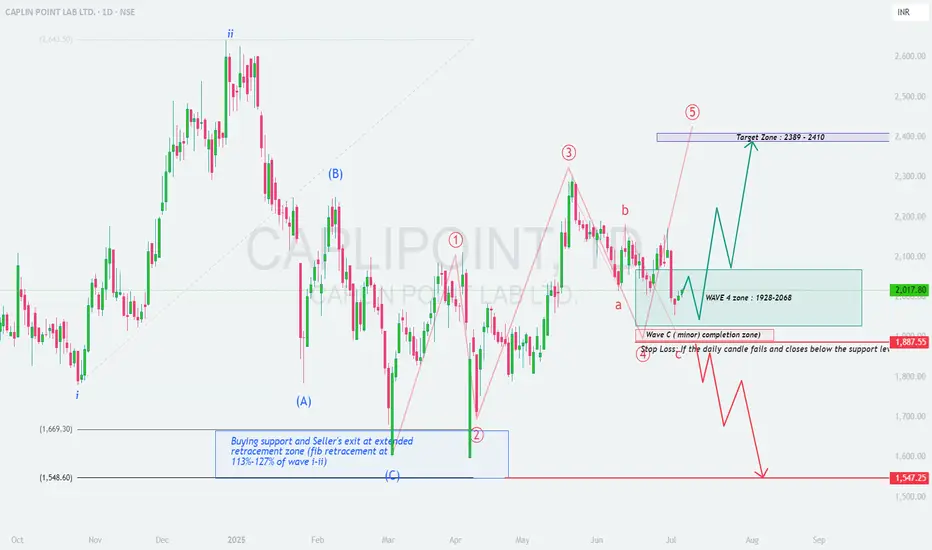
CAPLIPOINT has exhibited a classic 5-wave impulsive rally followed by a correction phase, aligning neatly with \ Elliott Wave Theory\ . Currently, the stock appears to be in \ Wave 4 correction\ – often a shallow, sideways or ABC-type pattern – preparing for a potential \ Wave 5 impulse\ .
---
📈 \ 2. Wave Structure Breakdown:\
* \ Wave 1 to Wave 3\ completed with good strength.
* \ Wave 3\ peaked near \ ₹2390\ , showing signs of extension.
* The ongoing \ Wave 4 correction\ seems to be forming a textbook \ ABC pattern\ :
* \ Wave A and Wave B\ completed.
* \ Wave C\ likely completed or very close to completion inside the support zone.
---
🟦 \ 3. Wave 4 Correction Zone – ₹1928 to ₹2068:\
This zone offers a \ high-probability reversal area\ supported by:
* \ 38.2%–50% Fibonacci retracement\ of Wave 3.
* Confluence with \ previous consolidation\ support.
* Price action showing \ long wicks and small candles\ , signaling accumulation or demand.
---
🟥 \ 4. Wave C and Critical Support – ₹1887:\
* ₹1887 is likely the \ end of Wave C\ and the complete ABC correction.
* Based on:
* \ 113%–127% Fibonacci extension\ of Wave A (classic C-wave completion area).
* Strong \ volume spike and price rejection\ near this zone.
---
🟪 \ 5. Wave 5 Target Projection – ₹2389 to ₹2410:\
Projected using:
* \ Fibonacci extension\ of Wave 1 from Wave 4 low.
* \ Measured move technique\ .
* Target aligns with previous resistance around \ Wave 3 top at ₹2390\ .
---
🛑 \ 6. Stop Loss & Invalidation Level:\
* \ Invalidation below ₹1887\ on a daily close.
* A close below this would signal a potential \ deeper correction\ toward ₹1547–1660 zone.
---
✅ \ 7. Strategic Swing Trade Plan:\
* \ Entry Zone:\ ₹1930 – ₹2065
* \ Stop Loss:\ ₹1887 (daily close basis)
* \ Target 1:\ ₹2250
* \ Target 2:\ ₹2389–2410 (projected Wave 5 zone)
---
### 🧠 \ 8. Why This Setup is Educational:\
* \ Textbook Elliott Wave Pattern:\ Classic 5-wave setup with ABC correction.
* \ Fibonacci Confluence:\ Retracement and extensions align perfectly.
* \ Price Action Validation:\ Support zone showing bullish characteristics.
* \ Defined Risk-Reward:\ Excellent R\:R with tight SL.
* \ Momentum Potential:\ Wave 5 often brings sharp, fast moves—ideal for swing setups.
---
📌 \ Conclusion:\
CAPLIPOINT is completing a clean \ Wave 4 correction\ and preparing for its \ final impulsive Wave 5\ . If \ ₹1887\ holds, the stock may target \ ₹2389–2410\ in the coming sessions. A technically rich and structurally strong swing opportunity for serious traders and wave enthusiasts.
PAGIND - Falling Wwdge + inverse head & shoulder “PAGEIND – Falling Wedge + Inverse Head & Shoulder | Potential Reversal Setup 📈”
🧩 Description (for your idea post):
Chart Comparison:
Left: PAGEIND (Cash) – Showing a falling wedge pattern formation.
Right: PAGEIND Futures – Showing a clear inverse head & shoulders structure.
Technical Confluence:
Both charts indicate a potential trend reversal from a short-term bottom.
Wedge breakout + IHS pattern neckline breakout could trigger strong bullish momentum.
Volume confirmation on breakout will be key for reliability.
Key Levels to Watch:
Breakout Zone: 41,300 – 41,500
Immediate Resistance: 42,000 – 42,500
Support: 40,400 – 40,600
Trading Plan (Educational Purpose):
Entry: Above neckline / wedge breakout zone
Stoploss: Below right shoulder (≈ 40,400)
Targets: 42,500 / 43,200 / 44,000
📅 Timeframe: 1D (Swing Setup)
🧭 Disclaimer:
This idea is shared for educational purposes only. Not a buy or sell recommendation.

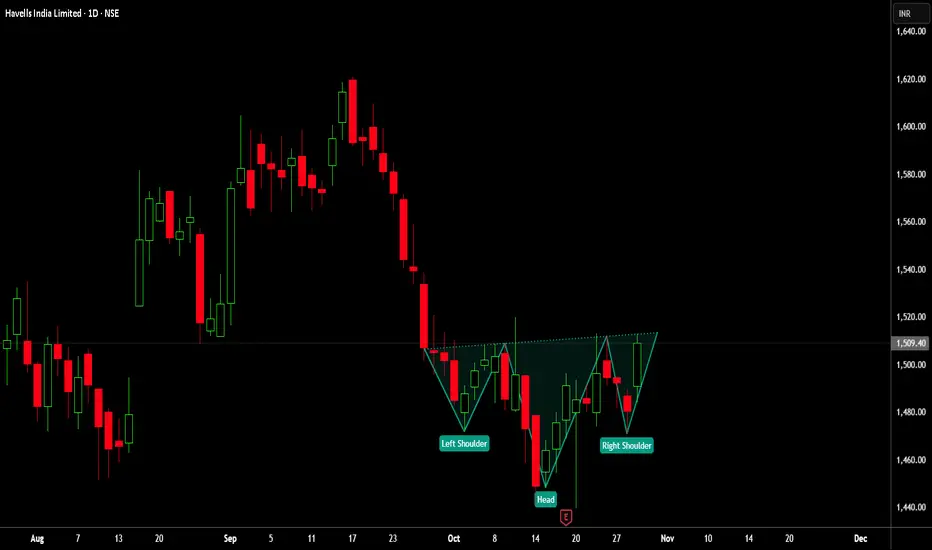
HAVELLS 🧩 Havells India – Inverse Head & Shoulders Breakout Formation (Bullish Reversal Setup)
🧠 Description:
The Havells India Ltd (Daily) chart is displaying a potential Inverse Head & Shoulders pattern — a classic bullish reversal formation often seen near market bottoms.
🏗️ Pattern Structure:
The Left Shoulder formed in early October 2025.
The Head was completed near mid-October with a strong rejection candle around ₹1,440.
The Right Shoulder is now shaping up with consistent higher lows, showing accumulation signs.
The Neckline Resistance lies near ₹1,515–₹1,520.
A breakout and daily close above the neckline could trigger further upside momentum.
📊 Technical Highlights:
RSI: Recovered from oversold zone and sustaining above 50 — confirming bullish momentum.
Volume: Gradual rise in volume indicates possible institutional participation.
Trend Structure: Formation of higher highs and higher lows post-head formation.
🔑 Key Levels:
📍 Neckline Zone: ₹1,515–₹1,520
📍 Breakout Confirmation: Daily close above ₹1,520
📍 Immediate Target: ₹1,560
📍 Extended Target: ₹1,600–₹1,625
📍 Stop Loss: Below ₹1,470 (Right Shoulder low)
🧭 Trading Plan:
✅ Entry: On sustained move or daily close above ₹1,520
🔒 Stop Loss: Below ₹1,470
🎯 Targets: ₹1,560 → ₹1,625
📈 View:
Bullish (Swing/Positional) — If the neckline breakout sustains, Havells India could see momentum continuation toward higher resistance levels.
📰 Watchlist Note:
Keep this setup under your watchlist for breakout confirmation.
Always Do Your Own Research (DOYR) before acting.
❌ No Buy/Sell Recommendation.
🙏 Thank You for Reading!
👍 BOOST if you found this useful.
📌 FOLLOW for more market setups.
💬 COMMENT below with your analysis or feedback.
⚠️ Disclaimer:
I am not a SEBI REGISTERED RESEARCH ANALYST AND INVESTMENT ADVISER.
This analysis is intended solely for informational purposes and should not be interpreted as financial advice.
Please consult a qualified financial advisor or conduct thorough research before making investment decisions.
NVDA UP TO 214$Hello
According to my analysis on the NVDA daily chart, I can confirm a high-probability buy opportunity that could reach $214 within the next few days.
Ibrouri Abdessamad

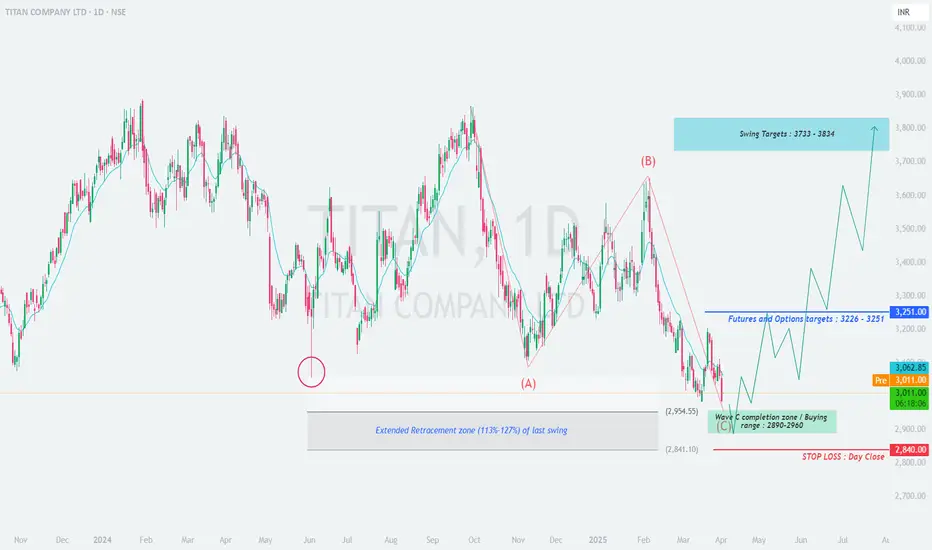
TITAN - High Probability Reversal SetupTITAN COMPANY LTD (NSE:TITAN) - High Probability Reversal Setup
Weekly Timeframe Analysis | Potential Swing Trade Opportunity
▲ BULLISH CASE
Elliott Wave Structure:
• Appears to be completing Wave C of correction (ABC pattern)
• Wave C = 1.272 extension of Wave A at ₹2,890-2,960 zone
• Typical reversal area for such corrections
Technical Confluences:
• Fibonacci Support:
1.127-1.272 retracement of prior uptrend
Aligns with 2023 swing high area
• Volume Profile:
High volume node at ₹2,920
Declining volume on recent downmove
Pattern Recognition:
• Potential falling wedge (bullish)
• RSI(14) weekly showing bullish divergence
• MACD histogram flattening near lows
▼ RISK FACTORS
• Breakdown below ₹2,840 invalidates setup
• Broader market weakness could delay recovery
• FIIs reducing positions in consumer sector
📊 Trade Plan
Entry Zone: ₹2,890-2,960 (scale-in approach recommended)
Stop Loss: Daily close below ₹2,840 (absolute)
Targets:
T1: ₹3,226 (61.8% retrace)
T2: ₹3,733 (previous high)
T3: ₹3,834 (127% extension)
Timeframe: 8-12 week hold for full targets
📌 Key Levels
Support
Resistance
₹2,960 (immediate)
₹3,100 (200 DMA)
₹2,890 (strong)
₹3,226 (F&O OI peak)
₹2,840 (absolute)
₹3,733 (ATH)
💡 Additional Notes:
• Watch for bullish reversal candle patterns in the zone
• FII derivative data shows put writing at ₹2,900 strike
• Consumer sector showing relative strength vs Nifty
Would you take this trade? Discuss in comments!
#TITAN,#NSE,#swingtrading,#elliottwave,#technicalanalysis