Importance of Stoploss in TradingStop-loss is a risk management tool used by traders to limit their potential losses. It is an order placed with a broker to automatically sell or buy a security if it reaches a certain price level, known as the stop-loss level.
Here are some general guidelines on where to place stop-loss orders 👇
⚡ Support and Resistance Levels
A common approach is to place stop-loss orders at key levels of support or resistance. For example, if you are long in a stock, you may place your stop-loss order just below a support level. If the price falls below this level, it is an indication that the trend has changed and it's time to exit the trade.
⚡ Volatility
Another approach is to place stop-loss orders based on the volatility of the security. If a stock has high volatility, you may want to place your stop-loss order further away from the entry price to give it more room to move. Conversely, if a stock has low volatility, you may place your stop-loss order closer to the entry price. But you still need to give the stock enough room to breath in case of the latter.
⚡ Technical Indicators
Some traders use technical indicators to place stop-loss orders. For example, you may use the average true range (ATR) to set your stop-loss order. The ATR measures the average range of price movements, and you can set your stop-loss order at a multiple of the ATR.
Ultimately, where you place your stop-loss order will depend on your trading strategy, risk tolerance, and the specific security you are trading. It's important to have a clear plan for where to place your stop-loss order before entering a trade, as it can help you manage risk and avoid potentially large losses.
What are your thoughts on using stoploss and which method do you use? Do write in the comment section.
Trade safe and stay healthy.
Stoploss

Tracxn TechTracxn Tech limited is showing ascending triangle pattern and it already have faced resistance 3 time.. now we can expect bullish continuation trend after breakout.. this is my prediction and not buy or call recommendation

Jindal world 1D TFNSE:JINDWORLD
Jindal world 1D TF - Reversal
Target - 11%
Stop loss - 2.5%
The analysis is done on daily TF hence
price may take few days to few weeks
in order to reach the targets.
Trade setup is explained in image itself.
The above analysis is purely for
educational purpose. Traders must
do their own study & follow risk
management before entering into any
trade.
Checkout my other ideas to understand
how one can earn from stock markets
with simple trade setups. Feel Free
to comment below this or connect
with me for any query or suggestion
regarding this stock or Price Action
Analysis.

Quick Targets Series : #5BINANCE:BTCPERP
Upper pivot 16650
lower pivot 16450
Any one breaks set a target of 30 points..

longgranules india is trying to break out for short term if it stops at 351 today then it may cross 500 in few days.

STOP LOSS. AND WHY IT IS IMPORTANT TO TRADERS.A few pointers on why Stop Loss is a necessity for those who trade.

Consolidation is the time to accumulate a stockBharti Airtel has been consolidating for the past 1 year in the price range of 780 - 630.
This is the time to accumulate this stock and pyramid your position only when the stock given a weekly breakout above 780.
A weekly closing below 630 - 590 range will be our signal to exit the stock.

Three Genuine Triangle EntriesTriangles are very common and promising patterns. Normally they are considered as continuation patterns in the direction of prevailing trend. I am presenting here three useful entry techniques. None is better than the other and each one has its own strengths and weaknesses.
ANTICIPATION SETUP
As the name suggests, the trade is taken before the triangle breakout. It is in anticipation of a continuation breakout. Entry is taken at the third touch of the uptrendline.
Stoploss is fairly smaller, below previous swing low A, compared to other setups. Stop can be brought up to breakeven as soon as breakout happens.
As entry is taken before breakout, the chances of hitting the smaller stop are fairly high.
BREAKOUT SETUP
Entry is taken above the prior swing high B with stop below the recent swing low C as shown in the chart. The stoploss is relatively large but chances of hitting the stop is also relatively less.
CONFIRMATION SETUP
Many a times, after the breakout, price pulls back to the triangle for a retest. The entry is taken above the swing high E formed after the breakout as shown in the chart. Stop is kept below the recent retest swing low F or the last swing low D inside the triangle.
Stop may be large in this case but it comes with higher chances of a successful trade.
TARGETS
Target in all the three cases should be the height of the triangle, shown in the chart, as measured from the breakout point of the triangle.
PRO TIP
♦ The triangle breakout should occur within 1/3rd to 3/4th the length of the triangle (see chart). The late breakouts are not considered as valid continuations and may end up as a trading range.
♦ Ideally volume dries up as the price consolidates in a triangle. Volume starts picking up as the breakout occurs which is a good sign.
♦ Triangles setups are valid in both uptrend and downtrend.
I hope the above information would be helpful.
Thanks for reading 😉

Jamna Auto Breakout1. Buy or Sell at your own risk
2. Don't risk more than 1%-2% of your capital as stop loss
3. Position Size formula: - Stop Loss Amount/(Buy Price-Initial Stop Loss Price)
4. Sell on RSI close below 30 (or use any other method of your liking)
5. Some other ways to sell stocks can be
a. 25% or 50% up in three weeks or less
b. Weekly tailing tops with high volume
c. Exhaustion gaps
d. Heavy daily volume without further upside
e. Largest one day price drop
After a consolidation since January 2022, NSE:JAMNAAUTO has given a breakout on 29th June. Buy with a stop just below Rs.117.
Strengths: -
1. TTM Sales growth is at 59% and TTM Profit growth is at 92%.
2. 10 year and 5 year average ROE more than 15%.
3. Debt to equity at 0.28 (less than 1 is good), Interest Coverage at 69.6 (greater than 3 is good)
4. Dividend yield at 0.38% (consistent dividend payer since 2011)
5. Credit rating agency ICRA has reaffirmed the ratings of the company on April 2022 (please go through the credit rating report for better understanding)
6. DII's increased stake from 5.2% in June 2020 to 13.55% in March 2022
7. ADX > 30 on daily chart
Weaknesses: -
1. Pledged percentage 3.80 %
2. Stock is trading at 7.49 times its book value
3. The company has delivered a poor sales growth of 5.86% over the past five years
4. Debtor days have increased from 35.36 to 61.31 days
5. Borrowings increased to 191Cr in March 2022 from 11Cr in March 2021
6. FII's stake decreased from 7.37% in June 2021 to 5.55% in March 2022
Disclaimer: I am not SEBI Registered. Do trade or invest at your own risk, I am not responsible for any losses and won't claim anything from your profits either. Take financial advice from your advisors before jumping in.

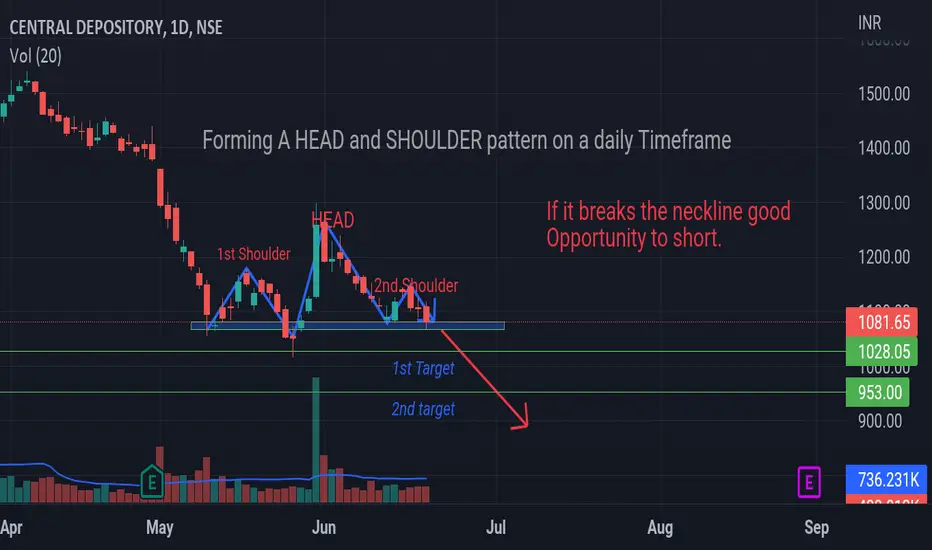
CDSL --- A PERFECT TIME TO SHORTThis is the daily chart of CDSL i.e Central Depository.
Currently it has made a price action pattern i.e HEAD AND SHOULDER
If it breaks it's neckline, it will be a perfect entry with a small stoploss and a target of roughly ₹50.
*NOTICE*
I AM NOT SEBI REGISTERED.
I WILL NOT BE RESPONSIBLE FOR YOUR LOSSES
How to trade supportive trendlineNSE:COALINDIA
Pros-
.Supportive trendline trade is one of them which has a huge risk-reward ratio.
.It is easy to trade compared to others.
.Less complexity in the chart so the charts look clean.
.
.
Cons-
finding the perfect inclined trendline is time-consuming or we can say little bit difficult.
Procedure-
. First, find the trendline with an inclination range between 14-25 degrees.
.find the value of the up move whenever it touches so that we can project the next move.
.Add an alert to the trendline so that you can't miss any move.
.As you get an alert, you just have to take an entry with stop loss below the trendline (as per your RR ratio)
.Don't forget to keep SL
.After entry, you have to track your target.
Happy Trading

BANKNIFTY INTRADAY SUPPORT & RESISTANCE LEVELS FOR [02-05-2022]NSE:BANKNIFTY
BankNifty analysis important levels are marked on the chart.
please always trade with stop loss to avoid big drawdown.
Happy trading & keep learning.

Good volume Breakout. Learning only, read whole description.Dear Traders,
Syngene International had given breakout in previous session. But still there was a chance of resistance in it as per shown in graph. Also, you all can see that breakout was clear and volume was considerably higher than average. So, we could have took trade in it today morning or on Friday before market closing. I missed it because of having personal work. But please learn from it and trade when you find next setup in other stocks.
Hope you all enjoying 10% from our all previous posts. There are almost 15 Posts of mine and you all could have made 100% till date if you have booked profits at right time with few stop losses. Trading without Stop Loss is Impossible.
A moment of pain worth life-time Glory.

GNFC Breakout1. Buy or Sell at your own risk
2. Don't risk more than 1%-2% of your capital as stop loss
3. Position Size formula:- Stop Loss/(Buy Price-Initial Stop Loss Price)
4. Either sell on initial stop loss hit or when closes below daily supertrend
Quarterly sales growth of 58% and profit growth of of 124%. OPM increase from 24% to 28% and a high volume breakout makes NSE:GNFC a good buying oppourtunity. Keep a stop loss of Rs.490.

SYMPHONYDear Traders,
Symphony is Trading in a range for almost 11 months. Today it broke out of that parallel range with a considerable volume. Also last 3 to 4 Days were not showing bearish sign. So, it is good to go stock for me. But, as we all know it could be a fake breakout so put half of you money only with 6% Stop Loss of CMP. And put other half when tomorrow it surpasses today's High with good volume. Happy Trading Guys.

Possibilities of big breakoutWith quarterly sales increasing by 42% and quarterly profit increasing by 68%, BSE:JASCH posted good set of numbers. This share is in a trading range since Jul'21 and now looks like it's ready for a breakout. RSI is also breaking out of it's range which confirms bullish trend. If it breaks Rs.174 with big volumes and stays above it, one can buy with a stop at or below Rs.150. It's better to wait for 3:15 before buying to understand if it is coming down or closing near the top. A close near the top proves it's strength.
Other Fundamentals: -
1. Average ROE for last 5 years above 15%
2. TTM sales growth at 72% and TTM profit growth at 136%
3. Borrowings came down from Rs.23cr to Rs.3cr since Mar'19
4. Debt to equity at 0.04, Interest coverage ratio at 47.9 and ROCE at 24%
5. During FY21, the Co was able to improve the drying speed of PVC coated fabrics in its existing ovens, as a result of which the installed capacity of PVC coated fabrics being manufactured has increased from 78 lakh metres to 94 lakh metres p.a.
6. Some of the major clients of the co include Puma, Red Tape, Bata, Mahindra, Walmart, Calvin Klein etc.
7. The company has recently modified its production lines, which has resulted in development of some new products with significant saving in power and fuel. The company has been concentrating on PU resin and PU Synthetic Leather where the competition is less.

Excel Industries Breakout 1. Buy or Sell at your own risk
2. Don't risk more than 1%-2% of your capital as stop loss
3. Position Size formula:- Stop Loss/(Buy Price-Initial Stop Loss Price)
4. Sell on initial stop loss hit or close below supertrend (for short term traders) or close below 200 day EMA (for long term investors)
After posting quarter sales growth of 64%, quarter profit growth of 198%, TTM sales growth of 47% and TTM profit growth of 114%, NSE:EXCELINDUS gave a big volume breakout (after a long consolidation since Mar'19) yesterday but couldn't close above previous resistance and near day high. Today it has made another attempt but there is selling at the top. Still, it's a good breakout. Keep an eye on this stock and if you think markets will continue to move up, buy with a stop below Rs.1183.
Other Fundamentals: -
1. 5 year CAGR sales growth of 11% and CAGR profit growth of 21%
2. Debt to equity 0.01, Interest coverage 97.4 and FCF to CFO 40%
3. Dividend Yield of 0.83% (consistent dividend payer since 2010)
4. Continuous capacity expansion since 2011
5. Cash conversion Cycle improved from 99 in Mar'15 to 29 in Mar'21

Ambika Cotton Breakout1. Buy or Sell at your own risk
2. Don't risk more than 1%-2% of your capital as stop loss
3. Position Size formula:- Stop Loss/(Buy Price-Initial Stop Loss Price)
4. Either sell on initial stop loss hit or when closes below daily supertrend
After increasing quarterly sales by 31% and quarterly profits by 146% NSE:AMBIKCO given a gap up opening and ended near day high after a consolidation of 3 months. Volumes were 10 times higher than average. Buy with a stop below Rs. 2450.
Other Fundamentals: -
1. Main overseas clients are Quannitex Enterprise Corporatio, Pacific Textiles and Winnitex Investment Company
2. Main domestic customers are Arvind Mills, Raymond, Aashima Textiles and Morarjee
3. ACML specializes in manufacturing of premium quality compact and Eli Twist yarn. The company uses extra-long staple cotton in its yarn manufacturing by importing high-quality Giza and Pima cotton from Egypt and the US respectively
4. ACML has an established market leadership position in the industry
5. Borrowings came down to zero since Mar'20
6. Low debtor days of 8
7. FII holdings increased from 0.11 in Sep'21 to 2.30 in Dec'21
8. TTM Sales, OPM and TTM EPS increased hugely
9. Dividend Yield 1.28 % (consistent dividend payer since 2010)
10. Current ratio 9.50, Debt to equity 0.00, Int Coverage 107, FCF to CFO 67.5 %

Advani Hotels breakout1. Buy or Sell at your own risk
2. Don't risk more than 1%-2% of your capital as stop loss
3. Position Size formula:- Stop Loss/(Buy Price-Initial Stop Loss Price)
4. Either sell on initial stop loss hit or when closes below daily supertrend
With quarterly sales increasing by 105% and quarterly profit increasing by 363% NSE:ADVANIHOTR gave a breakout with very big volumes after a consolidation of almost 4 years. Buy with a stop at or below Rs.91.

CCL breaks outQuarter sales growth at 42%, quarter profit growth at 24% and a high volume breakout after long ranged movement. Buy with a stop at or below 470.

NIFTY 50 Levels for date : 04/02/2022
This are the levels I’m sharing only for Educational Purpose only .
The green area box is Resistance.
The module area box in yellow is Flip Zone .
The red area box is Support.
Above Resistance there are two areas marked with horizontal line.
Below Support there are two areas marked with horizontal line.
Breakout or breakdown of above happens then you can trade but proper formation of candle stick pattern should take place and EMA 10 & 20 should be cupping and should be close to candle . STOP LOSS below the previous candle of entry .

Swing 2-3 Days Hold Naharpoly [ Long ]This Trade idea is for 24 . 01 .2022
CMP : 354.95
Buy above 382
Target: 417 1:1 Reward
StopLoss : 348.65
Note For Safe Trade:
Always know your risk before taking entry..

Chart Analysis of IDFC First Bank (12 Dec 2021)Triangle breakout completed on weekly basis.
Private Bank looking Strong for Upcoming Weeks.
Target : 70
SL : 50 WCB
Only for educational purpose. Not a recommendation.
