Bullish Reversal Setup - Simple & Practical GuideIntroduction to the Setup
In this educational post, we will discover a low-risk bullish reversal setup,
We all know that markets are dynamic & getting more and more efficient, and in such conditions, we also need to take a dynamic approach to the markets in different situations, you can't have a edge if you stick to only one setup in every market situation. For Example If you are a breakout trader then you will only look range breakouts but the current market situation is kind of end phase of A correction. So there you won't find stocks with good ranges building up for breakout At that point You either will have bad entries or either you need to wait for the range to build.
But here let's say you have another setup of reversal trading then you can find many good entries with low risk.
This setup a combination of price action and moving averages, Let's explore great setup in detail.
1. You need to identify the The trend
👉🏻Market was already in an uptrend.
👉🏻Higher highs and higher lows were present earlier.
Once you have identified a uptrend then you are ready to move to the second step.
2. Correction Phase – Healthy Pullback, Not Breakdown
👉🏻Price made a deep correction from the top.
👉🏻This correction came into the EMA support area.
👉🏻No panic selling, no long red candles exploding downward.
A correction should show signs of weakness when it reaches into 3rd step.
3. The Demand Zone
👉🏻 You need to find a area on the left side of chart (in uptrend) from where Massive up move has started.
👉🏻 On the chart you will find we have marked a rectangle box in blue color starting from the previous higher area, From this point the price has good up move Hence it's a demand zone.
👉🏻 When falling price reaches this area the price should react
by giving wicks from below in a candle or the size falling candle should reduce or some indecision candle form like Doji, spinning top etc.
4. Demand Zone Marking
👉 On the higher low you area you will find range candle just before the upmove bursts so that candle is used to mark the demand zone
5.EMA + Demand Zone = Support Cluster
👉Price reacts exactly where EMA support and demand zone overlap.
👉This zone is where buyers previously stepped in.
👉Market is basically saying: “This area still matters.”
⭐️ One support is weak. Multiple supports together are strong.
6. Holding demand zone
👉🏻After touching demand, price does NOT make a lower low.
👉🏻Instead, it forms a higher low.
👉🏻This is the first real signal that sellers are losing control.
7. Entry Action
👉🏻 Usually when the price hit demand zone and it forms few bullish candles, it tries to retest the demand zone once again but this time it reverses a little above from demand zone at that time you need to act and place your buys.
8. Setting The Stoploss
👉🏻 The stop loss is below the demand zone, If the demand zone fails to hold the prize then you will get a very early exit, Usually these kind of entries have 1% to 2% of stop loss because we do not want to trade any demand zone which is bigger than 2%
9. The Reward
👉🏻 In a reversal setup you at least need to maintain 1:2 risk to reward ratio.
👉🏻 Pay attention last Higher High Zone From where this correction has started That point will be called as a supply zone and there also you will find range bar just the starting of down move so that supply zone is the maximum target that you need to aim for.
👉🏻 Make sure that the last supply zone is not too near from your entry you need to give price some room to make movements.
Practice Time - With Live Examples🗒
This is HOSE:TVS motor 1h chart and we have applied a 200 EMA.
First you will find a very good uptrend then a pullback that has stopped for the first time just above 200 EMA and then it gave a very good high making new swing high then it corrected down into the last reversal area which we have marked as a demand zone and there 200 EMA is also acting as a support so we have a very good cluster of supports there,
At that time you will strike and place your buy orders.
I hope you have a good Clarity on this Setup, simple and actionable with a good price action understanding.
Hit the Boost Button & Comment down your Doubts, Queries and ideas
Keep Learning,
Happy Trading.
Strategy

BUY TODAY SELL TOMORROW for 5% - BTST STOCK OPTIONDON’T HAVE TIME TO MANAGE YOUR TRADES?
- Take BTST Stock Option trades at 3:25 pm every day
- Try to exit by taking 4-7% profit of each trade
-Resistance Breakout in ASIANPAINT
BUY TODAY, SELL TOMORROW for 5%

Option Trading Advanced StrategiesA. Option Buyer
The buyer pays a premium to purchase a call or put.
Rights: Has the right, not the obligation, to exercise the option.
Risk: Limited to the premium paid.
Reward: Potentially unlimited (for calls) or large (for puts).
B. Option Seller (Writer)
The seller receives the premium upfront.
Obligation: Must fulfill the contract if the buyer exercises it.
Risk: Very high (sometimes unlimited).
Reward: Limited to premium collected.
Option sellers typically have higher probability strategies but higher margin and high risk.

Difference btw Beginner, Pro and Full time Traders ( Mtfa view )In this Big 20 minutes video, I will try to explain the most beautfull conept of Multi time frame analysis from the perspective of 4 different types of trader .
Charts used are older than 3 months

NZDJPY – Imbalance + Liquidity Sweep + Mean Reversion SetupNZDJPY recently took out a major liquidity level around 90.907, sweeping the equal lows resting below that zone. This sweep created a fake breakout of structure, indicating that the downside move was engineered to capture liquidity rather than continue lower.
After the liquidity grab, price immediately reversed back inside the previous range, showing rejection from the sweep level. This confirms a liquidity sweep + BOS failure, a strong signal that the market is shifting direction.
Price is now correcting back toward its mean value, reacting to the inefficiencies left behind. There is a clear imbalance zone above, and price is actively rebalancing that inefficiency.
Furthermore, NZDJPY has an equilibrium structure near 90.20, which acts as a magnet for price during mean reversion phases. This equilibrium zone aligns with the discounted area of the current micro-range, creating a high-probability retracement target.

Trading view, Mountains, Back testing strategy & New yearHappy new year to the Trading view Family, Wishing everyone a strong Year Ahead and in green .
Keep back testing and learning .

Learn a NEW Trading Strategy before 2026 StartsI make educational content videos for swing trading - in this video I am showcasing a new strategy with market structure - trigger points and activation .
Charts used are 3 months or older for Backtesting only
Happy New Year to everyone .

USDCAD Trade Description – Liquidity Sweep + Discount Rejection USDCAD created a clean sell-side liquidity sweep below the previous low near 1.3700, taking out resting liquidity and tapping into a higher-timeframe discount zone.
After the sweep, price showed a sharp rejection wick, signaling absorption of sell orders and a potential reversal. The market then broke structure to the upside on lower timeframes, confirming a shift in momentum.
Price retraced back into the refinement zone / mitigation block, aligning perfectly with:
✔ Discount pricing
✔ Liquidity grab below the equal lows
✔ Rejection from a demand zone
✔ Bullish displacement following the sweep
This offered a high-probability long setup with entry near the mitigation block, stop below the sweep low, and targets toward the premium zone around 1.3780–1.3800.
The trade idea is based on price reverting back to its equilibrium after removing inefficient lows and collecting sell-side liquidity.

INFY | Weekly Bullish Options Setup | 30 Dec ExpiryTrade Structure:
• Sell 1640 PE
• Buy 1600 PE
• Defined-risk bull put spread
Why this setup works for NSE:INFY
INFY is showing a clear recovery from the lower band with improving momentum. RSI has turned up from the mid-zone and ROC is trending higher, suggesting strength is building rather than fading.
Price holding above the 1620–1640 support zone keeps downside limited, while steady IV makes short-premium structures efficient for the week.
View
Moderately bullish — expecting INFY to hold above support and grind higher.
This video is for education only. It’s not financial advice or a recommendation to trade.
#INFY #NiftyIT #WeeklyOptions #OptionsTrading #IndiaFNO #BullPutSpread #OptionSeller #PriceAction #NSEStocks #MarketAnalysis

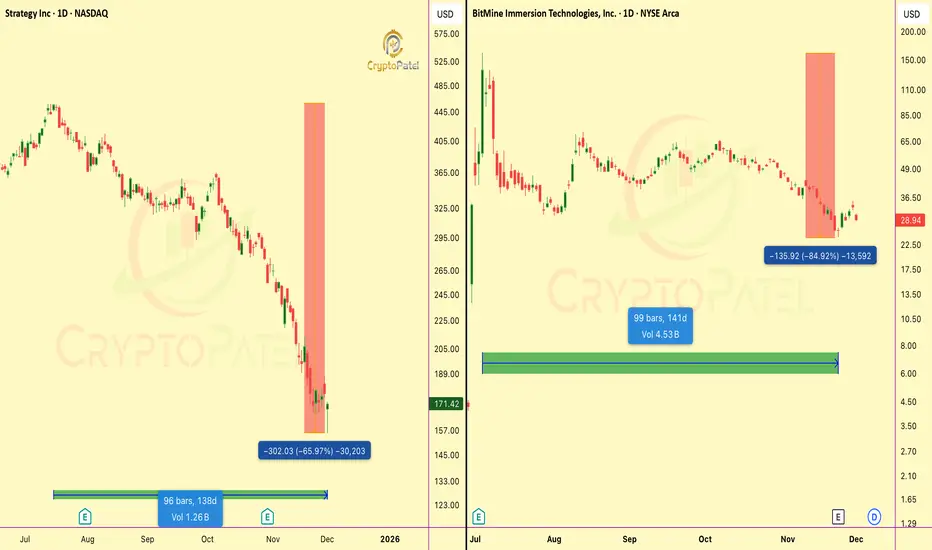
TOP TREASURY COMPANIES BLOODBATHTOP TREASURY COMPANIES BLOODBATH
👉 NASDAQ:MSTR : -64% from ATH ($457→$156) ( BITCOIN TOP HOLDER)
👉 AMEX:BMNR : -82% from peak ($161→$25) (ETHEREUM TOP HOLDER)
Is this capitulation or just the beginning?
NFA & DYOR
Introduction to Futures HedgingUnderstanding Futures Contracts
A futures contract is a standardized legal agreement to buy or sell an asset at a predetermined price at a specified future date. These contracts are traded on organized exchanges, ensuring liquidity, transparency, and regulatory oversight. The underlying asset in a futures contract could be a physical commodity such as crude oil, wheat, or gold, or a financial instrument like an index, bond, or currency.
Futures contracts have key characteristics:
Standardization: The contract specifies the quantity, quality, and delivery date of the underlying asset.
Margin Requirements: Traders must maintain a margin—a fraction of the contract value—to enter into futures positions.
Mark-to-Market: Gains and losses are settled daily based on the contract’s market value.
Leverage: Futures allow traders to control large positions with relatively small capital, magnifying both potential gains and losses.
These features make futures contracts ideal tools for hedging because they provide predictability and protection against price volatility.
The Concept of Hedging
Hedging is the practice of taking an investment position in one market to offset potential losses in another. In essence, it acts like insurance: while it may limit potential profits, it also minimizes exposure to losses. There are two main types of hedging:
Long Hedge: Used when a business anticipates purchasing an asset in the future and wants to lock in the current price to avoid rising costs.
Example: An airline expects to buy jet fuel in six months. To protect against rising fuel prices, it can buy futures contracts now at the current price. If fuel prices rise, the gain on the futures contract offsets the higher cost of purchasing fuel in the future.
Short Hedge: Used when a business holds an asset and wants to protect against falling prices.
Example: A wheat farmer expects to harvest in three months. To avoid losses if wheat prices fall, the farmer can sell wheat futures contracts now. If the price drops, the profit on the futures contract compensates for the lower market price of the physical wheat.
By employing hedging strategies, both buyers and sellers can stabilize cash flows and plan their operations with more certainty.
Importance of Futures Hedging
Risk Management: The primary objective of futures hedging is to manage price risk. Businesses in agriculture, energy, metals, and finance frequently use futures to minimize the impact of adverse price movements.
Price Discovery: Futures markets facilitate price discovery, reflecting expectations of supply and demand. Hedgers benefit by gaining insight into future price trends.
Financial Stability: Hedging provides stability to earnings and costs. For companies with significant exposure to commodity or currency fluctuations, this stability supports strategic planning, investment, and growth.
Speculation Reduction: By hedging, companies avoid excessive exposure to speculation-driven market movements, focusing instead on their core business operations.
Enhanced Creditworthiness: Companies with effective hedging programs are viewed as financially prudent by lenders and investors, improving access to capital.
Mechanics of Futures Hedging
Hedging with futures involves several steps:
Identify the Exposure: Determine which assets, commodities, or financial instruments are exposed to price risk.
Select the Appropriate Futures Contract: Choose a futures contract that closely matches the underlying asset in terms of quantity, quality, and timing.
Decide the Hedge Ratio: The hedge ratio determines the number of futures contracts needed to offset the risk. Perfect hedges are rare; often, partial hedges are employed to balance risk reduction and cost.
Enter the Futures Position: Buy or sell futures contracts depending on whether a long or short hedge is appropriate.
Monitor and Adjust: As market conditions change, hedgers must monitor their positions and adjust contracts to maintain effective risk coverage.
Close or Offset the Hedge: Futures contracts can be offset before expiration by taking an opposite position or allowed to expire if physical delivery aligns with the hedger’s requirements.
Examples of Futures Hedging
1. Agricultural Hedging:
A corn farmer expects to harvest 10,000 bushels in four months. Concerned about falling prices, the farmer sells corn futures contracts now. When harvest time arrives, even if the market price has dropped, the farmer’s futures gains compensate for the lower sale price, ensuring financial stability.
2. Corporate Hedging:
A multinational company expects to receive €5 million in payments in six months but operates primarily in USD. To protect against EUR/USD exchange rate fluctuations, the company sells euro futures contracts. If the euro depreciates, gains on the futures offset the reduced dollar value of the payment.
3. Commodity Hedging:
An airline hedges against rising fuel costs by buying crude oil futures. If oil prices increase, the gain on the futures contracts compensates for higher fuel costs, helping maintain profitability.
Advantages of Futures Hedging
Predictable Cash Flows: Hedging reduces uncertainty in revenue and costs.
Flexibility: Futures can be tailored to different commodities, currencies, or indices.
Liquidity: Exchange-traded futures offer easy entry and exit.
Leverage: Efficient capital use allows risk management without tying up large amounts of money.
Transparency: Prices are visible and regulated, reducing counterparty risk.
Limitations of Futures Hedging
Basis Risk: The futures price may not move perfectly in line with the underlying asset, resulting in imperfect hedges.
Cost: Margins and transaction fees add to the cost of hedging.
Limited Profit Potential: Hedging locks in prices, reducing the opportunity to benefit from favorable market movements.
Complexity: Understanding contract specifications, hedge ratios, and market dynamics requires expertise.
Over-hedging Risk: Using excessive futures positions can create unintended exposure and losses.
Conclusion
Futures hedging is a vital risk management tool in modern financial and commodity markets. It allows businesses and investors to stabilize cash flows, plan effectively, and mitigate losses arising from adverse price movements. By understanding the mechanics, advantages, and limitations of futures contracts, market participants can use hedging strategies to navigate volatile markets with confidence. While futures hedging does not eliminate risk entirely, it transforms unpredictable market movements into manageable financial outcomes, fostering greater stability and strategic decision-making.
In an increasingly globalized and interconnected economy, the role of futures hedging has expanded beyond traditional commodities to include financial instruments, currencies, and indices. Companies, investors, and financial institutions that employ well-structured hedging strategies are better positioned to withstand market shocks, protect their profitability, and achieve long-term growth.
MicroStrategy Broken 55-SMA so Will Bitcoin follow the Same ?NASDAQ:MSTR Crashes Below 55-Week SMA
History shows: MicroStrategy weakness = early CRYPTOCAP:BTC top warning.
▶️ NASDAQ:MSTR bottom?: ~$115
▶️ CRYPTOCAP:BTC possible floor: ~$75K
Bitcoin is still ready for a new crash if it follows NASDAQ:MSTR below its 55-SMA.
BTCUSDT is at a critical point. Watch, learn, and act & Follow for high-value market updates.
NFa & DYOR

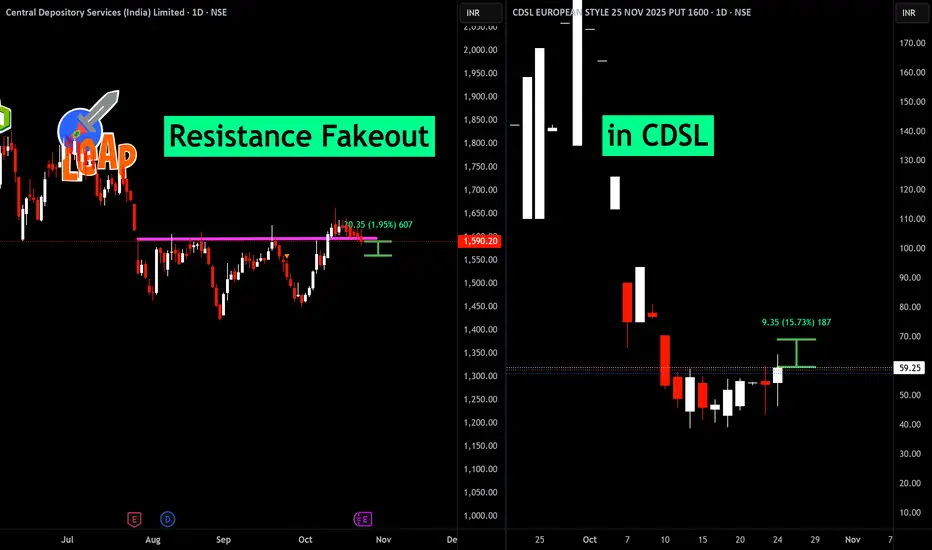
Resistance Fakeout in CDSLAfter a persistent rally, Central Depository Services (India) Limited approached a significant resistance zone near 1,590.20. The initial breakout attempt saw price closing above resistance, but follow-through was absent as sellers quickly regained control. This resulted in a classic false breakout or failed breakout pattern, with price slipping back below the resistance level and triggering a pullback.
False breakouts at key resistance happen when bullish momentum is not sustained, often trapping late buyers and prompting profit-taking. As evident here, the failed breakout signals possible short-term weakness and warrants caution for fresh longs unless the stock can convincingly reclaim and hold above the former resistance. Short-term traders may look for downside opportunities until renewed strength is visible above 1,590.20.
Risk management is essential in such setups as volatility around failed breakouts can be high. Monitor for support at lower levels and watch price behavior around previous resistance for directional clues.
PGEL: Suggest Momentum ShiftPG Electroplast Ltd. (PGEL) has recently shown signs of emerging strength after a prolonged phase of consolidation. Over the last two trading sessions, the stock has demonstrated upward momentum, suggesting a possible attempt to break out of its range-bound structure. This observation is supported by several technical factors:
1. Moving Averages & Volume Dynamics
The stock has successfully closed above the 20-day EMA, indicating short-term bullish sentiment.
It is currently trading near the 50-day EMA, although it has not yet closed above this level. The recent price movement has been accompanied by increased trading volume, which may reflect growing market participation.
2. Change of Character (CHOCH)
The break above the 20-day EMA, despite the price not closing above the 50-day EMA, may signal a CHOCH. This is often interpreted by technical analysts as a potential shift in trend direction, particularly from bearish to neutral or bullish.
3. RSI Momentum
The RSI has moved above the 60 level, suggesting strengthening momentum. This level is typically viewed as a transition zone between neutral and bullish conditions.
4. MACD Signal
A bullish crossover on the MACD indicator has occurred on the daily timeframe. This crossover may indicate a potential shift in momentum, especially when supported by price structure and volume.
Breakout Confirmation Level:
A sustained close above ₹597 could be interpreted as a breakout from the consolidation zone. If this level is cleared with volume support, the next potential resistance may lie near ₹712 , based on historical price action. The lower boundary of the recent consolidation zone, around ₹494 , may act as a support level. This area could be monitored for potential retests or invalidation of the breakout attempt.
Disclaimer: This analysis is intended for educational and informational purposes only. It does not constitute investment advice or a recommendation to buy, sell, or hold any financial instrument. Market participants are encouraged to conduct their own research and consult with a licensed financial advisor before making any investment decisions.

Cup and Handle Breakout and Retested in NYKAANykaa triggers a textbook cup-and-handle breakout on the daily chart, followed by a clean retest that flips resistance into support and signals continuation potential toward the measured move. The 28 Oct 2025 257.5 CE premium surges alongside, reflecting bullish momentum but remains sensitive to decay if price slips back below the neckline

Fibonacci Tool: Why It’s NOT a Trading StrategyMost traders wrongly treat Fibonacci as a standalone strategy—it’s just a support tool, not a secret pattern for auto profits. Discover how real pros use it for bias, not blind buys, and avoid the retail trap

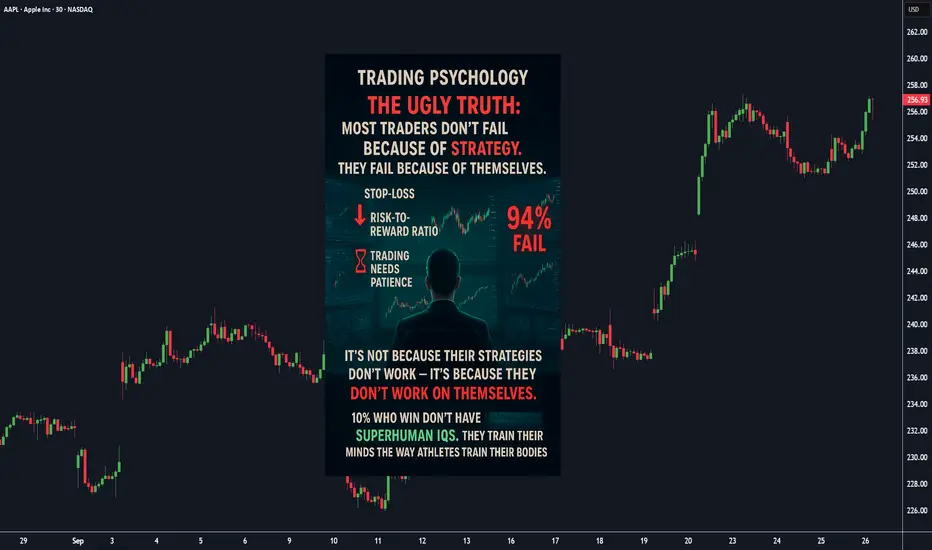
Psychology, Why 90% of Traders Fail (And How to Be the 10%)⚡ The ugly truth: Most traders don’t fail because of strategy. They fail because of *themselves* . It’s NOT bad strategies, it’s bad psychology.
📉 Here’s the real story 👇:
We know about stop-losses.
We know about risk-to-reward.
We know patience matters.
Imagine this: You’ve planned your trade. Price goes against you. Suddenly, your brain whispers:
👉 “Just hold a little longer.”
👉 “Double your position, you’ll recover.”
👉 “Skip the stop-loss this time, it’ll bounce back, praying it turns back.”
NASDAQ:GOOGL
Sound familiar?
That inner voice has blown more accounts than any chart pattern ever did.
🧠 “It’s not because their strategies don’t work—it’s because *they don’t work on themselves*.
✅ The 10% who wins don’t have superhuman IQs . They *train their minds* the way athletes train their bodies.
Here’s how you can upgrade yourself today :
1️⃣ **Detach From Money** → Don’t measure success by today’s P&L.
Measure it by *following your plan*. Consistency is the real wealth.
2️⃣ **Write Your Rulebook 📘** → Define your entries, exits, and risk rules. Print it. Stick it near your screen.
No match = no trade. (Yes, it’s boring. That’s why it works.)
3️⃣ **Journal Your Trades** → Every. Single. Trade. Wins and losses. How did you feel?
Why do you enter?
after doing this, you’ll start to * see your patterns * —and they’ll expose your weaknesses too..
🎯 Success in trading isn’t about predicting/beating the market. It’s about controlling *yourself*, beating your own impulses.
💬 Question for you: Which habit is killing your trades?
NASDAQ:MSFT
If you could fix just ONE habit right now:— what would it be?
Which one would change your results the most?
1️⃣ Overtrading 🔂
2️⃣ Revenge Trading ⚔
3️⃣ Ignoring Risk ⚠
4️⃣ chasing losses 🏃➡️
5️⃣ No 📘rulebook/📰Journal
💬 Comment below ⬇️
I'll post my new content accordingly.
Happy Trading and Investing!
Regards:
@TradeWithKeshhav
Master Inside Bar Strategy with this Twist ( Wtf edition )Learn how to create a simple strategy and simply backtest it on Trading view .

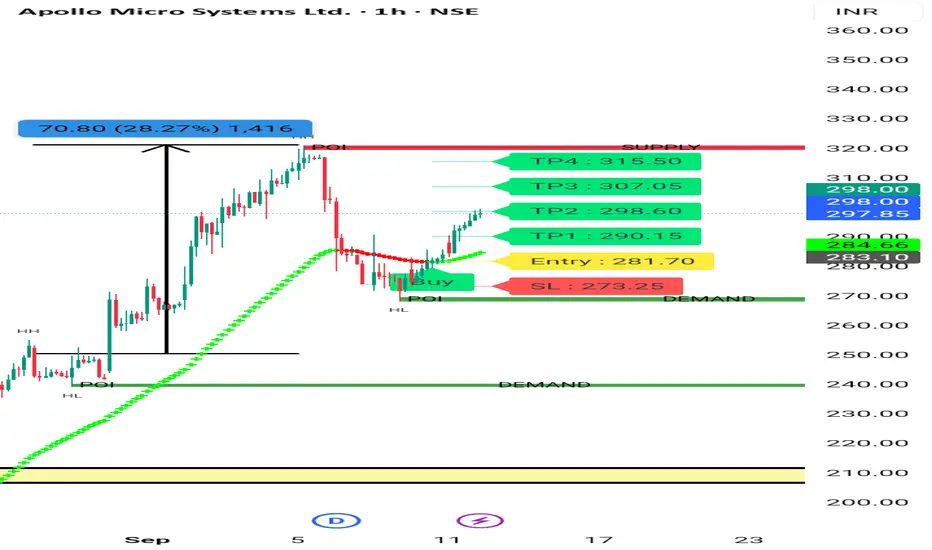
Apollo Micro System Again Upmove Apollo Micro Systems Earlier given near 250. Now Gain it's going Up after Taking Retracement. It's good sign. We can Enter at Cmp With 3 -5 % Stoploss.
It's in High Momentum.
Want to Learn more - how to Catch Such Stocks. Visit my Tradingview Profile .
Entry near 300 tgt 320 - 330 - 350 .
SL 5%
Zota Healthcare Higher High Pattern Zota healthcare moving Up in a pattern . It's bullish Since many Months. You can Study Chart of last 2 Year. It's moving up in Pattern with Retracement. So it's very good.
You can make 5 -10% Easily in this Stocks. Keep SL 5%
It may be in Consolidation before moving up as u see same happened in last some days.
But it may move up with volume.
Visit my Tradingview Profile for more information.
Consult your financial advisor before making any position in stock market.

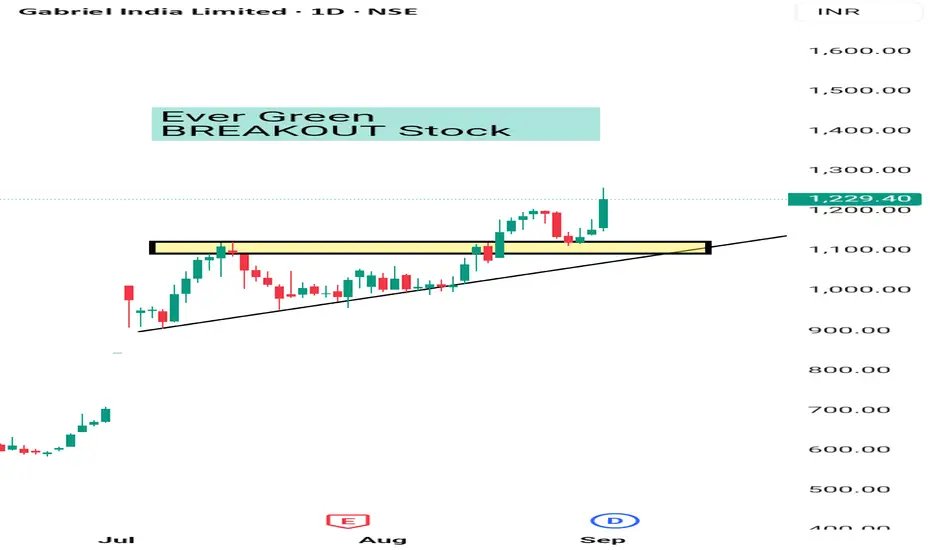
GABRIEL INDIA BULLISH CHART Gabriel India is a Strong Fundamental Company in Auto Component Sector . It's Technically also Breakout. It's a Uptrend Stock And moving Up with Sector and on basis of Gst Cut . Good bet for swing trading as well as long term . In swing trading u can expect 5 -6% move and in long term 20-30% move in next 6 months . No buy sell Reccomendation just for educational purposes only.
Always consult your financial advisor before making any position in stock market.
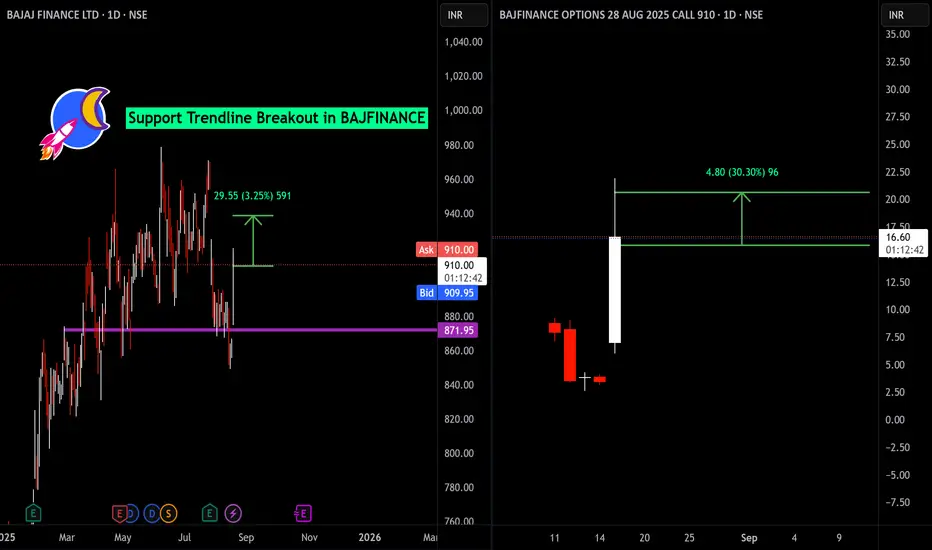
Support Trendline Breakout in BAJFINANCEBAJFINANCE has delivered a strong support trendline breakout, closing at ₹909.60 (+5.59%). Price action confirms bullish momentum above the ₹872 support, with a measured move target of ₹29.55 (3.25%). Notably, the 910 CALL option for 28 AUG 2025 surged 378% to ₹16.50, showing aggressive call buying and aligning with the spot breakout. This synchronization between spot and derivatives indicates robust upward sentiment. Traders may consider maintaining a bullish bias while managing risk below the breakout level. Monitoring volumes and options activity is essential for trend confirmation. This analysis is for educational purposes only.
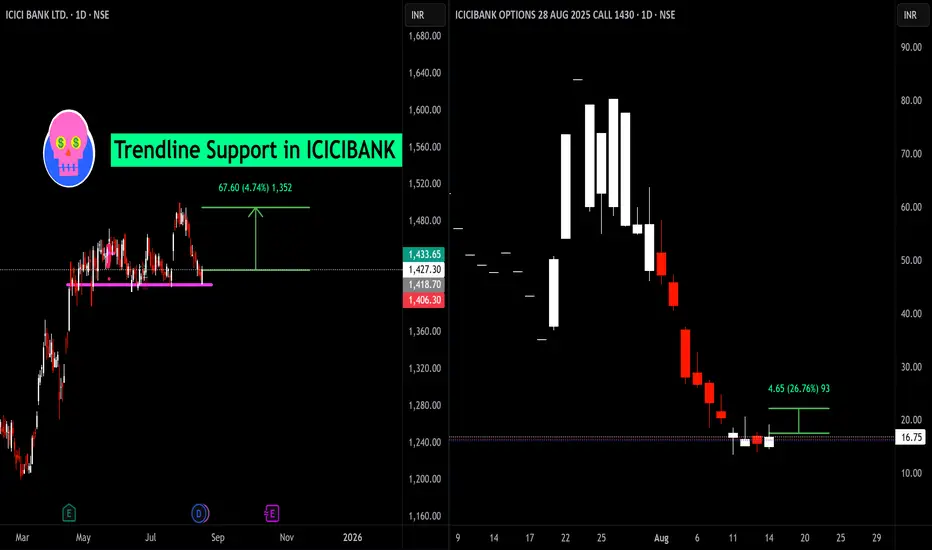
Trendline Support and Options Reaction in ICICI Bank📈 ICICI Bank at Major Support!
ICICI Bank is testing a crucial trendline support zone around ₹1,418–₹1,427 after a lengthy pullback. Historically, this level has held strong, showing multiple bounces — making it a key area for traders to watch.
Support Level: ₹1,418–₹1,427
Potential Upside: The chart highlights a recovery zone towards ₹1,433 and beyond, with a bounce of ₹67.6 (approx. 4.74%) possible if support holds firm.
🟢 Options Perspective: 1430 CE (August Expiry)
The ICICI Bank 1,430 August call option has shown significant volatility:
Current Premium: ₹16.75
Recent Change: +₹4.65 (+26.76%) on a single session!