BUY NATIONAL ALLUMINIUMNational Aluminum gives all time high breakout and than retest the level which become strong support and stoploss for a trade, so long on national aluminum or hold as a trade as well long term investment with strict stoploss. Do your own research this is only for education purpose not any buy or sell recommendations. i am not expert in market because market is the king. Enjoy the Ride.
Strongbuy

BUY HITACHI ENERGY INDIA LIMITEDHitachi energy India limited on strong support level as well as breakout on candlestick pattern, very small size stoploss for good amount of reward, so make a position current price and wait for fun in few days. Go long and enjoy. No Guaranteed return assured.

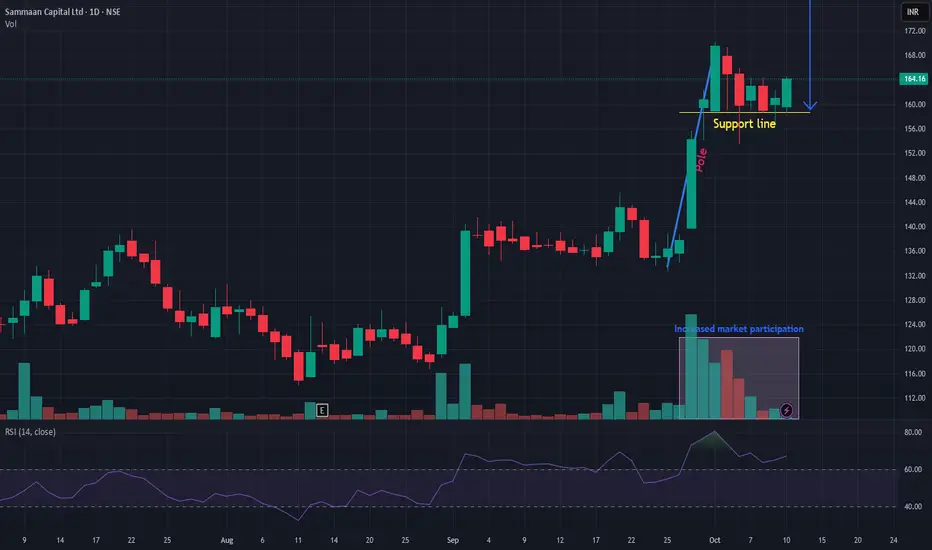
SAMMAANCAP SAMMAANCAP is showing very good strength and currently available at low risk. Forming VCP pattern. Seems like currently facing from sideways and may come out of the range and will take a new ride above resistance line. Risk-reward quite in favor. Keep it in a watchlist.
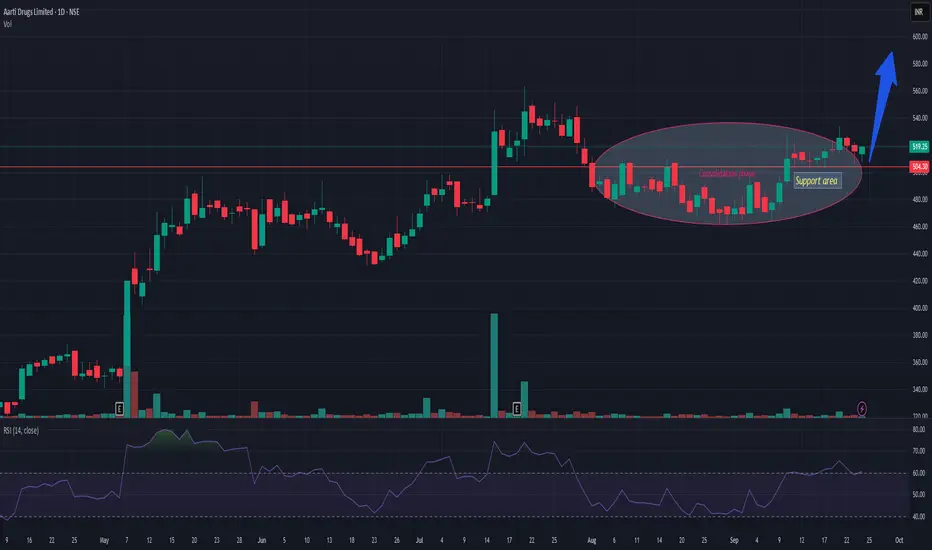
AARTIDRUGSAARTIDRUGS is trading in long consolidation zone with dried volume. Support zone is near 495-500. Currently trading near 515-17. Once it gets market participation then the probability of resuming continuation of uptrend is very high. Risk reward is quite in favor. Keep it in your watch list.
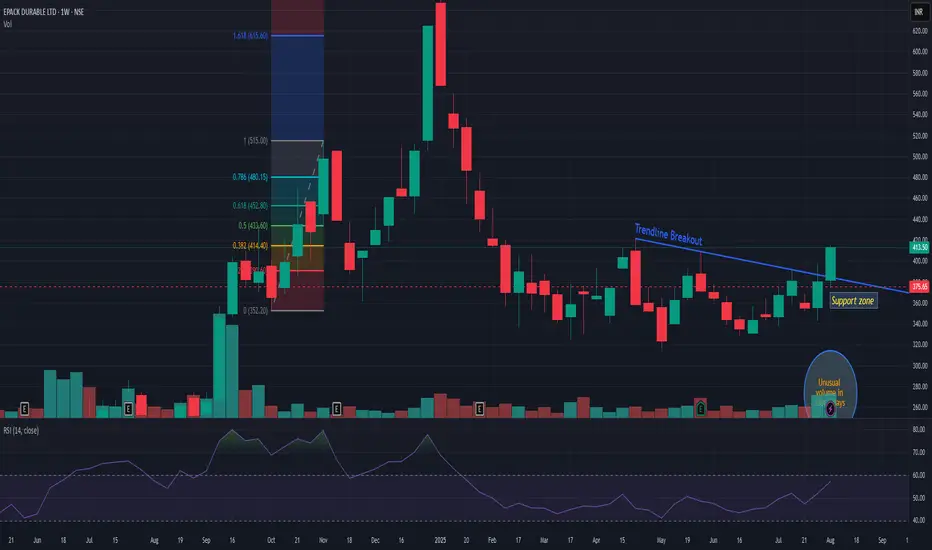
EPACKEPACK showing good strength after long bearish and then consolidation zone. It has been consolidating since February after steep fall from 660 levels. Now 390 is very strong support zone. So closing below it may change my view. On upper side I can see 510/85 resistance zone.
ROTOROTO is showing good strength and currently trading above previous resistance line. It is in to consolidation phase. It seems like accumulation has been observed in recent sessions. Now as long as it is closing above 279 then ROTO is very strong and available at very good risk-reward. One may expect 12% to 21% in next rally once it comes from consolidation phase.

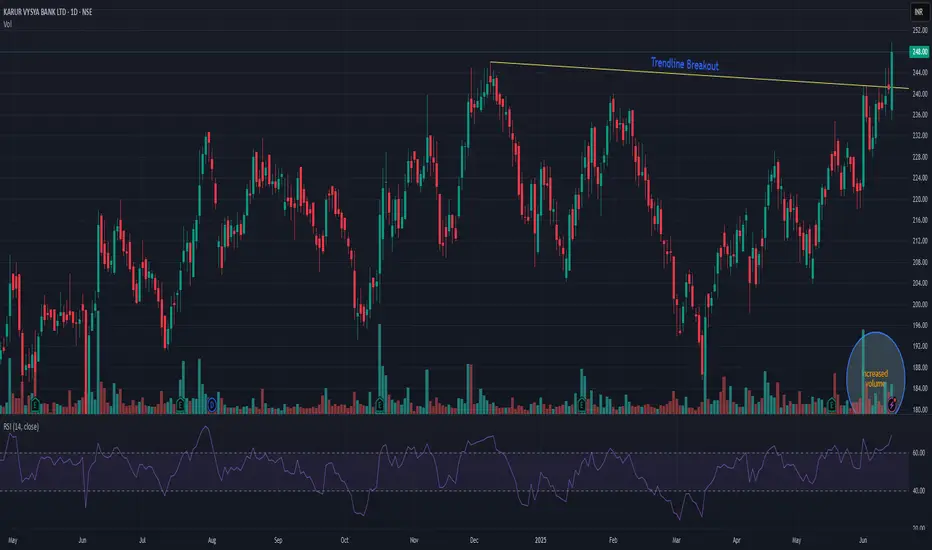
KARURVYASYAKARURVYSYA has given trend-line breakout. The stock is continuously making higher high and higher-low pattern with increased market participation. Also it crossed previous resistance level as well. It seems like it will continue its momentum ride. The stock is trading at ATH. Closing below 220 may change my view. It may face resistance nr 285 levels.
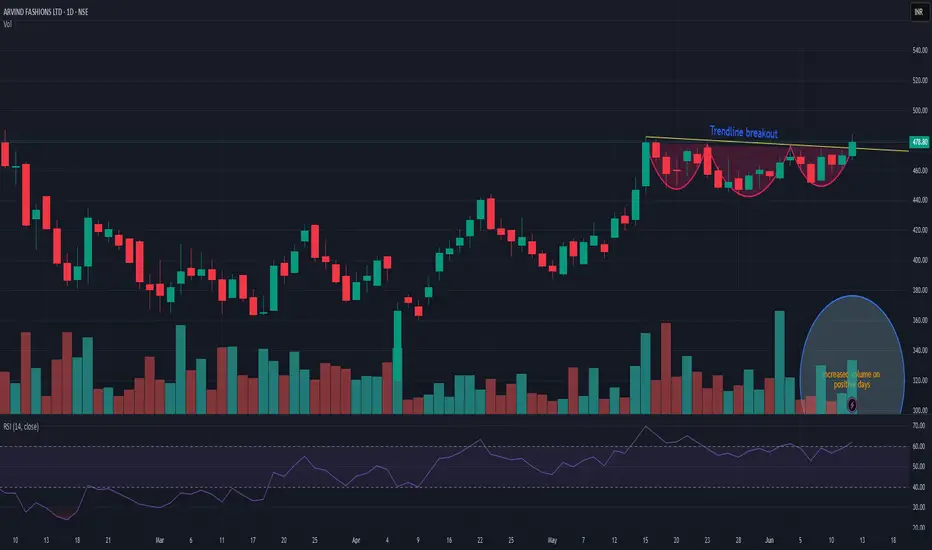
ARVINDFASNARVINDFASN showing very good strength on this negative days as well and currently trying to coming out of consolidation. As long as it is closing above 440 then dips are good to accumulate. Positive momentum may fetch the stock up to 600 in near term. And next trigger level can b above 485. Wait for the perfect entry point.
ETHOSLTDETHOSLTD has given breakout after so long and after many attempt. It may face bit resistance near 3050 level but once it crosses it may take a new ride. It has a potential to go up to 3500 and above that it may enter in to uncharted area. If I talk about fundamental event then on 12 june it will be split by 1:1. So after split we may see volume bounce as well which may lead to start a momentum rally. Now if I talk about long term chart ie weekly/monthly then on both format it is showing very good strength. I won't be surprised even if it trades above 4400 levels. My view will be changed if it goes below 2650.

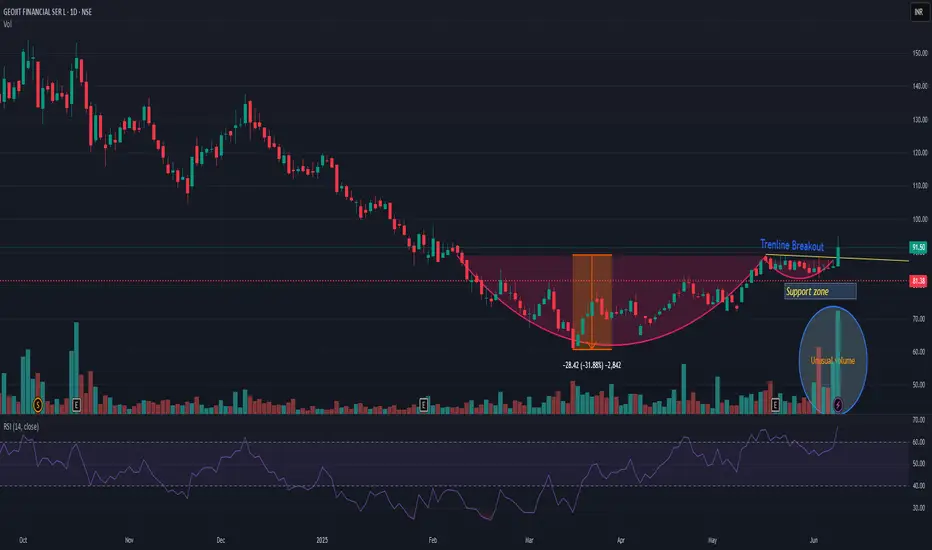
GEOJITFSLGEOJITFSL showing strength and has given short term breakout. Cup and handle pattern has also been observed. Now if I see pattern target then 25-30% up side is possible. Since September highest volume also observed today. My view will be changed if it closes below 81. Risk reward is quite in favor.
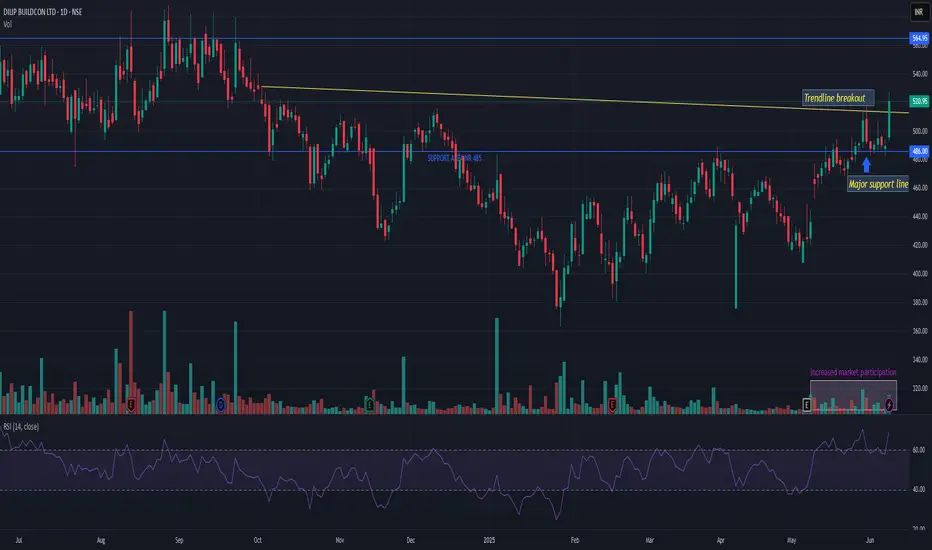
DBLDBL showing strength after so long. Now fresh volume may push it towards all time breakout. Near 560 level it may face resistance but if in case it successfully sustains above that then it has a potential to do wonder in span of 6-12 months. It can go up to 775 to ATH even. Fundamentally too showing good strength in recent quarters. All the factors are currently supporting. My view will be changed if it breaks 480 and closes below it. Track it closely.
Trend Continuation in SANATHAN TEXTILES LTDNSE:SANATHAN
Timeframe - 4H CHART 📊
Base after Breakout 📈
An early entry above - @473 will make Good good RR.
Stock is maintaining clear HH HL structure.
And Recent Down candles are on very low Volume signals sellers getting absorbed.
Keep on radar. ⏳
Keep Learning, Happy Trading.

DYCL STRONG BREAKOUT CANDIDATENSE:DYCL
Cable and WIre Industry Stock Good for Swing
#DYCL Strong Conviction - Increasing day by day.
Study the Price and Volume action closely.
Spikes are grabbing supplies from top and low volatility closing showing - accumulation.
Today price respected the previous day close and formed a higher high higher low structure.
All Major Levels are marked on chart.
Keep Learning,
Happy Trading.

ITI on the Rise: Catch the BreakoutThe chart of ITI provides delineates critical price thresholds that signify breakout points, along with specific support levels that serve as indicators of where buying interest may manifest.
Additionally, the chart highlights regions likely to act as ceiling points for future price ascensions, allowing for informed decisions on entry and exit strategies.
Disclaimer: The information contained in this technical analysis report is intended solely for informational and educational purposes. It should not be interpreted as financial advice or a recommendation to buy or sell any security. Investors are strongly encouraged to conduct their own research and consult with a qualified financial advisor before making any investment decisions.

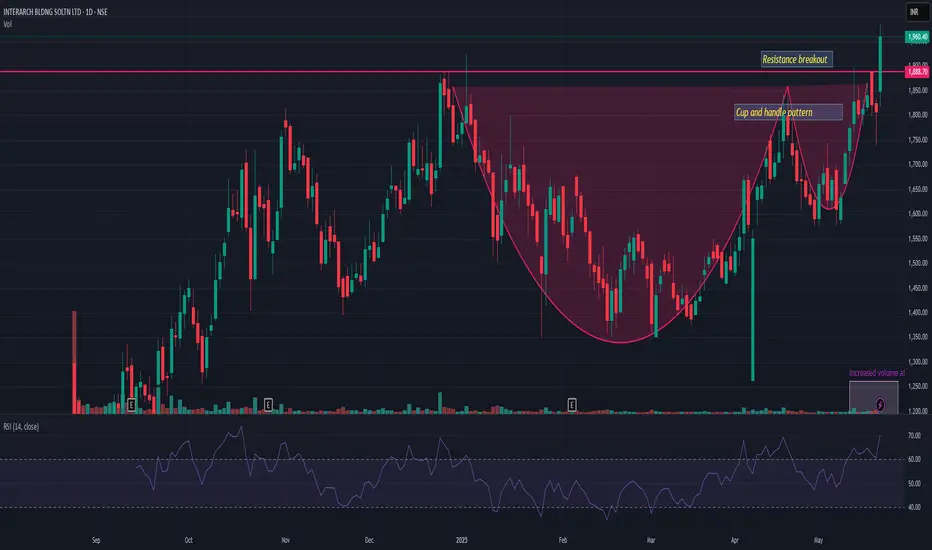
INTERARCHINTERARCH has given resistance breakout with decent volume. Posted very good result on both front QoQ and YoY. Cup and handle pattern also observed and given recent breakout of the same. Closing below 1750 may change the view. And on upper side pattern resistance may be possible near 2300. Looks very strong for momentum
UNIONBANKUNIONBANK has given inverted H&S breakout with decent volume. Last quarter result also beat estimates. So there is fundamental support as well. And in recent days we have seen strong momentum in PSU banks. So UNIONBANK has a potential give very good return provided that it closes above 130 in coming days.

AKUMSAKUMS seems stronger and given triangle breakout. Volume is also very decent as its just 1st hour of trading and almost nr previous day volume. We may see momentum rally nearing 12-15% from here as long as its closing above this trendline it may continue to outperform. Risk reward is quite good. Result is on 26th may. Keep it on radar

IDBIIDBI has crossed multiple resistance level with huge volume. Currently trading above last 8 months. Above this, momentum inn PSU bank has been observed and out of all these banks IDBI seems too strong. 82 seems good support and on upper side it may trade nr 115 levels soon. Keep it on radar.

VPRPLVPRPL formed strong support near 288-90. Seems too promising for its new ride. Keep it on radar.

Easy 20% return with Piccadily Agro IndustriesBSE:PICCADIL looks perfectly poised to give a solid 20% return to investors with a short term horizon.
Technicals: When we see the candlestick chart on a daily basis, it is trading at 750 which lies in between its nearest support at 700 and nearest resistance of 780. The MACD indicator points in the direction of an uprise with a healthy positive value.
Fundamentals: BSE:PICCADIL is a very fundamentally strong stock. It has high ROCE and ROE of 29.6% and 30.6% respectively. BSE:PICCADIL QoQ sales have increased by 62% and QoQ profits have increased by 121%. This shows it has got healthy growth going forward. Also its revenue mix is starting to be dominated by the distillery segment over its sugar segment. This showcases BSE:PICCADIL has diversified in the right direction, in turn unlocking more value for its shareholders.
Trade Setup: Buy BSE:PICCADIL when it hits 780, place a stop loss at 720 and a sell order at 960.

VISHNU - Breakout after 2+ YearsVISHNU - Breakout in weekly timeframe after 2+ years. The company has broken out of a range and sustaining the breakout level the last few weeks.
Additionally, the company has strong fundamentals with a low PE when compared to the industry. The FIIs have also increased their position in the company. Overall, there is a good upside potential in the company in the coming weeks, months.

GRANULES INDIA - Downtrend BreakoutGRANULES INDIA
1) Time Frame - Monthly.
2) Previous month candle strong breakout follwoed by current month cancle close with strong rejection / Retracement of the previous breakout & looking bullish.
3) Downtrend strong triangle pattern breakout.
4) Next target would be Previous All Time High - 437.95 followed by the primary trend target / resistance at around 192 in the long term.
5) Recommendation - Strong Buy

Trident 37.75 - Profit Making opportunity (30% to 50%) or moretrident has been consolidating for while and it was in sideway trend.
by looking at volumes and deliverable quantities stock is expected to move upside.
it shows buyer's are interested to buy this stock and its shows strong buy signal.
1. if stock breaks 42 we might see it move up to Rs 51
2. Best buy around 37 to 38 stoploss 35.50
