Bitcoin Weekly Chart – Structure Still Intact, Patience is PowerHello Everyone, i hope you all doing good, Lets discuss about bitcoin. After weeks of consolidation and volatility, Bitcoin is back at its rising support zone, where strong hands usually step in. The structure on the weekly chart continues to hold higher lows, a clear sign that the broader trend remains bullish despite short-term pullbacks.
Technical View
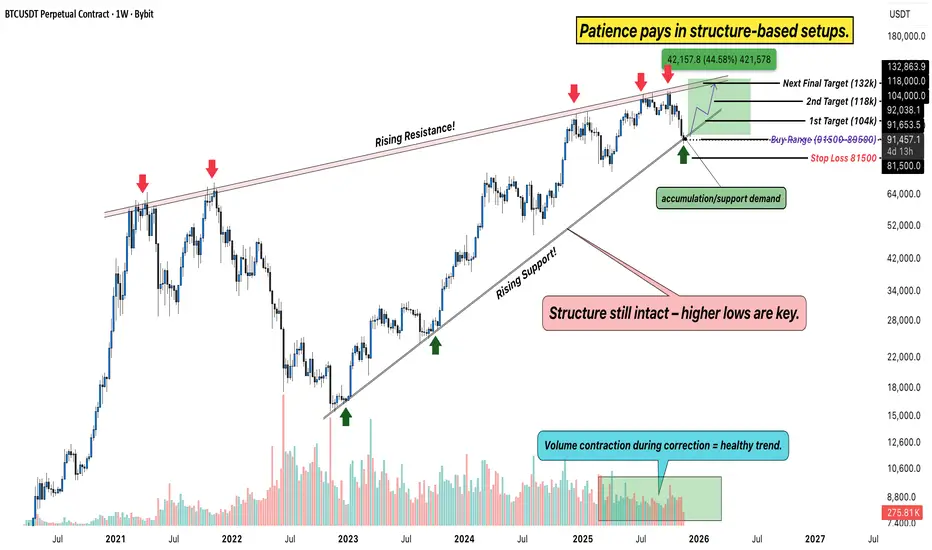
Rising Channel: BTC continues to move within a rising channel, with clear reactions from both support and resistance levels. The current price is testing the buy range between 81,600–89,500, an area that has historically acted as a high-probability reversal zone.
Resistance Levels: Key upside levels to watch are 104K, 118K, and the final target zone near 132K, the same rising resistance that rejected price multiple times in past cycles.
Support: As long as BTC stays above 81,500, the structure remains valid. A weekly close below this zone would invalidate the bullish bias.
Volume Behavior: Notice how each correction comes with lower volume, a healthy sign of accumulation, not distribution.
Big Picture
This phase often shakes out emotional traders while rewarding the ones who trust structure and time. If Bitcoin holds this zone and begins to bounce, it could mark the start of the next major wave, potentially aiming for a new cycle high in the coming months.
Rahul’s Insight: Big moves don’t start with hype, they start with quiet structure and strong conviction. The crowd reacts; the disciplined trader prepares.
Analysis By @TraderRahulPal | More analysis & educational content on my profile.
Structuretrading
swing , positionalIn monthly time frame stock is in uptrend ,HL structure is intact. Which means
stock is in correction of monthly Time frame
in weekly bullish flag is in formation.
So we will wait for structure change and clear breakout of flag pattern In weekly time frame.
IF BO OF LH SUSTAIN, ONE CAN LOOK FOR BUY ON RETRACEMENT. WITH SL OF LAST LL.
OR
U CAN CHECK FOR DAILY TF IF THERE IS A HL STRUCTURE BEFORE BO , CAN USE THAT HL FOR SL ON CLOSING BASIS

A good opportunity in NESTLE INDWait for the break out or watch for buying opportunities above 17809 . After days for consolidation finally on the verge of breakout
Can put a strict SL on 17534 and breakeven the trade if price touches 18141 and book near 18643. Potentially a good risk to reward trade.
Time frame- 1H NSE:NESTLEIND

EURUSD BuyLast week we have broke the descending channel and we had a good daily close. that bullish candle is just an impulse so we will wait for some relief or exhaustion. when it finally breaks above the previous lower high creating short term higher high we would look for an buy. Lets see what happens. #One8_Trader

Crude Oil Short Crude Oil looks like a shorting candidate as it is in a verge of forming Double Top on Daily Chart
