Rising Wedge Formation | Bullish Engulfing💹 BSE Ltd (NSE: BSE)
Sector: Financial Services | CMP: ₹2,678.30 | View: Rising Wedge + Bullish Exhaustion Setup
📊 Price Action:
BSE Ltd witnessed a powerful uptrend from ₹2,020 to ₹2,718, supported by heavy institutional participation and strong price momentum.
The stock recently posted a 20-day volume breakout, followed by a bullish engulfing candle, signaling strong buying strength at lower levels.
However, post this rally, the price structure has developed into a Rising Wedge pattern, indicating momentum exhaustion and potential short-term consolidation.
The recent rejection near ₹3,030 swing high suggests supply pressure building at upper resistance zones, aligning with the wedge’s narrowing structure.
💼 HNI Trade Levels (STWP Setup):
Aggressive Entry: ₹2,678–₹2,718 | Stop Loss: ₹2,425
Low-Risk Entry: ₹2,595 | Stop Loss: ₹2,415
The near-term trend remains upward but stretched.
HNI and swing traders should monitor the ₹2,595–₹2,650 zone closely — this area represents both the 61.8% Fibonacci retracement and the wedge support base.
Sustaining above it will keep the setup active; a breakdown below ₹2,595 could shift the structure into a corrective phase.
📉 Chart Pattern Analysis – Rising Wedge (Bearish Reversal Bias):
The current structure represents a Rising Wedge formation, identified by two upward-sloping, converging trendlines.
This pattern often develops after strong rallies, marking the final leg of an existing uptrend before a corrective phase begins.
In BSE’s case, the wedge indicates that buying momentum is weakening as the range tightens, while volumes remain high — a sign of profit booking within strength.
The confirmation trigger for reversal would be a breakdown below ₹2,595. Until then, the structure remains short-term bullish but with an elevated risk of pullback.
A breakdown could potentially extend retracement toward ₹2,525–₹2,450.
📈 STWP Trading Analysis:
Entry: ₹2,678–₹2,718 | Stop Loss: ₹2,425.50
The breakout candle displayed exceptional strength with a 20.3M volume surge against a 5.65M average, confirming institutional footprints and momentum expansion.
The price is currently sustaining above its short- and mid-term EMAs, with trend alignment visible across the daily and weekly timeframes.
Holding above ₹2,644–₹2,595 (critical Fibonacci and structural zone) will maintain the bullish bias, keeping the setup active toward ₹2,783–₹2,888 in the near term.
A sustained close above ₹2,888 could further extend the move toward ₹3,030, whereas a breakdown below ₹2,595 may trigger pattern invalidation and shift bias toward ₹2,525–₹2,450 support zones.
📈 Candlestick Pattern – Bullish Engulfing at Apex:
A Bullish Engulfing Candle formed on 4 Nov 2025, initiating the final upward leg from ₹2,443 to ₹2,718.
While it reflected strong buying enthusiasm, the placement of this candle near the apex of the wedge signals possible buyer exhaustion.
Such engulfing candles late in a trend often act as final thrust candles, marking distribution zones rather than breakout initiation.
This makes it essential for traders to track whether follow-up candles sustain strength or fade under resistance.
📏 Fibonacci Analysis:
From swing low ₹2,021.50 to swing high ₹3,030.0:
61.8% retracement @ ₹2,644 → Key structural support.
50% retracement @ ₹2,525 → Ideal pullback level.
38.2% retracement @ ₹2,406 → Deeper retracement aligned with wedge base.
The stock currently trades near the 61.8% golden zone, making ₹2,595–₹2,644 a crucial area for short-term trend control.
A close below this range may invite a deeper retracement, while sustained strength above ₹2,678 could revive momentum toward ₹2,888–₹3,030.
🧭 STWP Support & Resistance:
Resistances: ₹2,783 | ₹2,888 | ₹3,059
Supports: ₹2,595 | ₹2,525 | ₹2,406
The ₹2,980–₹3,020 range acts as a weak resistance zone, where mild profit booking or supply pressure may emerge if momentum continues upward.
On the downside, the ₹2,020–₹2,070 belt continues to serve as a strong structural support zone, backed by historical accumulation and institutional demand footprints.
📊 STWP Volume & Technical Setup:
Today’s volume stood at 20.3M shares vs 5.65M average, signaling heavy institutional activity and potential position rotation post-breakout.
RSI remains elevated near 69, while Stochastic (90) suggests short-term overbought conditions — hinting at a likely consolidation phase ahead.
MACD continues to stay in the bullish zone but shows flattening momentum, consistent with the wedge’s tightening structure.
Trend Direction: UPTREND (Weakening) | Volume Confirmation: High with Distribution Bias
🧩 STWP Summary View:
Final Outlook:
Momentum: Strong | Trend: Bullish | Risk: High | Volume: High
BSE Ltd remains structurally bullish but technically stretched after a steep rally and volume breakout. The Rising Wedge formation, combined with the Bullish Engulfing near the top, reflects a maturing uptrend with signs of short-term exhaustion. Holding above ₹2,595 keeps the pattern valid, but traders should remain cautious of volatility and potential profit booking as the structure nears completion.
⚠️ Disclosure & Disclaimer – Please Read Carefully
This post is created solely for educational and informational purposes and should not be interpreted as investment advice or a buy/sell recommendation.
I am not a SEBI-registered investment adviser. All views are based on technical analysis and publicly available market data.
Trading involves significant risk. Always apply risk management, follow position sizing discipline, and consult a SEBI-registered financial advisor before acting on any trade.
Position Status: No active position in (BSE) at the time of this analysis.
Data Source: TradingView & NSE India
💬 Found this useful?
🔼 Give this post a Boost to help more traders discover structured, professional analysis.
💭 Drop your insights — will BSE’s wedge resolve in continuation or correction?
🔁 Share this with your trading circle to promote disciplined chart-based analysis.
👉 Follow for more institutional-style breakdowns blending price action, structure, and volume logic.
🚀 Stay Calm. Stay Clean. Trade With Patience.
Trade Smart | Learn Zones | Be Self-Reliant 📊
Stwpsetup

Bullish Momentum Revival Near Key Support | STWP💹 Aurobindo Pharma Ltd (NSE: AUROPHARMA)
Sector: Pharmaceuticals | CMP: ₹1,138.90 | View: Bullish Momentum Setup
📊 Price Action:
Aurobindo Pharma shows strong bullish momentum after reclaiming key support zones near ₹1,100.
The stock has printed a bullish engulfing candle with institutional-grade volume, signaling a potential continuation of the uptrend.
Price action confirms demand absorption at lower levels with buyers defending the ₹1,080–1,100 zone effectively.
💼 HNI Trade Levels (STWP Setup):
Aggressive Entry: ₹1,138.90–₹1,155.80 | Stop Loss: ₹1,087.35
Low-Risk Entry: ₹1,137.12 | Stop Loss: ₹1,080.02
The STWP HNI Setup reflects a well-defined bullish structure supported by EMA 200 crossover and strong candle confirmation.
Smart money activity is visible through expanding volume footprints and VCP contraction signs fading toward breakout.
📉 VCP Analysis:
Aurobindo Pharma has undergone 112 VCP contractions, forming a tight base before breakout attempts.
Although the current candle is yet to confirm a clean VCP breakout, the setup suggests a pre-breakout stage, aligning with institutional interest.
The ongoing contraction phase combined with a bullish RSI breakout supports accumulation by strong hands.
📈 STWP Trading Analysis:
Entry: ₹1,155.80 | Stop Loss: ₹1,098.70 | Risk: ₹57.10
The bullish structure is reinforced by a 5x volume expansion and a strong buyer-dominated candle.
EMA 200 crossover, MACD bullish alignment, and RSI strength above 52 confirm upside bias.
Holding above ₹1,120 keeps the short-term structure firmly bullish toward ₹1,177–₹1,208 levels.
📏 Fibonacci Analysis:
From the swing low of ₹1,016.10 to the recent swing high of ₹1,208.20 — price currently hovers around the 61.8% retracement zone at ₹1,134.82, a critical Fibonacci pivot.
Sustaining above this level indicates strength and supports the ongoing uptrend.
Fibonacci extensions project targets near ₹1,208–₹1,218 on breakout confirmation.
🧭 STWP Support & Resistance:
Resistances: ₹1,163.13 | ₹1,187.37 | ₹1,218.93
Supports: ₹1,107.33 | ₹1,075.77 | ₹1,051.53
The ₹1,075–₹1,107 zone serves as a strong institutional support, aligning with prior demand clusters.
Weak resistance pockets lie between ₹1,163–₹1,208, opening space for a clean momentum push if price sustains above ₹1,155.
📊 STWP Volume & Technical Setup:
Today’s volume surged to 3.56M vs 1.3M average, confirming high institutional participation.
The chart highlights multiple technical confirmations — a strong EMA crossover, momentum breakout, and volatility expansion supported by a bullish candle formation.
Key momentum oscillators are turning upward, reflecting renewed strength and sustained bullish bias across timeframes.
🧩 STWP Summary View:
Final Outlook:
Momentum: Strong | Trend: Uptrend | Risk: High| Volume: High
Aurobindo Pharma is exhibiting robust institutional footprints with trend confirmation across all major indicators.
As long as the price holds above ₹1,107–₹1,120, the structure remains intact with scope for a short-term move toward ₹1,177–₹1,208.
The bias remains bullish with uptrend continuation potential into the next few sessions.
⚠️ Disclosure & Disclaimer – Please Read Carefully
This post is shared only for educational and informational purposes. It is not a buy/sell recommendation or financial advice.
I am not a SEBI-registered investment adviser; all views are based on technical observation and public market data.
Trading involves risk. Market movements can be unpredictable and may result in losses.
Always perform your own research or consult a SEBI-registered financial advisor before trading.
Position Status: No active position in (AUROPHARMA) at the time of this analysis.
Data Source: TradingView & NSE India
💬 Found this useful?
🔼 Give this post a Boost if you value structured, professional breakdowns.
✍️ Share your thoughts or charts below — let’s learn together!
🔁 Spread this post to help more traders adopt data-driven analysis.
👉 Follow for more clean, institutional-style setups with clarity and discipline.
🚀 Stay Calm. Stay Clean. Trade With Patience.
Trade Smart | Learn Zones | Be Self-Reliant 📊

Aditya Birla Capital | Bullish Momentum with Exceptional Volume 💹 Aditya Birla Capital Ltd (NSE: ABCAPITAL)
Sector: Financial Services | CMP: ₹326.80 | View: Bullish Continuation Setup
📊 Price Action:
Aditya Birla Capital witnessed a bullish breakout from a tight consolidation range, confirming renewed buying interest.
Price action shows strong momentum as the stock reclaimed short-term resistance with conviction.
Sustaining above 325 can open the path toward 340–347 in the short term, supported by high-volume expansion.
💼 HNI Trade Levels (STWP Setup):
Aggressive Entry: 326.80–328.81 | Stop Loss: 310.58
Low-Risk Entry: 323.14 | Stop Loss: 305.51
HNI and institutional traders have shown clear accumulation interest backed by strong volumes.
The bullish structure with expanding range candles indicates smart money positioning early into the trend.
Momentum continuation is likely as long as price sustains above 314–316 support.
📉 VCP Analysis:
Aditya Birla Capital displays a classic Volatility Contraction Pattern, tightening across the last few weeks before the breakout.
Today’s 20-day volume breakout confirms the end of contraction and the beginning of a volatility expansion phase.
The setup indicates strong institutional intent aligning with the final stage of the VCP breakout.
📈 STWP Trading Analysis:
Entry: 328.80 | Stop Loss: 310.58
Strong bullish candle supported by a 5x surge in volume highlights aggressive participation.
The trend structure remains positive with a series of higher highs and higher lows.
Holding above 320 will keep the bias firmly bullish and validate the ongoing uptrend.
📏 Fibonacci Analysis:
The Fibonacci retracement from the recent swing low at 269.84 to swing high at 350.50 places the price near the 38.2% zone, maintaining a healthy correction within trend.
Holding above 314–316 (23.6%) keeps the pattern intact and supports trend continuation.
A breakout above 333.87 (resistance 1) could drive a move toward 347–353, aligning with the Fibonacci extension projections.
🧭 STWP Support & Resistance:
Resistances: 333.87 | 340.93 | 353.07
Supports: 314.67 | 302.53 | 295.47
While resistance zones near 333–353 may face mild supply, supports between 302–314 appear strong with institutional defense.
Major demand zones are visible near 283–295, confirming deep accumulation pockets.
The setup structure remains bullish with strong support and relatively weak resistance above 333.
📊 STWP Volume & Technical Setup:
Today’s session recorded exceptional volume at 27.94M vs 5.43M average, a 5.14x surge, confirming institutional activity.
The yellow label highlights multiple confirmations — bullish engulfing candle, RSI breakout, and Bollinger Band expansion, signaling volatility release from compression.
Indicators like MACD and Stochastic remain bullish across daily to weekly timeframes, strengthening the continuation outlook.
🧩 STWP Summary View:
Final Outlook:
Momentum: Strong | Trend: Bullish | Risk: Moderate | Volume: High
Aditya Birla Capital is showing a strong technical structure with institutional footprints, rising volumes, and momentum confirmation.
Sustaining above 320 keeps risk controlled, while a decisive move above 333 could accelerate momentum toward higher resistance zones.
The bias remains bullish with trend continuation potential in the near term.
⚠️ Disclosure & Disclaimer – Please Read Carefully
The information shared here is meant purely for learning and awareness. It is not a buy or sell recommendation and should not be taken as investment advice.
I am not a SEBI-registered investment adviser, and all views expressed are based on personal study, chart patterns, and publicly available market data.
Trading—whether in stocks or options—carries risk. Markets can move unexpectedly, and losses can sometimes exceed the money you have invested.
Past performance or past setups do not guarantee future results. Always assess your risk, position sizing, and strategy suitability before entering trades.
Consult a SEBI-registered financial adviser before making any real trading decision.
Position Status: No active position in (ABCAPITAL) at the time of analysis.
Data Source: TradingView & NSE India (Past Chart Reference)
💬 Found this useful?
🔼 Give this post a Boost to help more traders discover structured learning.
✍️ Drop your thoughts, questions, or setups in the comments — let’s grow together!
🔁 Share with fellow traders and beginners to spread awareness.
👉 “If you liked this breakdown, follow for more clean, structured setups with discipline at the core.”
🚀 Stay Calm. Stay Clean. Trade With Patience.
Trade Smart | Learn Zones | Be Self-Reliant 📊

Oil India | Bullish Breakout with Institutional Volume Surge💹 Oil India Ltd (NSE: OIL)
Sector: Energy | CMP: ₹438.05 | View: Bullish Breakout Setup
📊 Price Action:
Oil India has shown a strong bullish candle breakout after weeks of consolidation between 410–420. Buyers stepped in aggressively with volume confirmation, pushing price above the short-term resistance. A sustained close above 435 could trigger a fresh up-move toward the 450–455 zone.
HNI Trade Levels (STWP Setup):
Aggressive Entry: 434.75–436.20 | Stop Loss: 416.08
Low-Risk Entry: 432.57 | Stop Loss: 411.75
HNI and institutional buyers are showing strong accumulation interest with rising volumes. The breakout candle indicates smart money entering early into the trend. Sustained buying momentum suggests continued institutional participation ahead.
VCP Analysis:
Oil India is forming a smooth Volatility Contraction Pattern with clear price tightening in recent weeks. Volume contraction followed by today’s strong expansion indicates a potential VCP breakout stage. The surge in volume confirms institutional activity aligning with the final contraction phase breakout.
STWP Trading Analysis:
Entry: 436.20 | Stop Loss: 410.30
Strong bullish momentum with a wide-range candle backed by heavy institutional volumes. The breakout structure signals renewed trend strength with clear directional intent. Sustaining above 430 will keep the momentum in favor of buyers.
Fibonacci Analysis:
Oil India’s Fibonacci structure is plotted from the Swing Low at 384.6 to the Swing High at 491.5, capturing the recent trend wave. The stock is currently trading near the 50% retracement level at 438.05, showing a strong recovery within the ongoing uptrend. Holding above the 38.2% zone at 425.44 will keep momentum intact, while a breakout above the 61.8% level at 450.66 could extend the move toward 468–491, confirming trend continuation.
STWP Support & Resistance:
Resistances: 440.53 | 446.32 | 456.43
Supports: 424.63 | 414.52 | 408.73
While we note the above technical levels, the chart displays resistance zones at 448–456 and 478–491 as relatively weak, indicating limited selling pressure. However, supports near 392–384 and 325–350 appear strong, reflecting firm institutional demand and accumulation interest. This structure suggests a bullish bias, where sustained buying above 440 could trigger continuation momentum toward higher levels.
STWP Volume & Technical Setup:
Oil India delivered a power-packed bullish session today, marked by a strong Marubozu candle that reflected uninterrupted buying momentum from open to close. The chart’s yellow label captures a perfect storm of bullish confirmations — from exceptional volume (6.03M vs 2.48M avg, ratio 2.43x) to a Bollinger Band breakout emerging right after a compression phase, signaling fresh volatility expansion. The RSI breakout, 200 EMA crossover, and BB Squeeze trigger all align to validate institutional accumulation and trend strength. With buyer dominance clearly visible, Oil India stands poised for a momentum-driven continuation in the sessions ahead.
STWP Summary View:
Final Outlook:
Momentum: Strong | Trend: Bullish | Risk: Low | Volume: High
Oil India displays a textbook bullish setup with strong price action, expanding volume, and visible institutional activity.
A high-volume breakout from a tight base confirms trend strength and upside potential. Holding above key supports keeps risk low and the bullish momentum intact.
________________________________________
________________________________________
⚠️ Disclosure & Disclaimer – Please Read Carefully
The information shared here is meant purely for learning and awareness. It is not a buy or sell recommendation and should not be taken as investment advice. I am not a SEBI-registered investment adviser, and all views expressed are based on personal study, chart patterns, and publicly available market data.
Trading—whether in stocks or options—carries risk. Markets can move unexpectedly, and losses can sometimes exceed the money you have invested. Past performance or past setups do not guarantee future results.
If you are a beginner, treat this as a guide to understand how the market works and practice on paper trades before risking real money. If you are experienced, always assess your own risk, position sizing, and strategy suitability before entering trades.
Consult a SEBI-registered financial adviser before making any real trading decision. By engaging with this content, you acknowledge full responsibility for your trades and investments.
Position Status: No active position in (OIL) at the time of analysis.
Data Source: TradingView & NSE India (Past Chart Reference) (Historical levels)
💬 Found this useful?
🔼 Give this post a Boost to help more traders discover clean, structured learning.
✍️ Drop your thoughts, questions, or setups in the comments — let’s grow together!
🔁 Share with fellow traders and beginners to spread awareness.
👉 “If you liked this breakdown, follow for more clean, structured setups with discipline at the core.”
🚀 Stay Calm. Stay Clean. Trade With Patience.
Trade Smart | Learn Zones | Be Self-Reliant 📊

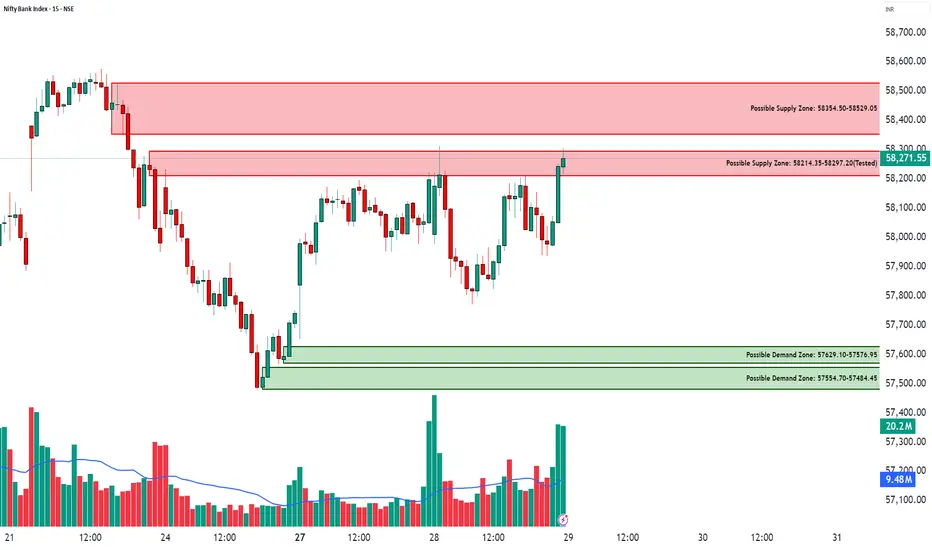
BANKNIFTY - Testing the Supply Zone After Strong Reversal📊 BANK NIFTY – Testing the Supply Zone After Strong Reversal ⚔️
Date: 28th Oct 2025
Spot Price: ₹58,271
🔹 Supports: 57,885 / 57,555 / 57,341
🔹 Resistances: 58,428 / 58,642 / 58,871
🔹 Intraday Demand Zones:
1️⃣ 57,629 – 57,576
2️⃣ 57,555 – 57,484
3️⃣ 57,341 – 57,300
🔹 Supply Zones:
1️⃣ 58,214 – 58,297 (Tested)
2️⃣ 58,354 – 58,529
🔑 Key Highlights
Bank Nifty rebounded strongly from multiple demand zones near 57,600 with a clear volume spike.
Price has now reached the tested supply zone around 58,214–58,297, where profit booking or short build-up could appear.
ATR Dashboard (STWP Edition) shows volatility expansion — suggesting the next move will likely be decisive.
The upper supply belt (58,350–58,530) remains a crucial resistance for trend confirmation.
🎯 STWP Trade View
Bank Nifty is currently trapped between strong demand below and supply overhead, indicating a range setup.
Keep a close watch on dips back into the 57,600–57,800 demand pocket — those zones remain key buyer territories.
If the index breaks and sustains above 58,530, expect a momentum push toward 58,870+.
Conversely, rejection from the current supply could bring a short-term pullback.
💡 Learning Note
When price revisits a tested supply zone after a strong recovery, volume behavior becomes the key —
Declining volume = exhaustion
Expanding volume = breakout potential
Observing this shift early helps traders position themselves smartly before the move unfolds.
Final Outlook:
Momentum: Recovering, but supply pressure visible | Trend: Range-bound between 57,600–8,500|Risk: Neutral within range; breakout may shift bias | Volume: High during reversal — watch behavior at supply
________________________________________
________________________________________
⚠️ Disclosure & Disclaimer – Please Read Carefully
The information shared here is meant purely for learning and awareness. It is not a buy or sell recommendation and should not be taken as investment advice. I am not a SEBI-registered investment adviser, and all views expressed are based on personal study, chart patterns, and publicly available market data.
Trading—whether in stocks or options—carries risk. Markets can move unexpectedly, and losses can sometimes exceed the money you have invested. Past performance or past setups do not guarantee future results.
If you are a beginner, treat this as a guide to understand how the market works and practice on paper trades before risking real money. If you are experienced, always assess your own risk, position sizing, and strategy suitability before entering trades.
Consult a SEBI-registered financial adviser before making any real trading decision. By engaging with this content, you acknowledge full responsibility for your trades and investments.
Position Status: No active position in BANKNIFTY at the time of analysis.
Data Source: TradingView & NSE India (Past Chart Reference) (Historical levels)
💬 Found this useful?
🔼 Give this post a Boost to help more traders discover clean, structured learning.
✍️ Drop your thoughts, questions, or setups in the comments — let’s grow together!
🔁 Share with fellow traders and beginners to spread awareness.
👉 “If you liked this breakdown, follow for more clean, structured setups with discipline at the core.”
🚀 Stay Calm. Stay Clean. Trade With Patience.
Trade Smart | Learn Zones | Be Self-Reliant 📊
NIFTY - Triple Demand Zone Rebound with Strong Volume📈 NIFTY 50 – Powerful Reversal from Triple Intraday Demand Zones 💪
Date: 28th Oct 2025
Spot Price: ₹25,936.20
🔹 Resistances: 26,048 / 26,160 / 26,280
🔹 Supports: 25,816 / 25,697 / 25,585
🔹 Intraday Demand Zones:
1️⃣ 25,868 – 25,814
2️⃣ 25,809 – 25,790
3️⃣ 25,763 – 25,737
🔑 Key Highlights
Nifty witnessed a strong reversal from a cluster of three intraday demand zones.
The 25,800 region attracted heavy buying interest with a sharp volume spike.
Volume expansion at the base confirms fresh long accumulation by strong hands.
Structure suggests short-term bottoming within a broader sideways band.
Resistance around 26,048–26,160 will be the next key test for bulls.
🎯 STWP Trade View
Nifty’s recovery from these demand zones indicates buyers regaining control near lower levels.
Keep a close watch on any dips back into the demand zones — such retracements often provide high-probability opportunities for short-term traders.
As long as price sustains above 25,800, the bias stays bullish toward 26,160–26,280.
💡 Learning Note
When multiple intraday demand zones align together, they create a layered liquidity base — an area where institutions quietly accumulate positions.
Volume confirmation near such zones gives early signs of strength beneath the surface.
Final Outlook:
Momentum: Bullish recovery in progress | Trend: Range-bound but firm bias upward | Risk: | Neutral above 25,800 | Volume: Expanding — confirming active participation
________________________________________
________________________________________
⚠️ Disclosure & Disclaimer – Please Read Carefully
The information shared here is meant purely for learning and awareness. It is not a buy or sell recommendation and should not be taken as investment advice. I am not a SEBI-registered investment adviser, and all views expressed are based on personal study, chart patterns, and publicly available market data.
Trading—whether in stocks or options—carries risk. Markets can move unexpectedly, and losses can sometimes exceed the money you have invested. Past performance or past setups do not guarantee future results.
If you are a beginner, treat this as a guide to understand how the market works and practice on paper trades before risking real money. If you are experienced, always assess your own risk, position sizing, and strategy suitability before entering trades.
Consult a SEBI-registered financial adviser before making any real trading decision. By engaging with this content, you acknowledge full responsibility for your trades and investments.
Position Status: No active position in NIFTY at the time of analysis.
Data Source: TradingView & NSE India (Past Chart Reference) (Historical levels)
💬 Found this useful?
🔼 Give this post a Boost to help more traders discover clean, structured learning.
✍️ Drop your thoughts, questions, or setups in the comments — let’s grow together!
🔁 Share with fellow traders and beginners to spread awareness.
👉 “If you liked this breakdown, follow for more clean, structured setups with discipline at the core.”
🚀 Stay Calm. Stay Clean. Trade With Patience.
Trade Smart | Learn Zones | Be Self-Reliant 📊

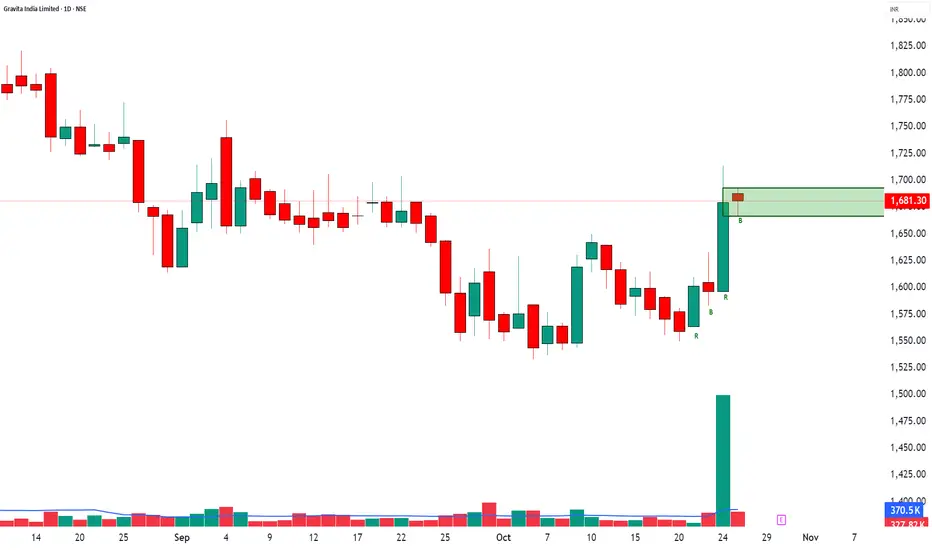
GRAVITA INDIA LTD – Strong Demand Zone📈 GRAVITA INDIA LTD – Strong Demand Zone at 1667–1692 🟢
🔹 Supports: 1668 / 1654 / 1642
🔹 Resistances: 1693 / 1705 / 1718
🔹 Swing Demand Zone: 1692–1667
🎯 STWP Trade View:
Gravita India is currently building strength near its new demand zone.
If the price holds above 1667, it can trigger a move toward 1715–1735 in the short term.
A retest near 1670–1665 with low volume will offer a favorable long entry opportunity.
💡 Learning Note:
Demand zones formed after large bullish candles with high volume often indicate institutional absorption.
Wait for price confirmation or retest to ensure strong continuation from the zone.
Final Outlook: Momentum: Building Up | Trend: Bullish Bias | Risk: Moderate | Volume: Extremely High
________________________________________
________________________________________
⚠️ Disclosure & Disclaimer – Please Read Carefully
The information shared here is meant purely for learning and awareness. It is not a buy or sell recommendation and should not be taken as investment advice. I am not a SEBI-registered investment adviser, and all views expressed are based on personal study, chart patterns, and publicly available market data.
Trading—whether in stocks or options—carries risk. Markets can move unexpectedly, and losses can sometimes exceed the money you have invested. Past performance or past setups do not guarantee future results.
If you are a beginner, treat this as a guide to understand how the market works and practice on paper trades before risking real money. If you are experienced, always assess your own risk, position sizing, and strategy suitability before entering trades.
Consult a SEBI-registered financial adviser before making any real trading decision. By engaging with this content, you acknowledge full responsibility for your trades and investments.
Position Status: No active position in GRAVITA at the time of analysis.
Data Source: TradingView & NSE India (Past Chart Reference) (Historical levels)
💬 Found this useful?
🔼 Give this post a Boost to help more traders discover clean, structured learning.
✍️ Drop your thoughts, questions, or setups in the comments — let’s grow together!
🔁 Share with fellow traders and beginners to spread awareness.
👉 “If you liked this breakdown, follow for more clean, structured setups with discipline at the core.”
🚀 Stay Calm. Stay Clean. Trade With Patience.
Trade Smart | Learn Zones | Be Self-Reliant 📊
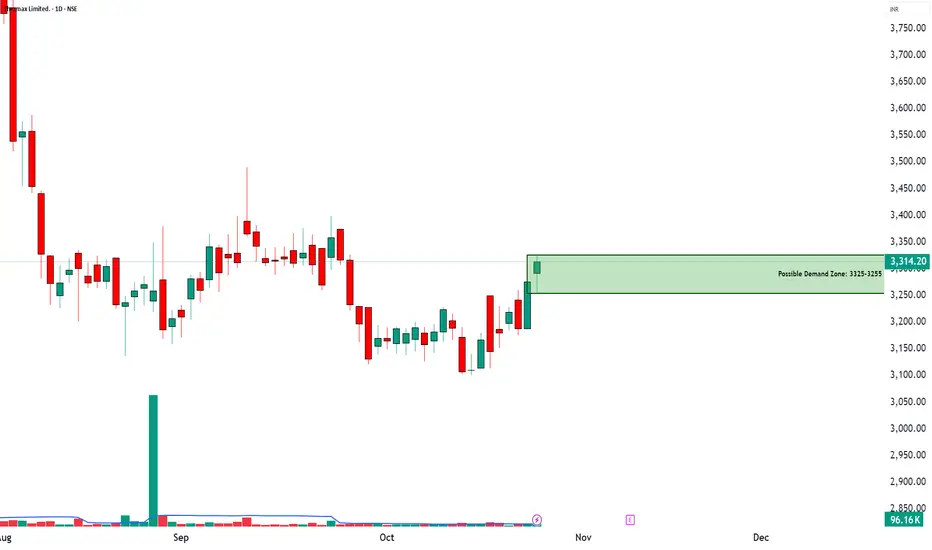
THERMAX LTD – Possible Demand Zone📈 THERMAX LTD – Possible Demand Zone in The Making - A possible Rally Base Rally
🔹 Entry Zone: 3325
🔹 Supports: 3271 / 3228 / 3201
🔹 Resistances: 3341 / 3368 / 3411
🔹 Swing Demand Zone: 3325–3255
🎯 STWP Trade View:
Thermax is showing early signs of trend reversal from recent consolidation.
A sustained close above 3340 may open the way for possible further upside move, while dips toward 3280–3260 can offer buying opportunities.
💡 Learning Note:
When price revisits a previously strong demand zone with low volume and then bounces sharply — it often signals the presence of smart money. Watch how price behaves near zone retests before scaling up.
Final Outlook:
Momentum: Building | Trend: Early Bullish | Risk: Controlled | Volume: picking up
________________________________________
________________________________________
⚠️ Disclosure & Disclaimer – Please Read Carefully
The information shared here is meant purely for learning and awareness. It is not a buy or sell recommendation and should not be taken as investment advice. I am not a SEBI-registered investment adviser, and all views expressed are based on personal study, chart patterns, and publicly available market data.
Trading—whether in stocks or options—carries risk. Markets can move unexpectedly, and losses can sometimes exceed the money you have invested. Past performance or past setups do not guarantee future results.
If you are a beginner, treat this as a guide to understand how the market works and practice on paper trades before risking real money. If you are experienced, always assess your own risk, position sizing, and strategy suitability before entering trades.
Consult a SEBI-registered financial adviser before making any real trading decision. By engaging with this content, you acknowledge full responsibility for your trades and investments.
Position Status: No active position in THERMAX at the time of analysis.
Data Source: TradingView & NSE India (Past Chart Reference) (Historical levels)
💬 Found this useful?
🔼 Give this post a Boost to help more traders discover clean, structured learning.
✍️ Drop your thoughts, questions, or setups in the comments — let’s grow together!
🔁 Share with fellow traders and beginners to spread awareness.
👉 “If you liked this breakdown, follow for more clean, structured setups with discipline at the core.”
🚀 Stay Calm. Stay Clean. Trade With Patience.
Trade Smart | Learn Zones | Be Self-Reliant 📊
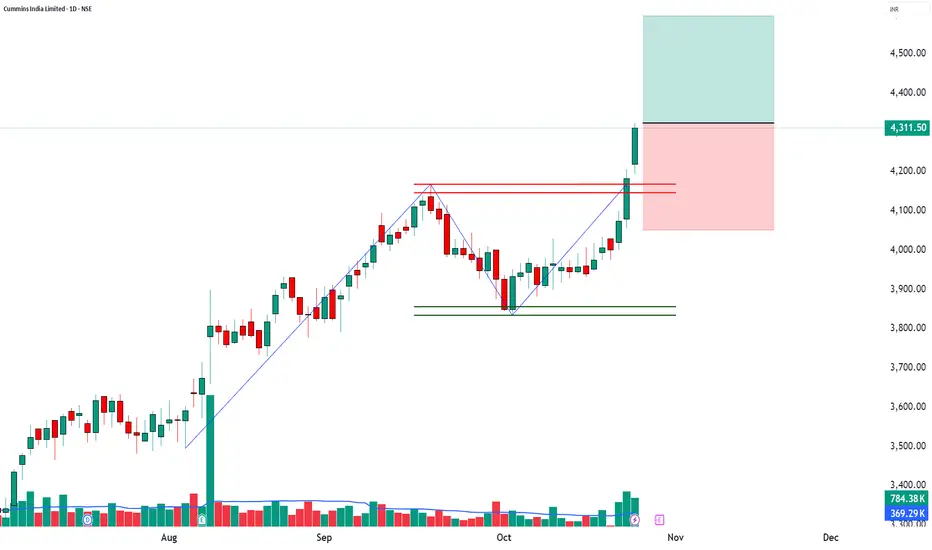
CUMMINSIND | 52-Week Breakout + Volume Expansion📈 CUMMINSIND | 52-Week Breakout + Volume Expansion + Institutional Momentum 🚀
🔹 Entry Zone: ₹4,311.50 – ₹4,324.00
🔹 Stop Loss: ₹4,051.05 (Risk ~273 pts)
🔹 Supports: 4,230 / 4,148.5 / 4,101.5
🔹 Resistances: 4,358.5 / 4,405.5 / 4,487
🔹 Swing Demand Zone: ₹4,096.70 – ₹4,060.10
🔹 Intraday Demand Zone: ₹4,086.20 – ₹4,065.00
🔑 Key Highlights
✅ 52-Week Breakout – strong bullish sentiment and trend expansion
✅ Exceptional Volume (2.12x avg) – clear institutional participation
✅ Bollinger Band Expansion – rising volatility supporting fresh rally
✅ Buy Today, Sell Tomorrow Setup – high momentum carryover expected
✅ VWAP Alignment – buyers maintaining upper hand
🎯 STWP Trade View
📊 Stock has shown powerful bullish momentum with record volume; however, post-breakout consolidation may occur near ₹4,358–₹4,405.
⚠️ The ₹4,086–₹4,065 intraday zone and ₹4,096–₹4,060 swing zone act as crucial support for momentum traders to plan re-entries.
💡 Learning Note
A 52-week breakout supported by heavy volume and VWAP strength signals potential institutional accumulation. Traders should trail profits gradually and watch for sustained volume to confirm continuation.
Final Outlook: Momentum: Moderate | Trend: Neutral | Risk: Low | Volume: High
________________________________________
________________________________________
⚠️ Disclosure & Disclaimer – Please Read Carefully
The information shared here is meant purely for learning and awareness. It is not a buy or sell recommendation and should not be taken as investment advice. I am not a SEBI-registered investment adviser, and all views expressed are based on personal study, chart patterns, and publicly available market data.
Trading—whether in stocks or options—carries risk. Markets can move unexpectedly, and losses can sometimes exceed the money you have invested. Past performance or past setups do not guarantee future results.
If you are a beginner, treat this as a guide to understand how the market works and practice on paper trades before risking real money. If you are experienced, always assess your own risk, position sizing, and strategy suitability before entering trades.
Consult a SEBI-registered financial adviser before making any real trading decision. By engaging with this content, you acknowledge full responsibility for your trades and investments.
Position Status: No active position in CUMMINSIND at the time of analysis.
Data Source: TradingView & NSE India (Past Chart Reference) (Historical levels)
💬 Found this useful?
🔼 Give this post a Boost to help more traders discover clean, structured learning.
✍️ Drop your thoughts, questions, or setups in the comments — let’s grow together!
🔁 Share with fellow traders and beginners to spread awareness.
👉 “If you liked this breakdown, follow for more clean, structured setups with discipline at the core.”
🚀 Stay Calm. Stay Clean. Trade With Patience.
Trade Smart | Learn Zones | Be Self-Reliant 📊
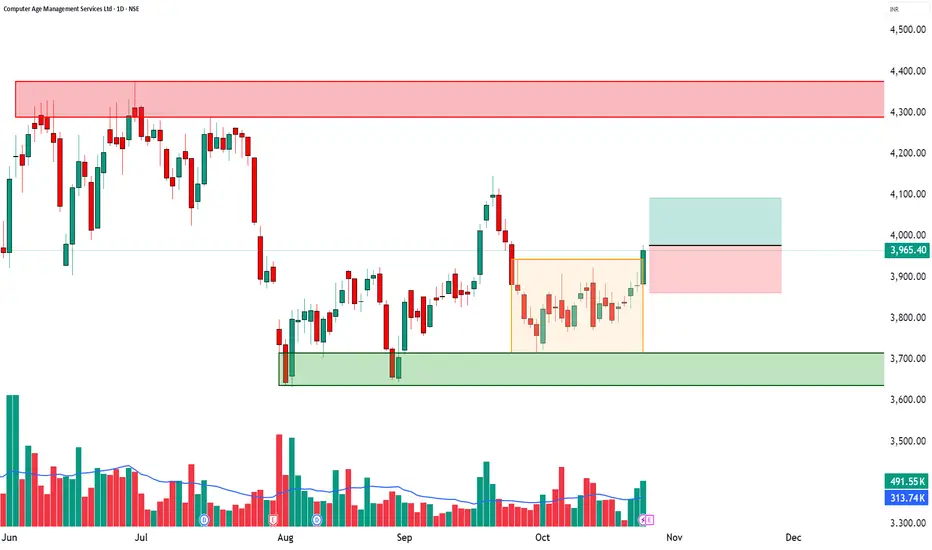
CAMS | Bullish Breakout + RSI Surge + High Volume📈 CAMS | Bullish Breakout + RSI Surge + High Volume Confirmation 🚀
🔹 Entry Zone: ₹3,965.40 – ₹3,977.80
🔹 Stop Loss: ₹3,862.45 (Risk ~115 pts)
🔹 Supports: 3,905.67 / 3,845.93 / 3,809.87
🔹 Resistances: 4,001.47 / 4,037.53 / 4,097.27
🔹 Swing Demand Zone: ₹3,815.50 – ₹3,789.90
🔹 Intraday Demand Zone: ₹3,885.70 – ₹3,877.00 | ₹3,875.90 – ₹3,868.10
🔑 Key Highlights
✅ Strong Bullish Candle – powerful continuation signal backed by strong volume
✅ RSI Breakout – confirms renewed buying momentum
✅ Bollinger Band Expansion – volatility breakout underway
✅ VWAP Alignment – sustained buyer dominance across sessions
✅ Volume Surge (1.57x avg) – active institutional participation
🎯 STWP Trade View
📊 Momentum favors a short-term bullish continuation. A close above ₹4,001 could extend the rally toward ₹4,037–₹4,097 zones.
⚠️ The ₹3,885–₹3,868 range offers intraday demand, while ₹3,815–₹3,789 serves as the swing demand base for positional traders.
💡 Learning Note
This setup combines RSI breakout + VWAP alignment + high volume — a potent trio for identifying momentum-backed bullish reversals. Traders can use intraday zones for tactical entries with clear stop placement.
Final Outlook: Momentum: Strong | Trend: Bullish | Risk: Low | Volume: High
________________________________________
________________________________________
⚠️ Disclosure & Disclaimer – Please Read Carefully
The information shared here is meant purely for learning and awareness. It is not a buy or sell recommendation and should not be taken as investment advice. I am not a SEBI-registered investment adviser, and all views expressed are based on personal study, chart patterns, and publicly available market data.
Trading—whether in stocks or options—carries risk. Markets can move unexpectedly, and losses can sometimes exceed the money you have invested. Past performance or past setups do not guarantee future results.
If you are a beginner, treat this as a guide to understand how the market works and practice on paper trades before risking real money. If you are experienced, always assess your own risk, position sizing, and strategy suitability before entering trades.
Consult a SEBI-registered financial adviser before making any real trading decision. By engaging with this content, you acknowledge full responsibility for your trades and investments.
Position Status: No active position in CAMS at the time of analysis.
Data Source: TradingView & NSE India (Past Chart Reference) (Historical levels)
💬 Found this useful?
🔼 Give this post a Boost to help more traders discover clean, structured learning.
✍️ Drop your thoughts, questions, or setups in the comments — let’s grow together!
🔁 Share with fellow traders and beginners to spread awareness.
👉 “If you liked this breakdown, follow for more clean, structured setups with discipline at the core.”
🚀 Stay Calm. Stay Clean. Trade With Patience.
Trade Smart | Learn Zones | Be Self-Reliant 📊
NUVAMA | Bullish Engulfing + VWAP Alignment📈 NUVAMA | Bullish Engulfing + VWAP Alignment + Strong Momentum Reversal 🚀
🔹 Entry Zone: ₹7,420.50 – ₹7,436.00
🔹 Stop Loss: ₹7,151.90 (Risk ~284 pts)
🔹 Supports: 7,244.33 / 7,068.17 / 6,972.33
🔹 Resistances: 7,516.33 / 7,612.17 / 7,788.33
🔹 Swing Demand Zone: ₹7,086 – ₹6,998.50
🔹 Intraday Demand Zone: ₹7,253.50 – ₹7,223
🔑 Key Highlights
✅ Bullish Engulfing Candle – powerful reversal confirmation
✅ VWAP Alignment – institutional bias turning bullish
✅ Momentum Strength – bullish follow-up after base formation
✅ Bollinger Squeeze-Off – volatility expansion expected
✅ Volume near average – healthy buyer participation, stable accumulation
🎯 STWP Trade View
📊 Strong bullish momentum supports a near-term rally toward ₹7,516–₹7,612. Sustaining above ₹7,612 could open upside potential to ₹7,788.
⚠️ The ₹7,253–₹7,223 zone provides intraday support, while ₹7,190–₹7,165 acts as a swing base for positional buyers to watch.
💡 Learning Note
This setup demonstrates how a Bullish Engulfing pattern with VWAP confirmation offers a reliable multi-signal entry. When aligned with tight demand zones, it allows traders to manage risk effectively while capitalizing on short-term breakouts.
Final Outlook: Momentum: Strong, Trend: Bullish, Risk: Low, Volume: High
________________________________________
________________________________________
⚠️ Disclosure & Disclaimer – Please Read Carefully
The information shared here is meant purely for learning and awareness. It is not a buy or sell recommendation and should not be taken as investment advice. I am not a SEBI-registered investment adviser, and all views expressed are based on personal study, chart patterns, and publicly available market data.
Trading—whether in stocks or options—carries risk. Markets can move unexpectedly, and losses can sometimes exceed the money you have invested. Past performance or past setups do not guarantee future results.
If you are a beginner, treat this as a guide to understand how the market works and practice on paper trades before risking real money. If you are experienced, always assess your own risk, position sizing, and strategy suitability before entering trades.
Consult a SEBI-registered financial adviser before making any real trading decision. By engaging with this content, you acknowledge full responsibility for your trades and investments.
Position Status: No active position in NUVAMA at the time of analysis.
Data Source: TradingView & NSE India (Past Chart Reference) (Historical levels)
💬 Found this useful?
🔼 Give this post a Boost to help more traders discover clean, structured learning.
✍️ Drop your thoughts, questions, or setups in the comments — let’s grow together!
🔁 Share with fellow traders and beginners to spread awareness.
👉 “If you liked this breakdown, follow for more clean, structured setups with discipline at the core.”
🚀 Stay Calm. Stay Clean. Trade With Patience.
Trade Smart | Learn Zones | Be Self-Reliant 📊

MCX | Strong Bullish Candle + VWAP Alignment + Swing Reversal Se📈 MCX | Strong Bullish Candle + VWAP Alignment + Swing Reversal Setup 🚀
🔹 Entry Zone: ₹9,305.50 – ₹9,335.00
🔹 Stop Loss: ₹8,962.50 (Risk ~343 pts)
🔹 Supports: 9,081 / 8,856.50 / 8,729.50
🔹 Resistances: 9,432.50 / 9,559.50 / 9,784.00
🔹 Swing Demand Zone: ₹7,880 – ₹7,725.50
🔹 Intraday Demand Zone: ₹9,052 – ₹8,975.50
🔑 Key Highlights
✅ Strong Bullish Candle signaling buyer dominance and swing reversal
✅ Bullish VWAP Alignment confirming upward control by buyers
✅ RSI improving from oversold region, supporting reversal momentum
✅ Bollinger Squeeze-Off indicating volatility expansion likely
✅ Volume near average levels – potential for fresh accumulation on breakout
🎯 STWP Trade View
📊 Momentum supports a bullish continuation if price sustains above ₹9,432. A breakout beyond ₹9,560 can extend the rally toward ₹9,784.
⚠️ The ₹9,052–₹8,975 zone offers intraday support, while ₹7,880–₹7,725 remains the long-term swing accumulation area for positional traders.
💡 Learning Note
This setup highlights how VWAP alignment with a strong bullish candle near demand zones acts as a multi-layer confirmation of trend reversal. Watching for volume pickup near resistances helps validate institutional buying strength.
Final Outlook: Momentum: Strong, Trend: Bullish, Risk: Low, Volume: High
________________________________________
________________________________________
⚠️ Disclosure & Disclaimer – Please Read Carefully
The information shared here is meant purely for learning and awareness. It is not a buy or sell recommendation and should not be taken as investment advice. I am not a SEBI-registered investment adviser, and all views expressed are based on personal study, chart patterns, and publicly available market data.
Trading—whether in stocks or options—carries risk. Markets can move unexpectedly, and losses can sometimes exceed the money you have invested. Past performance or past setups do not guarantee future results.
If you are a beginner, treat this as a guide to understand how the market works and practice on paper trades before risking real money. If you are experienced, always assess your own risk, position sizing, and strategy suitability before entering trades.
Consult a SEBI-registered financial adviser before making any real trading decision. By engaging with this content, you acknowledge full responsibility for your trades and investments.
Position Status: No active position in MCX at the time of analysis.
Data Source: TradingView & NSE India (Past Chart Reference) (Historical levels)
💬 Found this useful?
🔼 Give this post a Boost to help more traders discover clean, structured learning.
✍️ Drop your thoughts, questions, or setups in the comments — let’s grow together!
🔁 Share with fellow traders and beginners to spread awareness.
👉 “If you liked this breakdown, follow for more clean, structured setups with discipline at the core.”
🚀 Stay Calm. Stay Clean. Trade With Patience.
Trade Smart | Learn Zones | Be Self-Reliant 📊
