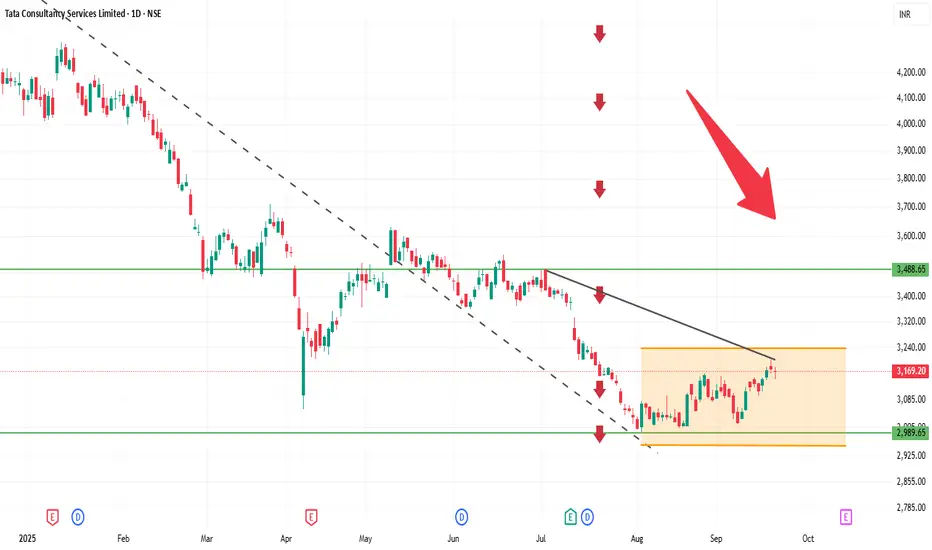
TCS 1D Time frameCurrent Price: Around 3,174
Current Trend: Stock is in a sideways to slightly bullish phase after consolidation.
Support Zone: Strong support at 3,140 – 3,150. Buyers may defend this level.
Resistance Zone: Key resistance at 3,200 – 3,220. A breakout above 3,220 can trigger fresh upside.
Indicators: Daily candles indicate mild buying interest; volume is stable.
Outlook:
Above 3,220 → bullish momentum may extend toward 3,250+.
Below 3,140 → weakness may push toward 3,100–3,120.
👉 In short:
Range: 3,140 – 3,220.
Neutral to slightly bullish; breakout will determine next move.
SUNPHARMA
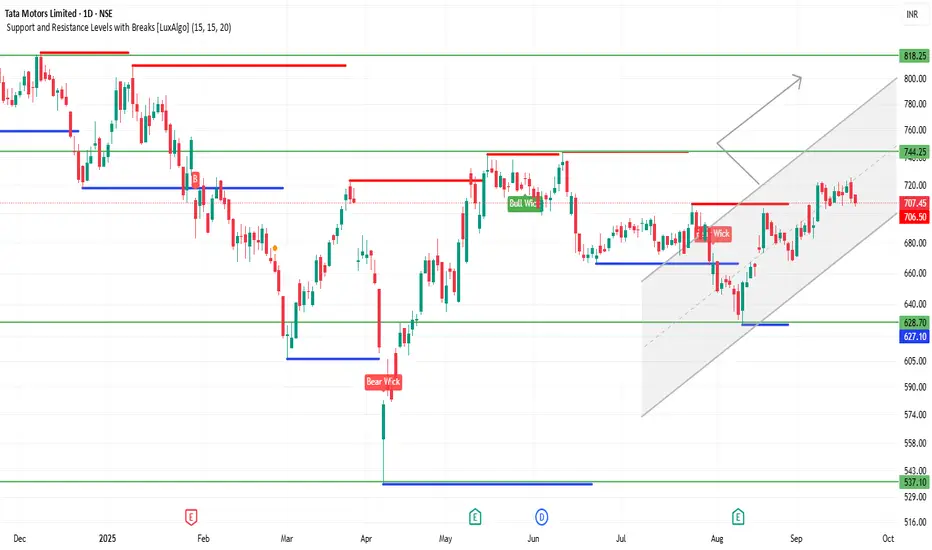
TATAMOTORS 1D Time frameCurrent Price: 707
Current Trend: Strong bullish momentum; stock is trading near recent highs.
Support Zone: Immediate support at 695 – 700. If this holds, uptrend remains intact.
Resistance Zone: Next resistance at 720 – 730. A breakout above this can push toward 750+.
Indicators: Daily candles are bullish, showing higher highs and strong buying interest.
Outlook:
Above 720 → continuation of bullish rally likely.
Below 695 → minor correction possible toward 680–685.
👉 In short (with 707 current price):
Bullish tone.
Range to watch: 695 – 730.
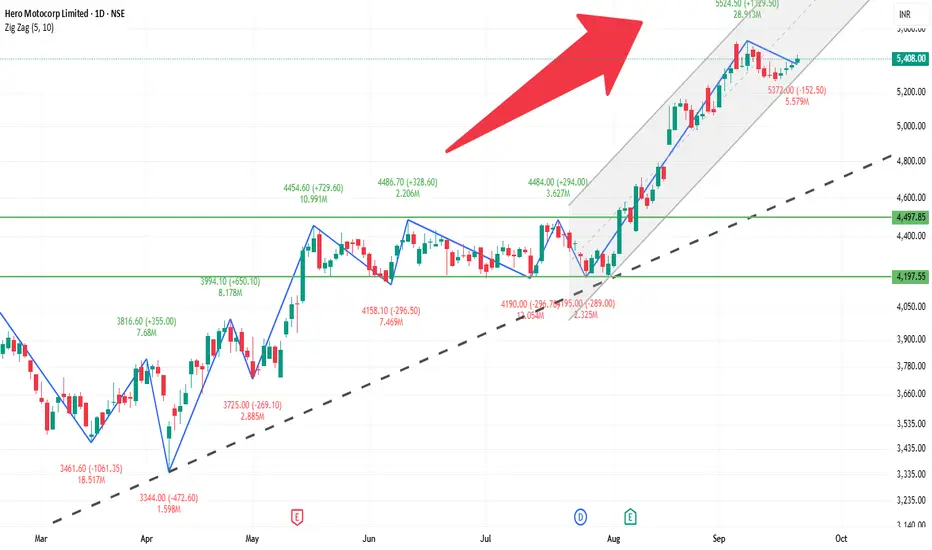
HEROMOTOCO 1D Time frameCurrent Price: 5,408 (near recent highs).
Current Trend: Strong bullish momentum; stock is trading above key resistances.
Support Zone: Immediate support at 5,300 – 5,350. If this holds, uptrend remains intact.
Resistance Zone: Next resistance is around 5,500 – 5,550. A breakout above this can push toward 5,650+.
Indicators: Daily candle structure is bullish, showing higher highs and strong buying interest.
Outlook:
Above 5,500 → continuation of bullish rally.
Below 5,300 → minor weakness; may slip toward 5,200.
👉 In short (with 5,408 price):
Bullish tone.
Range to watch: 5,300 – 5,550.
SENSEX 1D Time frameCurrent Status
Sensex Level: 82,623
Change: +594.95 points (+0.73%)
Opening: 81,852
Day’s Range: 81,780 – 82,443
52-Week Range: 71,425 – 85,978
📈 Market Sentiment
Trend: Mildly bullish
Leading Sectors: Auto, Realty, Telecom
Investor Mood: Optimistic, but watching global cues
🔍 Key Levels to Watch
Immediate Support: 81,800 – 81,850
Resistance Zone: 82,400 – 82,500
Psychological Milestone: Breaking above 82,500 may push higher
🧭 Outlook
Sensex is showing positive momentum supported by strong sectors.
Bulls are slightly stronger, but resistance near 82,400–82,500 may cap upside.
A drop below 81,800 could bring downside pressure toward 81,500–81,400.

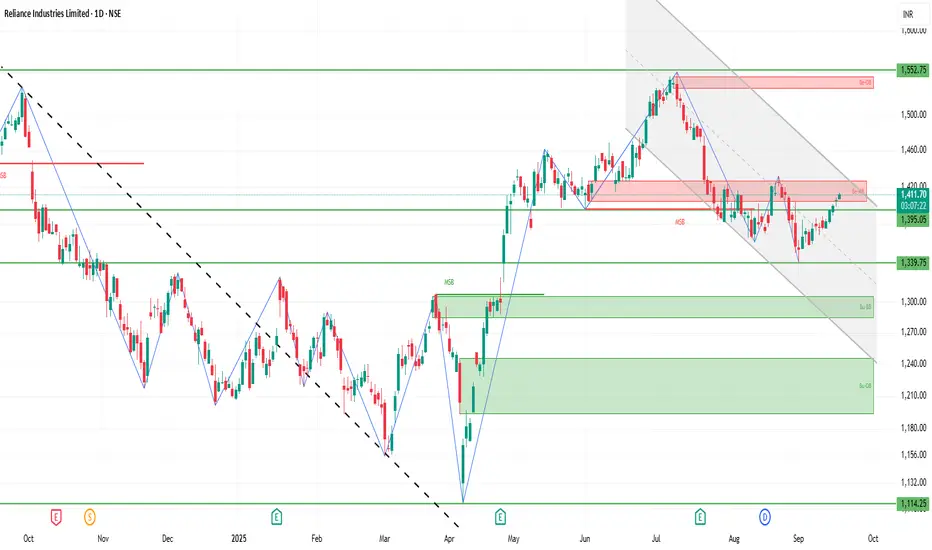
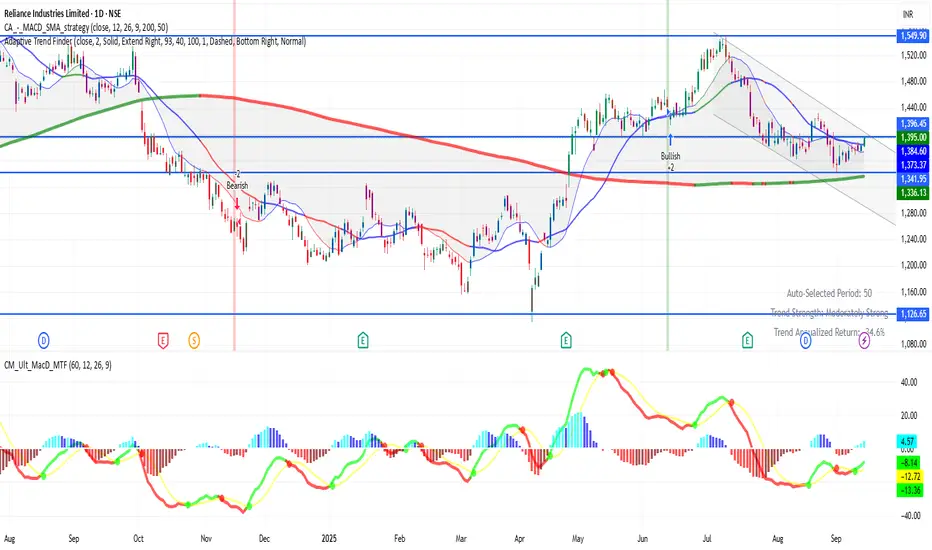
RELIANCE 1D Time frameCurrent Stock Price
Current Price: ₹1,411.60
Day’s Range: ₹1,406.90 – ₹1,412.50
52-Week Range: ₹1,114.85 – ₹1,551.00
Market Cap: ₹19.09 lakh crore
P/E Ratio: 23.43 (lower than sector average)
Dividend Yield: 0.39%
Book Value: ₹605.55
TTM EPS: ₹60.23 (+18.56% YoY)
📈 Trend & Outlook
Short-Term Trend: Mildly bullish; the stock has risen for five consecutive sessions.
Resistance Levels: ₹1,412.50 (day’s high), ₹1,551.00 (52-week high).
Support Levels: ₹1,406.90 (day’s low), ₹1,375.00 (recent low).
Investor Sentiment: Positive, with expectations around upcoming IPOs for Jio and Retail in 2026 and 2027, respectively.
🧭 Analyst Insights
Citi Group has a target price of ₹2,020, citing improved sentiment post-SEBI’s new listing norms for Jio and Retail.
Quant Mutual Fund increased its stake in Reliance Industries in August, indicating institutional confidence.
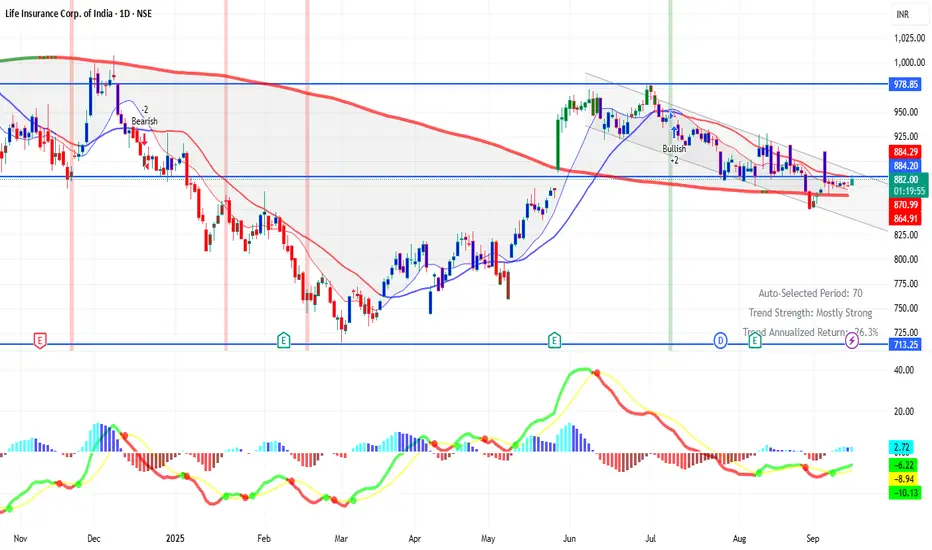
LICI 1D Time framePrice Action
Current Price: ₹882.50 (approx)
52-Week Range: ₹715.30 – ₹1,048.90
P/E Ratio: ~11.4
Book Value per Share: ~₹200+
🔹 Support & Resistance
Strong Support: ₹800 – ₹830
Immediate Resistance: ₹860 – ₹900
Next Resistance (medium-term): ₹1,000+
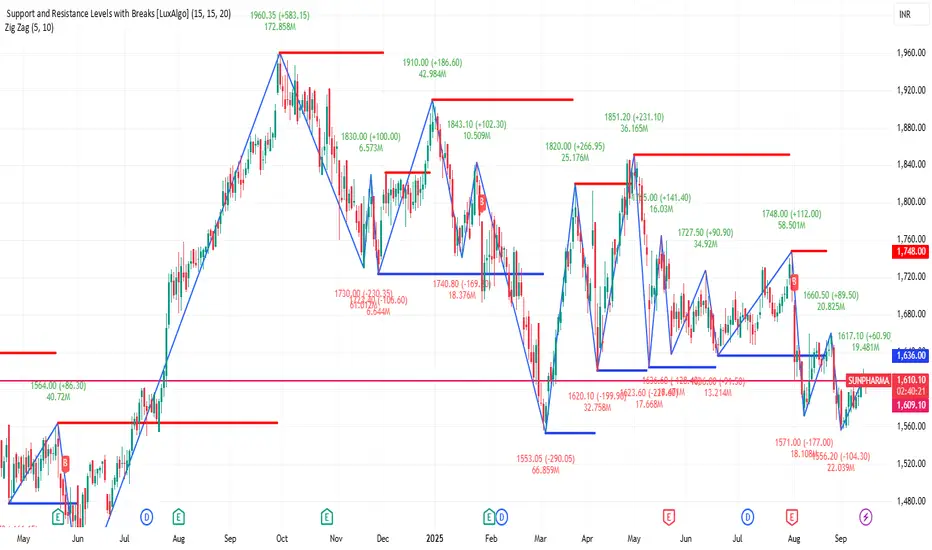
SUNPHARMA 1D Time frameUpdated Snapshot
Current Price: ₹1,607
Day’s Range: ₹1,595 – ₹1,617
Previous Close: ₹1,610
🔹 Support & Resistance
Immediate Support (S1): ₹1,600 – ₹1,595
Next Support (S2): ₹1,585 – ₹1,580
Immediate Resistance (R1): ₹1,615 – ₹1,617
Next Resistance (R2): ₹1,630 – ₹1,635
ANGELONE 1D Time frameCurrent Price: ₹2,238 – ₹2,240
Day’s Range: ₹2,212.60 – ₹2,274
Previous Close: ₹2,222.30
🔹 Support & Resistance
Support 1: ₹2,220 – ₹2,215
Support 2: ₹2,200 – ₹2,180
Resistance 1: ₹2,250 – ₹2,260
Resistance 2: ₹2,270 – ₹2,280

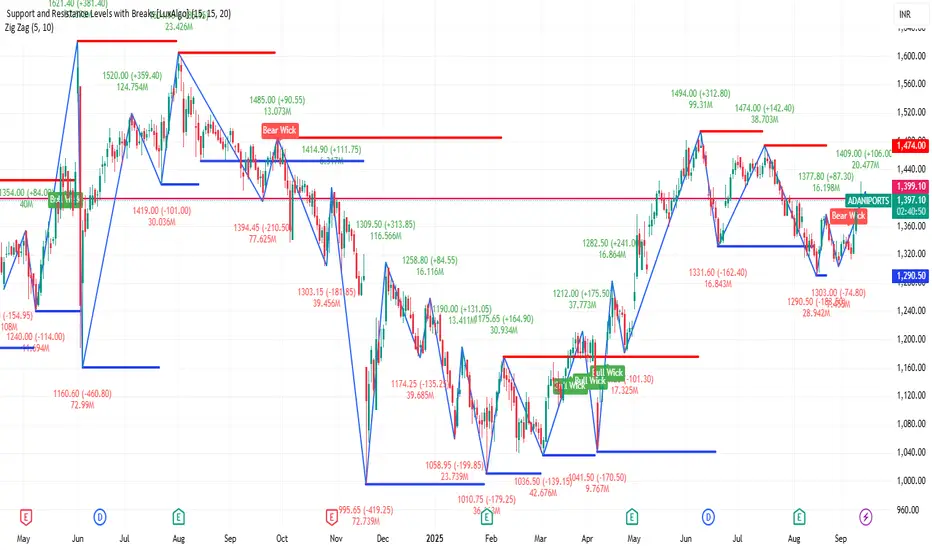
ADANIPORTS 1D Time frameUpdated Snapshot
Current Price: ₹1,399
Day’s Range: ₹1,391 – ₹1,406.50
Previous Close: ₹1,393.10
🔹 Support & Resistance
Support 1: ₹1,391 – ₹1,385
Support 2: ₹1,370 – ₹1,360
Resistance 1: ₹1,406 – ₹1,410
Resistance 2: ₹1,420 – ₹1,430
RELIANCE 1D Time frameCurrent Status
Price is around ₹715
The stock has been showing strength recently, with many of its moving averages (short- to long-term) supporting the rise.
Technical indicators like RSI, MACD, ADX etc. lean positive — buyers seem to have the upper hand.
There’s an inverted Head & Shoulders pattern forming, which is a bullish reversal signal if confirmed. Support zones are holding up so far.
Bullish Scenario
If Tata Motors stays above ₹700–705 support and breaks past ~₹720–725 with volume:
Possible upside to ~₹730-₹740
SBIN 1D Time frameCurrent Price Action (Daily Chart)
Price Range: Stock is moving between ₹815 – ₹830 right now.
Trend: Consolidation with mild bullish bias.
Key Levels
Immediate Resistance: ₹830
Next Resistance: ₹840 – ₹850
Major Resistance: Around ₹875 (previous high)
Immediate Support: ₹815 – ₹820
Strong Support: ₹800 – ₹805
Critical Support: ₹785

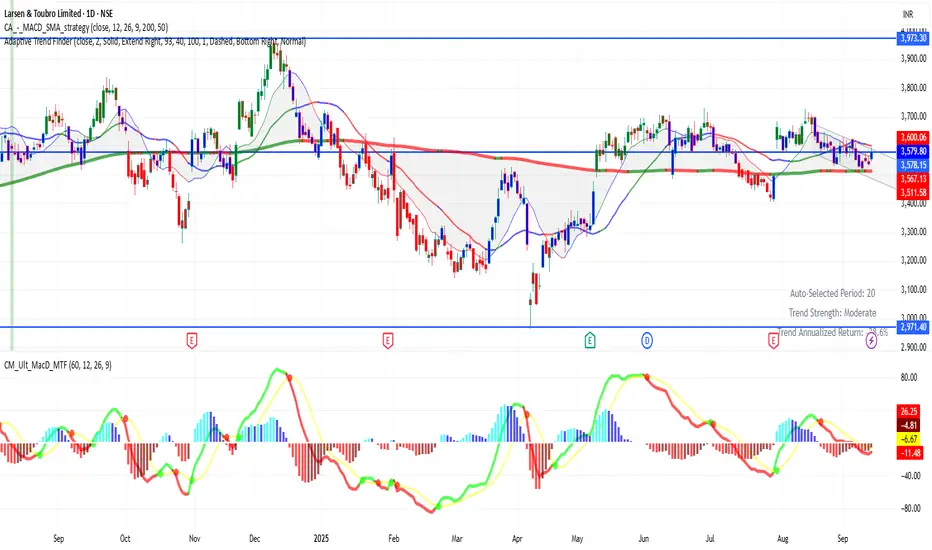
LT 1D Time frame LT — Daily (1D) Time Frame
Current Price: ₹3,579
Key Levels
Immediate Support: ₹3,540
Strong Support: ₹3,400
Immediate Resistance: ₹3,600
Major Resistance: ₹3,900
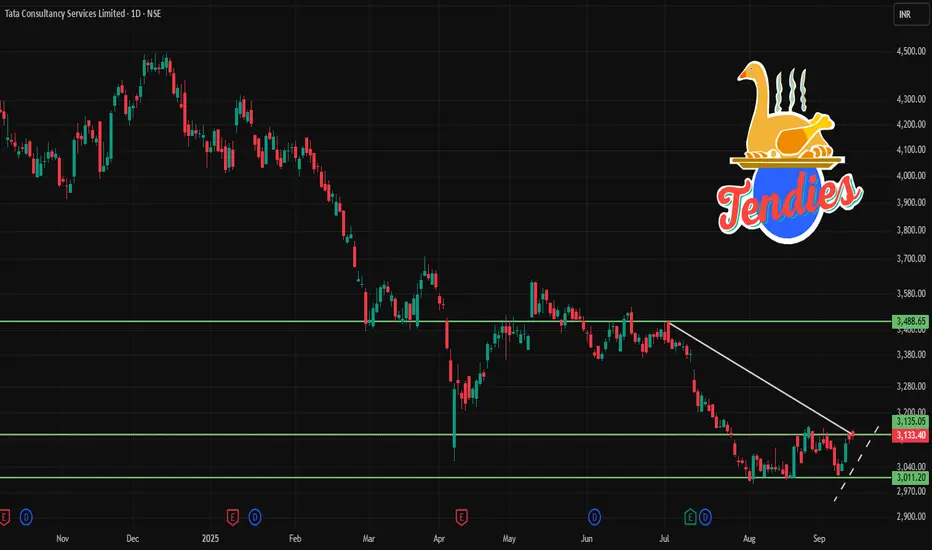
TCS 1D Time frame📉 Current Market Snapshot
Closing Price: ₹3,133.40
Day's Range: ₹3,121.00 – ₹3,148.70
52-Week High: ₹4,547.00
52-Week Low: ₹2,991.60
Market Cap: ₹11,21,000 crore
P/E Ratio (TTM): 22.8
Dividend Yield: 1.93%
Book Value: ₹262
ROE: 52.4%
Debt-to-Equity Ratio: 0.10
EPS (TTM): ₹136.19
Face Value: ₹1.00
HINDZINC 1D Time frame📍 Current Price
₹462.95 (closing price)
Short-Term Outlook
Bullish Scenario: A sustained move above ₹470.00 could lead to a test of the 52-week high around ₹575.40.
Bearish Scenario: A drop below ₹440.00 may signal a potential pullback toward ₹430.00.

HDFCBANK 1D Time frame:
📍 Current Price
₹967.30 (closing price)
Short-Term Outlook
Bullish Scenario: A sustained move above ₹975.00 could lead to a test of the 52-week high around ₹1,018.85.
Bearish Scenario: A drop below ₹960.00 may signal a potential pullback toward ₹950.00.

AXISBANK 1D Time frame📍 Current Price
₹1,105.30 (up 1.64% from previous close)
Short-Term Outlook
Bullish Scenario: A sustained move above ₹1,115 could lead to a test of the 52-week high around ₹1,281.65.
Bearish Scenario: A drop below ₹1,080 may signal a potential pullback toward the ₹1,050 level.

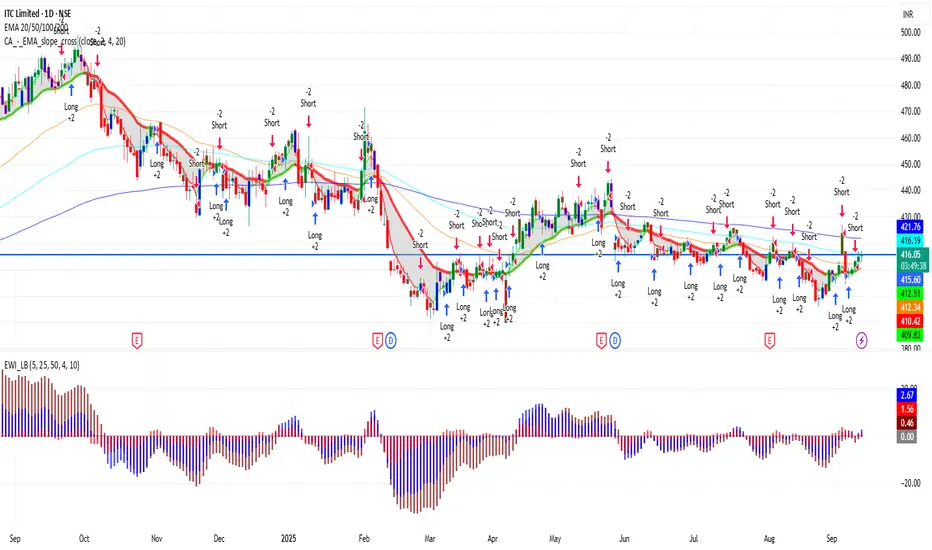
ITC 1D Time frame🔢 Current Level
ITC is trading around ₹413 – ₹416
🔑 Key Resistance & Support Levels
Resistance Zones:
₹416 – ₹421 (near-term resistance; breakout above this may lead to further upside)
₹420 (psychological resistance)
₹428 (stronger resistance above)
Support Zones:
₹412 – ₹413 (immediate support)
₹410 (short-term support; break below may indicate weakness)
₹398 – ₹400 (deeper support zone)
📉 Outlook
Bullish Scenario: If ITC holds above ₹412 – ₹413, upward momentum may continue. Break above ₹417 – ₹420 can open the way toward ₹428+.
Bearish Scenario: If it falls below ₹410, risk increases toward ₹398 – ₹400.
Neutral / Range: Between ₹412 – ₹417, ITC may consolidate before a directional move.
BANKNIFTY 1D Time frame📊 Current Snapshot
Current level: around 54,680 - 54,690
Today’s range: approx. 54,580 – 54,850
🔑 Key Daily Levels
Resistance Zones
54,960 (near-term resistance)
55,172 (major resistance; breakout above this could extend rally)
55,000 (psychological resistance)
Support Zones
54,462 (immediate support)
54,400 – 54,500 (important support band)
54,107 (deeper support if selling pressure continues)
📉 Outlook
Bullish Case: If Bank Nifty sustains above 54,960 – 55,172, it can move higher towards 55,300 – 55,500.
Bearish Case: If it breaks below 54,400, the index may slip toward 54,100 or even lower.
Neutral / Range: Between 54,400 – 54,960, sideways movement is likely until a breakout occurs.

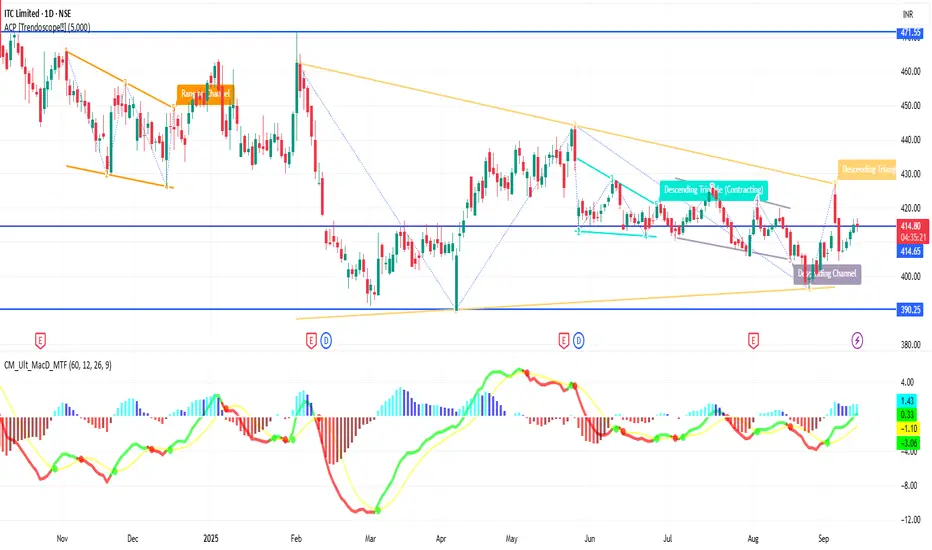
ITC 1D Time frame🔢 Current Level
Trading around ₹414 – ₹432
🔑 Key Resistance & Support Levels
Resistance Zones:
₹435 – ₹438 (near-term resistance; breakout above this may lead to further upside)
₹442 (stronger resistance above)
Support Zones:
₹425 – ₹428 (immediate support)
₹420 (stronger support if price dips further)
₹415 – ₹417 (deeper support zone)
📉 Outlook
Bullish Scenario: If ITC holds above ₹428, upward momentum may continue. Break above ₹438 can open the way toward ₹442+.
Bearish Scenario: If it falls below ₹420, risk increases toward ₹415 – ₹417.
Neutral / Range: Between ₹428 – ₹438, ITC may consolidate before a directional move.
HDFCBANK 1D Time frame🔢 Current Level
Trading around ₹964.55 - ₹967.80
🔑 Key Resistance & Support Levels
Resistance Zones:
₹970 – ₹975 (near-term resistance; breakout above this may lead to further upside)
₹980 (psychological resistance)
₹1,000 (stronger resistance above)
Support Zones:
₹960 – ₹965 (immediate support)
₹950 (stronger support if price dips further)
₹940 – ₹945 (deeper support zone)
📉 Outlook
Bullish Scenario: If HDFCBANK holds above ₹965, upward momentum may continue. Break above ₹975 can open the way toward ₹980+.
Bearish Scenario: If it falls below ₹950, risk increases toward ₹940 – ₹945.
Neutral / Range: Between ₹965 – ₹975, HDFCBANK may consolidate before a directional move.

MARUTI 1D Time frame📍 Current Price Action
Last traded price: ~₹ 15,096
Minimal intraday change (~0.1%, slightly up)
⚙ Technical Indicators
RSI (14): ~72 → strong uptrend / overbought conditions
Stochastic RSI: Low / showing weakness → possible cooling off
CCI (14): ~92 → uptrend strength
MFI (Money Flow Index): ~84 → strong buying pressure
📊 Moving Averages & Trend Strength
Price is above 50-day and 200-day SMAs & EMAs → long-term trend is bullish
20-day SMA/EMA are more neutral-to-slightly bullish
All major moving averages are broadly supporting upwards bias
🔧 Support & Resistance / Pivot Zones
Support Levels: ~₹ 14,900 – ₹ 15,000
Resistance Levels / Pivot: ~₹ 15,300 – ₹ 15,500
🧠 Summary
Maruti is in a strong uptrend on the daily chart. Overbought indicators like RSI and MFI suggest buying strength is high, which also means risk of a short-term pullback or consolidation. Key support ~₹ 15,000 needs to hold for bulls. If price clears resistance near ₹ 15,300-15,500 convincingly, upward move likely to continue.

SENSEX 1D Time frame📍 Current Price Action
Current Level: 81,548
Day’s Range: ~80,320 – 81,550
52-Week Range: 71,425 – 85,978
⚙ Technical Indicators
RSI (14): Around 43 → neutral to slightly bearish zone
MACD: Negative → mild downward pressure still visible
ADX (14): ~35-40 → moderate trend strength
Stochastic Oscillator: Near overbought zone → possible short-term pullback
Moving Averages:
Short-term (5, 10, 20-day): Mixed
Medium & long-term (50, 100, 200-day): Acting as resistance near highs
📊 Key Levels
Immediate Support: 80,800 – 81,000 zone
Immediate Resistance: 81,600 – 81,800 zone
Breakout Levels:
Above 81,800 → upside momentum could target 82,200+
Below 80,800 → downside may test 80,300 – 80,000
🧠 Summary
Sensex is currently at 81,548, near its resistance zone. Trend is neutral to mildly bullish in the short-term. Sustaining above 81,600–81,800 will confirm strength for further rally. A failure to hold could trigger a pullback toward 80,800–80,300.

NIFTY 1D Time frame📍 Current Price Action
Trading around 25,005 – 25,010
Day change: about +0.4%
⚙ Technical Indicators
Moving Averages (5, 10, 20, 50, 100, 200 day): All showing buy signals → bullish structure
RSI (14): In bullish territory, not overbought → healthy momentum
Stochastic Oscillator: Near overbought zone → indicates strength, but chance of a short pullback
MACD: Positive crossover → supports upward momentum
📊 Support & Resistance
Immediate Resistance: 25,000 – 25,100 zone
Immediate Support: 24,800 – 24,900 zone
If price sustains above 25,100 → next upside levels can open higher (towards 25,200+)
If it breaks below 24,900 → downside could test 24,700 levels
🧠 Summary
Nifty 50 is in a bullish daily trend, currently consolidating near psychological resistance at 25,000. As long as it holds above 24,900, the bullish momentum is intact. A breakout above 25,100 could extend the rally further.
Do you also want me to give the weekly time frame (1W) view for a bigger picture trend?
