Supercycle 2025: Metals, Energy, and PricesIntroduction
The global commodities market is experiencing a significant transformation in 2025, characterized by a resurgence in metal and energy prices. This phenomenon, often referred to as a "commodity supercycle," is driven by a confluence of factors including the energy transition, geopolitical tensions, and structural supply constraints. Understanding the dynamics of this supercycle is crucial for investors, policymakers, and industry stakeholders.
1. Understanding the Commodity Supercycle
Definition and Historical Context
A commodity supercycle refers to an extended period during which commodity prices remain well above their long-term trend, typically lasting several years or even decades. Historically, such supercycles have been driven by factors like industrialization, technological advancements, and shifts in global demand.
Current Drivers
In 2025, the supercycle is primarily fueled by:
Energy Transition: The global shift towards renewable energy sources is increasing demand for metals like copper, lithium, and nickel.
Geopolitical Instability: Conflicts and trade tensions are disrupting supply chains, leading to price volatility.
Supply Constraints: Limited investments in mining and energy infrastructure over the past decade are leading to supply shortages.
2. Metals: The Backbone of the Supercycle
Copper
Copper is at the forefront of the current supercycle. Its demand is surging due to its essential role in electric vehicles (EVs), renewable energy systems, and grid infrastructure. In 2025, copper prices have climbed to near-record levels, driven by a complex interplay of surging demand and significant supply disruptions. Analysts project a 30% increase in copper demand by 2040.
Lithium and Nickel
Lithium and nickel are critical for battery production. The rise of EVs and energy storage solutions is propelling their demand. However, supply is struggling to keep pace, leading to price increases.
Gold
Gold has emerged as a safe haven amid economic uncertainties. In October 2025, gold prices surpassed $4,000 per ounce for the first time, marking a 53% increase year-to-date. This rally is attributed to factors like anticipated interest rate cuts, a weak U.S. dollar, and geopolitical instability.
3. Energy: The Fuel of the Supercycle
Oil
The energy sector is witnessing a paradox. While global oil production is at record highs, oversupply concerns are leading to price declines. The U.S. Energy Information Administration (EIA) forecasts U.S. oil production to reach 13.53 million barrels per day in 2025, yet prices are expected to average $65 per barrel, down about 15% from the previous year.
Natural Gas
Natural gas prices are experiencing volatility due to fluctuating demand and supply disruptions. The transition to cleaner energy sources is also impacting its long-term outlook.
Renewable Energy
Investments in renewable energy infrastructure are driving demand for materials like steel, aluminum, and rare earth elements. The shift towards a materials-intensive energy system is reshaping global commodity markets.
4. Implications for Investors and Policymakers
Investment Opportunities
Metals and Mining Stocks: Companies like Tata Steel and Hindalco are benefiting from rising metal prices and increased demand.
Energy Infrastructure: Investments in renewable energy projects and related infrastructure are poised for growth.
Commodity ETFs: Funds like SPDR Gold Shares (GLD) and United States Oil Fund (USO) offer exposure to commodity markets.
Policy Considerations
Supply Chain Resilience: Policymakers must address vulnerabilities in commodity supply chains, especially concerning critical minerals.
Sustainable Mining Practices: Encouraging environmentally responsible mining can mitigate the ecological impact of increased extraction activities.
Energy Transition Strategies: Developing comprehensive plans for transitioning to renewable energy can ensure energy security and economic stability.
5. Conclusion
The commodity supercycle of 2025 presents both challenges and opportunities. While rising prices can benefit producers and investors, they also underscore the need for strategic planning and investment in sustainable practices. As the world continues its transition towards cleaner energy, the dynamics of commodity markets will play a pivotal role in shaping the global economic landscape.
Supertrend

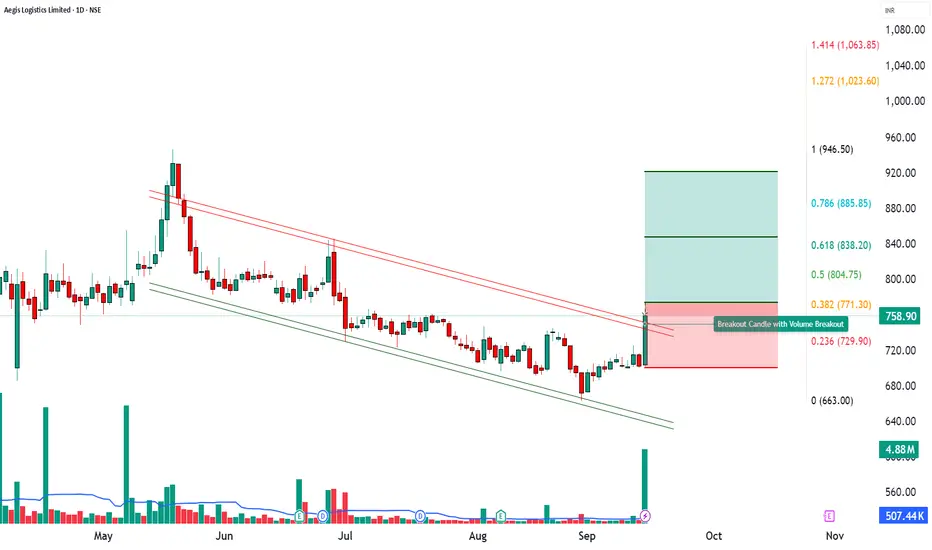
“Aegis Logistics | 20x Volume Breakout Signals Fresh Upside MomAegis Logistics Ltd (CMP: ₹758.90 | +8.07%)
🔎 Technical Outlook:
Aegis Logistics witnessed a 20-day volume breakout with an extraordinary 20X spike in price-volume activity, signaling strong market participation. The stock formed a powerful bullish candle, indicating robust momentum and accumulation interest.
The breakout above recent consolidation zones suggests the potential for a trend continuation if follow-up buying sustains.
________________________________________
📈 Key Levels:
Entry Zone: ₹774
Stop Loss: ₹700.25
Support Levels: 715.5 / 672.1 / 642.85
Resistance Levels: 788.15 / 817.4 / 860.8
Major Resistance Zone: ₹946 – ₹995
________________________________________
🎯 Upside Targets:
Target 1 → ₹847.75
Target 2 → ₹921.50
Target 3 → ₹995.25
Target 4 → ₹1,069
________________________________________
⚡ Why Bullish?
20-Day & 52-Week Volume Breakout confirmation
RSI, Stochastic & MACD supporting bullish bias on daily & weekly charts
Strong momentum candle near breakout zone
Rising interest seen from institutional volumes
________________________________________
📢 Summary:
Aegis Logistics is entering a high-momentum zone. Sustaining above ₹774 can trigger multi-level rallies toward ₹921–₹1,069 in the coming sessions. However, a dip below ₹700 will negate this bullish structure.
📰 Latest News
Aegis Logistics shares surged ~10% in a single day, driven by strong volumes. It was the stock’s highest single-day gain since March. Trading volume hit a four-month high (~31 lakh shares) much above its 20-day average. Business Today
The stock exceeded its 50-day moving average around ₹724, touching resistance zones around ₹763 to ₹772 (100- & 200-day moving averages). Business Today
Additional longer-term news: The joint-venture Aegis Vopak Terminals (AVTL) is planning a ₹2,800 crore IPO to reduce debt and fund expansion; Aegis Logistics has ~50.1% stake in that JV. The Economic Times
Also, an in-principle approval for a new LPG siding (rail facility) at Panambur (New Mangalore Port) for AEGIS Vopak was granted by Palakkad railway division. This could improve LPG logistic flows. The Times of India
📈 Investment Outlook
Aegis Logistics delivered a strong 20-day volume breakout (VolX ≈ 20x) with a sharp bullish candle. Technical momentum plus upcoming catalysts like the JV IPO and new LPG siding approval are fueling sentiment.
________________________________________
📈 Bullish Case – Why the stock could go up
High-volume breakout (20x average) signals institutional accumulation.
Momentum indicators: RSI 63, CCI 177, Stochastic 86 – still bullish.
Sustaining above ₹774 can open upside toward ₹847 – ₹921 initially, then ₹995 – ₹1069.
Positive news: JV IPO plans and LPG siding approval provide structural growth drivers.
📉 Bearish Case – Potential downside risks
Resistance near ₹788 – ₹817 may trigger profit booking.
Failure to sustain above ₹774 could lead to correction back toward ₹729 – ₹715.
Sectoral risks: energy/logistics costs, regulatory delays may hurt sentiment.
⚡ Momentum Case – Short-term Trading Edge
20x volume + bullish MACD on daily and weekly = strong near-term edge.
Bollinger Band breakout adds volatility momentum.
Holding ₹774 may fuel a rally toward ₹847 – ₹921 in 2–5 sessions.
📅 Short-term vs Long-term Perspective
Short-term (1–2 weeks): Test of ₹847–₹921 likely; supports 729–715 are critical.
Long-term (1–3 months): Sustained breakout plus IPO news flow can re-rate stock higher toward ₹995–₹1069.
________________________________________
⚠️ Disclaimer – Please Read Carefully
The information shared here is meant purely for learning and awareness. It is not a buy or sell recommendation and should not be taken as investment advice. I am not a SEBI-registered investment advisor, and all views expressed are based on personal study, chart patterns, and publicly available market data.
Trading — whether in stocks or options — carries risk. Markets can move unexpectedly, and losses can sometimes exceed the money you have invested. Past performance or past setups do not guarantee future results.
If you are a beginner, treat this as a guide to understand how the market works — practice on paper trades before risking real money. If you are experienced, always assess your own risk, position sizing, and strategy suitability before entering trades.
Consult a SEBI-registered financial advisor before making any real trading decision. By engaging with this content, you acknowledge full responsibility for your trades and investments.
💬 Found this useful?
🔼 Give this post a Boost to help more traders discover clean, structured learning.
✍️ Drop your thoughts, questions, or setups in the comments — let’s grow together!
🔁 Share with fellow traders and beginners to spread awareness.
👉 “If you liked this breakdown, follow for more clean, structured setups with discipline at the core.”
🚀 Stay Calm. Stay Clean. Trade With Patience.
Trade Smart | Learn Zones | Be Self-Reliant 📊
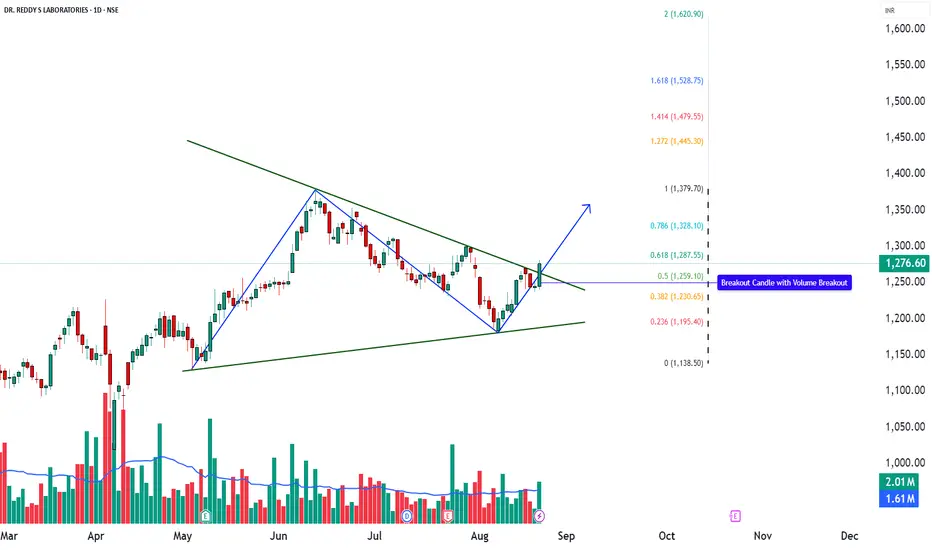
DRREDDY – Triangle Breakout in Play📊 DRREDDY – Technical & Educational Snapshot
Ticker: NSE: DRREDDY | Sector: 💊 Pharma
CMP: ₹1,276.60 ▲ (+2.51% | 22 Aug 2025)
Rating (for learning purpose): ⭐⭐⭐⭐ (Moderately Bullish)
Pattern Observed: 📈 Triangle Breakout with Volume Confirmation
📰 Sentiment Analysis
👉 Overall Sentiment: Positive ✅
• Bullish Drivers: Breakout from triangle formation, Morning Star on daily, bullish PinBar on monthly, strong Q1 results with revenue & profit growth, and renewed interest in pharma sector due to healthcare demand.
• Risks (Bearish Case): Any failure to sustain above ₹1,250 or renewed pressure from regulatory issues/patent challenges could trigger pullbacks.
• Short-term Outlook: Strong breakout with momentum, but some cooling-off likely due to Stochastic overbought levels.
• Long-term Outlook: Positive — consistent financial performance, strong pharma pipeline, and robust technical structure suggest higher upside potential.
📊 Technical Snapshot
DRREDDY has broken out from a triangle formation, supported by a Morning Star candlestick on the daily timeframe and a Bullish PinBar on the monthly chart — both strong reversal cues. A bullish Supertrend, RSI breakout, and Bollinger Band expansion signal renewed buying interest. Volume above the 20-SMA average further validates the breakout, suggesting institutional participation. While momentum is strong, Stochastic is near overbought, which means short-term pullbacks cannot be ruled out. However, as long as price sustains above key support zones, the broader trend bias remains upward.
📊 Volume Check
🔹 Current Volume: 2.01M
🔹 20 SMA Volume: 1.61M ✅
💥 Above-average participation → confirms breakout reliability with demand expansion.
💡 Interpretation: Higher-than-average volumes in breakout zones indicate broader market participation and improve the chances of trend continuation.
💡 Learnings
Breakouts from consolidation patterns like triangles tend to extend into trending moves when supported by momentum indicators (RSI + MACD). Elevated CCI levels indicate consistent buying pressure, but traders should remain alert to possible short pullbacks, especially when Stochastic enters the overbought zone. Defining a stop-loss and invalidation level is key for disciplined trade management.
📌 Key Levels
Resistance: 1292 | 1308 | 1334
Support: 1251 | 1225 | 1209
Fibonacci Levels: 1138.50 | 1195.40 | 1230.65 | 1259.10 | 1287.55 | 1328.10 | 1379.70
🎯 STWP Learning Reference
• Observed breakout zone: ~1281.8
• Key support level: ~1236
• Upside reference zones (if momentum continues): 1327 | 1372
• Pullback watch zone: 1224–1230 (where demand has earlier emerged)
• Invalidation reference: Below 1195 (trend may weaken)
⚠️ Disclaimer – Please Read Carefully
The information shared here is meant purely for learning and awareness. It is not a buy or sell recommendation and should not be taken as investment advice. I am not a SEBI-registered investment advisor, and all views expressed are based on personal study, chart patterns, and publicly available market data.
Trading — whether in stocks or options — carries risk. Markets can move unexpectedly, and losses can sometimes exceed the money you have invested. Past performance or past setups do not guarantee future results.
If you are a beginner, treat this as a guide to understand how the market works — practice on paper trades before risking real money. If you are experienced, always assess your own risk, position sizing, and strategy suitability before entering trades.
Consult a SEBI-registered financial advisor before making any real trading decision. By engaging with this content, you acknowledge full responsibility for your trades and investments.
💬 Found this useful?
🔼 Give this post a Boost to help more traders discover clean, structured learning.
✍️ Drop your thoughts, questions, or setups in the comments — let’s grow together!
🔁 Share with fellow traders and beginners to spread awareness.
✅ Follow simpletradewithpatience for beginner-friendly setups, price action insights & disciplined trading content.
🚀 Stay Calm. Stay Clean. Trade With Patience.
Trade Smart | Learn Zones | Be Self-Reliant 📊
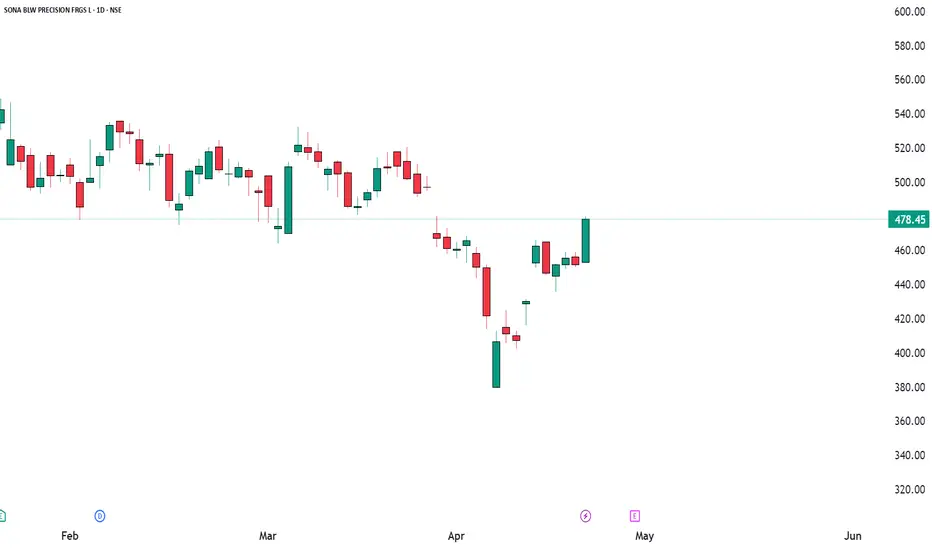
Bullish Breakout SetupSONACOMS (5.95%)
Bullish Setup Alert
We are seeing a strong bullish signal for SONACOMS, with multiple key indicators aligning for a potential breakout. A Bullish Marubozu candlestick has formed, indicating strong bullish momentum. Additionally, the RSI has broken out, signaling increasing buying strength. The SuperTrend and VWAP both confirm bullish sentiment, while the TTM Squeeze suggests a volatility breakout in the making.
Resistance Levels: 488-497-515
Support Levels: 461-444-434
Entry: @/above 479.85
Stop Loss: @/below 448.30
Volume Analysis: Volume has been robust, which could suggest accumulation and increased market interest.
ZOMATO A CHANNEL CONSOLIDATION WILL IT BREAKOUT OR FIZZLE OUT ?Zomato Ltd. is an interesting chart in momentum with following
1. RSI on all time frames (D/W/M) above 60
2. Narrowing Bollinger Bands on daily chart with price walking near Upper Band
3. Four months long consolidation in range of 240 to 295 zone
4. ABCD pattern under formation on weekly chart
5. Major Price Supports as under:
20 SMA (daily ) 263
50 EMA (daily ) 264
20 SMA (weekly) 261
with cluster of supports in range of 260-264 can be a good risk reward trade. Fibonacci projection tool projects targets of 333 and 358 Lets see if it sustains the trend or fizzles out
Lets See How it Evolves.
Disclaimer: NOT A BUY / SELL RECOMMENDATION I am not an expert I just share interesting charts here for educational purpose and not to be taken as buy/sell recommendation. Please seek expert opinion before investing and trading as trading/ investing in market is subject to market risks. I do not hold any position in the stock as on date but I may look to take some position with my own Risk Reward matrix.
ZLong

HFCL looking good; 100% ROI possible; take a lookFundamentally good stock,
Good For short term investment in cash market'.
Leave a " Like If you agree " .👍
.
.
Entry: 110 / 105
target: 115- 125- 150 - 195
sl: 95
major stoploss / support: 90
.
.
Enter only after breaking & close above " Yellow box" mentioned.
'
'
Don't make complicated trade set-up.📈📉
Keep it " simple, focus on consistency💹
Refer our old ideas for accuracy rate🧑💻
Valuable comments are welcomed-✌️
.
Refer old ideas attached below

ASIANPAINT BREAKOUT!!! NSE:ASIANPAINT
As seen on the chart price breaking out of recent range. From here Asian paint could move up.
Good delivery volumes.
Supertrend changed to buy after 70 days.

Granules is granulating the speed process #SuperChartzKey Levels:
Support: 408
Resistance 450, 520, 650
Key Drivers:
Granules India is a pharmaceutical company with a market capitalization of ₹10,876 crore. Its current stock price stands at ₹449, with a high/low range of ₹453/₹268. The stock has a P/E ratio of 27.6 and a price-to-book value of 3.65. Its EPS is ₹16.3, and it offers a dividend yield of 0.34%. The company has shown robust returns with a 16.9% return over 3 months and a 7.49% return over 3 years. Granules India maintains strong financial health with an ROE and ROCE of 19.1% and 19.4% respectively. It has a healthy current ratio of 1.35 and a debt-to-equity ratio of 0.47. The company's OPM stands at 18.3%, with sales totaling ₹4,526 crore. Granules India's enterprise value is ₹11,944 crore, with an EVEBITDA of 14.3 and a CMP/FCF of 76.8. Overall, Granules India demonstrates solid financial performance and stability in the pharmaceutical industry.

Nifty 50: Supertrend Bullish SignalHello everyone,
The Pro Supertrend Calculator confirms a bullish trend for the Nifty 50, and here is the underlying analysis. When we observe a sequence of 35 consecutive periods above the Supertrend line, a robust signal emerges. Out of these 40 instances, prices were above the line 70 times and below only 39 times. It's not just a series of numbers; rather, it's a dynamic representation of the market's evolution.
Now, let's delve into the technical aspect without veering into informal terms. The Supertrend, in its calculation, relies on a meticulous analysis of trends and volatility, adjusting its trajectory based on market developments.
Currently, the Supertrend paints a bullish outlook for the Nasdaq with a confirmed probability of 63%. To clarify, it's not just a line on the chart; it's an intelligent guide amidst the trading tumult. As we navigate this bullish wave, may you find in the Supertrend a reliable ally, guiding us toward successful transactions and substantial profits.
To your success in trading and best wishes!

going longa good rr setup is waiting so lets ride the trend and get some bucks
hope to get target( can also go wrong so manage the risk well)

TATA Chemicals: Bracing for a Potential Trend Reversal !TATA Chemicals has been showing signs of a potential trend reversal in recent days, as the stock price has been trading within a tight range and forming a bullish pattern. The market trend analysis suggests that the stock has been consolidating after a prolonged downtrend, indicating a possible shift in sentiment. The price action of TATA Chemicals has also been showing a higher likelihood of a breakout to the upside, as seen in the series of higher lows and higher highs forming on the charts. Furthermore, the technical indicators such as Moving Averages, Relative Strength Index (RSI) and the MACD have been signaling a bullish bias, with the RSI breaking above the 50 level and the MACD line crossing above the signal line. These indicators provide additional confirmation of the potential trend reversal, making TATA Chemicals an attractive prospect for traders who are looking for a potential buying opportunity.

Zydus Life – Cup and Handle BreakoutKey Points:
- Bullish cup and handle patter with potential of 23% rise from current price
- Resistance breakout @ 474
- RSI near to cross 70
- Tech showing buy signals
- Price is above 20,50,200 EMA
- Volume above average
- Super trend is possitive
Bhav is “ Bhagwan ”
Disclaimer :
I am not a SEBI registered Analyst.
Please do your own Analysis before taking any trade/investment.
The above view is just for educational purpose only.

ECLERX DELIVERS A GOOD EARNINGS REPORT.ECLERX has a good support zone and bounced from same zone four times .Big volume spikes signifies accumulation .For initial Entry watch pullback and reaction around 200 DMA and then trail with Supertrend.

Bandhan BankBandhan bank gives a bullish signal today due to following reasons.
1. crossed and closed above @ 289.45 which is a resistance for last 2 months
2. on daily basis, closing price touched upper line of bollinger band, which is usually a bullish sign.
3. Supertrend likely to change its trend.
4. keeping a stoploss as a support.

INFY more downside below 1518- Intraday LevelsIf INFY crosses below 1518 on Monday then a spectacular fall would be seen after a sweet pullback to one of the 10,20 or 50 EMA trending downwards.
The supertrend is also showing bearish signals.
As visible on the charts, the 10 EMA has crossed the 20 EMA , looking at the direction, a fall is expected as the trendline is also broken on the downside.

BANKNIFTY more downside below 35174- Intraday LevelsIf BANKNIFTY crosses below 35174 on Monday then a spectacular fall would be seen after a sweet pullback to one of the 10,20 or 50 EMA trending downwards.
The supertrend is also showing bearish signals.
As visible on the charts, the 10 EMA has crossed the 20 EMA , looking at the direction, a fall is expected as the trendline is also broken on the downside.

NIFTY more downside below 16568- Intraday LevelsIf NIFTY 50 crosses below 16568 on Monday then a spectacular fall would be seen after a sweet pullback to one of the 10,20 or 50 EMA trending downwards.
The supertrend is also showing bearish signals.
As visible on the charts, the 10 EMA has crossed the 20 EMA, looking at the direction, a fall is expected as the trendline is also broken on the downside.

Reversal in Yes BankConverging EMAs along with price closing above 200 EMA on a Daily time frame. Supertrend, Hilega Milega, and Relative strength all are positive. Accumulation can also be seen in the volumes along with high delivery. This could be a good reversal trade.

DELTA CORP (Swing Trading Setup)
Buy Above Resistance Breakout
TimeFrame(for Entry & Exit & SuperTrend) :- 1 Hour TF
SuperTrend Settings ( Length 10, Factor 3 )
Initial Stop-Loss Below SuperTrend & Trail Stop-Loss with SuperTrend
Exit When Hourly Candle Close Below Super Trend
Use Very Less Capital So that Even If Stop loss Hit your Emotions Doesn't hit you
Date :- 23-01-2022

A great day for Intraday for MCXGOLDPETAL JAN 2022 For intraday he price is expected to rise today as both the super trend and Eponential Moving Avg both indicats a postive trend
One can trade at CMP 4818 may be used as a buying opportunity for a upside target of 4828/48032 with a Stoploss 4795

Breakout retested in CENTEXTMultiple indicators are showing Bullish signs. Hilega-Milega is Bullish. Supertrend is Bullish. Relative Strength is Good as well.

Momentum in VIVIMEDLABMultiple indicators are showing Bullish signs. Hilega Milega is Bullish. Supertrend is Bullish. Relative Strength is increasing as well.

ENDURANCE (Swing Trading Setup)
Buy Above TrendLine ( Already Breakout Happen )
TimeFrame(for Entry & Exit & SuperTrend) :- Hourly
SuperTrend Settings ( Length 10, Factor 3 )
Intial Stop-Loss Below SuperTrend & Trail Stop-Loss with SuperTrend
Exit When Hourly Candle Close Below Super Trend
Use Very Less Capital So that Even If Stop loss Hit your Emotions Doesn't hit you
Date :- 16-01-2022
