ATH Breakout Pullback: Smart Money Reloading at Demand Zone?Price has corrected from an all-time high and is now revisiting a high-quality demand zone that played a key role in breaking previous highs. This is not a random pullback — this is a structurally important retest. Let’s decode what the chart is really saying using pure Supply & Demand and Price Action.
📊 Higher Timeframe & Intermediate Trend Context
The weekly structure remains firmly bullish. Price has already achieved something critical: it broke and closed above the previous all-time high. This single fact changes the entire narrative.
When a market makes a fresh all-time high, it confirms:
• Strong institutional participation
• Absence of historical supply overhead
• A higher probability of continuation over deep reversal
The current move is best understood as a corrective pullback within a dominant higher-timeframe uptrend, not trend reversal.
📦 Demand Zone Logic: Why This Area Matters 🧠
The demand zone currently in play is not just any zone — it is the origin of the rally that led to the all-time high breakout. That gives this zone exceptional importance.
Key observations:
• This zone generated a powerful follow-through move
• It successfully absorbed supply and pushed price into price discovery
• Previous all-time high was broken after leaving this zone
Such zones often act as institutional reload zones, where large players look to re-enter positions during corrections.
🧩 Zone Structure & Strength
• The base is clean and well-defined
• The leg-out was explosive, signaling urgency from buyers
• Very limited basing candles, which increases imbalance
• First meaningful return after the breakout, enhancing freshness
This combination significantly improves the credibility of the zone.
🧠 Market Psychology Behind the Pullback
After an all-time high, weaker hands tend to book profits aggressively, mistaking correction for reversal. Meanwhile, stronger hands wait patiently for price to return to value.
📐 Trade Logic & Risk–Reward Perspective 🎯
The trade idea on the chart is structured around a 1:3 risk-to-reward ratio, which aligns well with:
• Higher timeframe Uptrend
• Strong demand location
• Favourable asymmetry between risk and potential reward
⚠️ Risk Awareness & Execution Discipline ⚖️
Even the best demand zones can fail. No setup is 100% reliable. Always define risk first, respect invalidation, and avoid emotional decision-making. Capital protection is more important than being right.
📌 Final Takeaway 🧭
higher-timeframe uptrend, all-time high breakout, and a controlled pullback into a good demand zone. Now, price action inside this area will decide the next move — reaction matters more than anticipation.
“Big trends are built on deep patience and precise execution.” 🔥📊
Thank you for your support, your likes & comments. Feel free to ask if you have questions.
This analysis is for educational purposes only and not intended as a trading or investment recommendation. I am not a SEBI registered analyst.
Supply and Demand
Nifty Intraday Analysis for 03rd February 2026NSE:NIFTY
Index has resistance near 25275 – 25325 range and if index crosses and sustains above this level then may reach near 25500 – 25550 range.
Nifty has immediate support near 24900 – 24850 range and if this support is broken then index may tank near 24675 – 24625 range.
The index is expected to be range bound. However, Iran US talk progress will decide momentum in the near term.
USA reduced TARIFF to 18%! Recovery for NIFTY!?Following the global cues, we can see SGX rose over 3 percent following the statement that USA has reduced tariff to 18 percent which will give temporary push to NIFTY but yet our supply zones will act as important zones hence we will trade based on rejection on your demand and supply zone so plan your trades accordingly and keep watching everyone.
Positional or Longterm Opportunity in NAVA LtdGo Long @ 570.9 for Targets of 607.25, 643.6, 679.95 and 716.3 with SL 534.55
Reasons to go Long :
1. The stock formed a Bullish Engulfing Pattern (marked with a orange color).
2. Also there is a strong Trendline (marked with green color) which supports the stock.
3. Also there is a strong demand zone (marked with a purple color) from which the stock is taking support.
BACK to PAVILION! Focus on technicals now! As analysed NIFTY couldn’t sustain itself at higher levels and fell unidirectionally but it managed to close above our demand zone. As per our analysis, NIFTY is still weak and might continue its bearishness hence unless we see signs of reversal from 25500, every rise can be sold and can be traded based on technicals so plan your trades accordingly and keep watching everyone.
Nifty Intraday Analysis for 04th February 2026NSE:NIFTY
Index has resistance near 26000 – 26050 range and if index crosses and sustains above this level then may reach near 25275 – 25325 range.
Nifty has immediate support near 25500 – 22450 range and if this support is broken then index may tank near 25225 – 25175 range.
Expect continued volatility and swings until the India-US trade deal developments establish a new market base. It will be interesting to watch whether Gap created on 3rd February’26 will be respected in near term or filled by short traders.
Banknifty Intraday Analysis for 04th February 2026NSE:BANKNIFTY
Index has resistance near 60450 – 60550 range and if index crosses and sustains above this level then may reach near 60950 – 61050 range.
Banknifty has immediate support near 59650 - 59550 range and if this support is broken then index may tank near 59150 - 59050 range.
Expect continued volatility and swings until the India-US trade deal developments establish a new market base. It will be interesting to watch whether Gap created on 3rd February’26 will be respected in near term or filled by short traders.
Finnifty Intraday Analysis for 04th February 2026 NSE:CNXFINANCE
Index has resistance near 27900 - 27950 range and if index crosses and sustains above this level then may reach near 28175 - 28225 range.
Finnifty has immediate support near 27450 – 27400 range and if this support is broken then index may tank near 26175 – 26125 range.
Expect continued volatility and swings until the India-US trade deal developments establish a new market base. It will be interesting to watch whether Gap created on 3rd February’26 will be respected in near term or filled by short traders.
Midnifty Intraday Analysis for 04th February 2026NSE:NIFTY_MID_SELECT
Index has immediate resistance near 13775 – 13800 range and if index crosses and sustains above this level then may reach 13925 – 13950 range.
Midnifty has immediate support near 13525 – 13500 range and if this support is broken then index may tank near 13375 – 13350 range.
Expect continued volatility and swings until the India-US trade deal developments establish a new market base. It will be interesting to watch whether Gap created on 3rd February’26 will be respected in near term or filled by short traders.
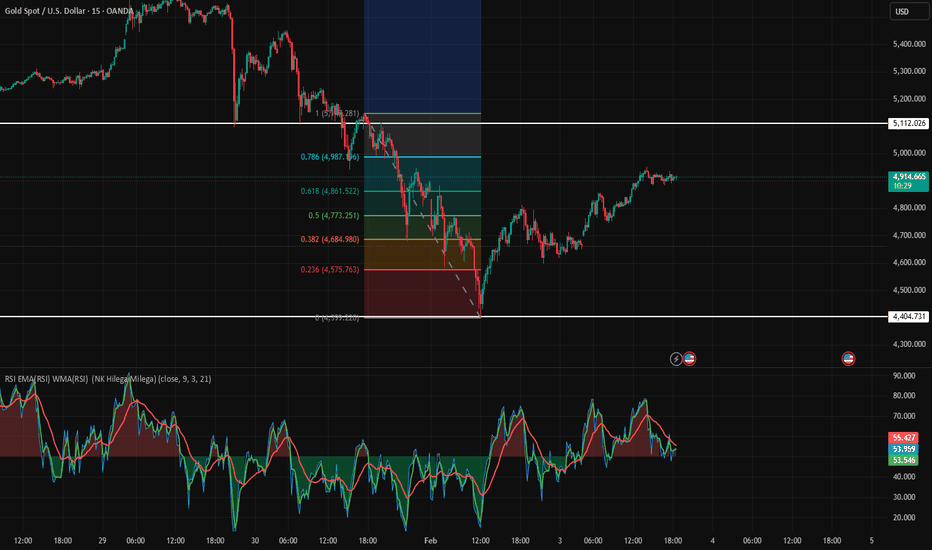
Flash Crash || XAUSD/GOLDThe gold market (XAU/USD) is currently navigating a period of intense volatility, shifting from a historic "blow-off" rally to a sharp technical correction. As of February 3, 2026, the market is attempting a relief bounce after a dramatic weekend crash.
📈 Market Snapshot (Feb 3, 2026)
Following a record high near $5,600/oz in late January, gold experienced a "flash crash" toward the $4,400–$4,600 range. Today, prices have stabilized and are rebounding slightly.
Current Spot Price: Hovering around $4,800 – $4,900/oz.
Key Resistance: $4,930 (50-day EMA) and the psychological $5,000 barrier.
Key Support: $4,400 (the recent floor) and $4,650.
🔍 Why the Recent Crash?
The market didn't just "dip"—it plummeted due to a perfect storm of technical and macro triggers:
The "Warsh Shock": The nomination of Kevin Warsh as Fed Chair sparked fears of a more hawkish (higher interest rates) monetary policy, strengthening the US Dollar.
Margin Hikes: The CME Group increased margin requirements for gold futures. This forced over-leveraged traders to sell immediately, creating a "snowball effect" of liquidations.
US Budget & Shutdown Fears: While the Indian Union Budget (Feb 1) saw a domestic price correction of ~3-5%, global markets were reacting to a partial US government shutdown, which initially created uncertainty but eventually led to a stronger Dollar.
Extreme Profit Taking: After gold nearly doubled in a year, a massive wave of profit-booking was inevitable once the momentum stalled.
🛠️ Technical Outlook & Next Steps
Based on the current chart structure and your inquiry, here is a breakdown of the immediate path forward:
1. The Rebound Phase
Gold is currently in a "mean reversion" bounce. The RSI (Relative Strength Index) has moved out of oversold territory, suggesting the panic selling has paused. However, for a true trend reversal, gold must close above $4,930 on a daily timeframe.
2. Strategic Scenarios
Scenario Price Action Recommendation
Bullish Break - Price closes above $5,000 Potential for a retest of $5,200. Momentum returns.
Consolidation - Stays between $4,700 - $4,900 A "wait and watch" zone. High risk of choppy "sideways" movement.
Bearish Failure - Fails at $4,900 and breaks $4,650 Risk of a secondary drop back toward the $4,400 floor.
3. Long-Term View
Despite the crash, many institutional analysts (including J.P. Morgan) maintain a $6,000+ target for late 2026, citing continued central bank buying and global de-dollarization.
Banknifty Intraday Analysis for 03rd February 2026NSE:BANKNIFTY
Index has resistance near 59000 – 59100 range and if index crosses and sustains above this level then may reach near 59500 – 59600 range.
Banknifty has immediate support near 58200 - 58100 range and if this support is broken then index may tank near 57700 - 57600 range.
The index is expected to be range bound. However, Iran US talk progress will decide momentum in the near term.
Finnifty Intraday Analysis for 03rd February 2026 NSE:CNXFINANCE
Index has resistance near 27025 - 27075 range and if index crosses and sustains above this level then may reach near 27300 - 27350 range.
Finnifty has immediate support near 26575 – 26525 range and if this support is broken then index may tank near 26300 – 26250 range.
The index is expected to be range bound. However, Iran US talk progress will decide momentum in the near term.
Midnifty Intraday Analysis for 03rd February 2026NSE:NIFTY_MID_SELECT
Index has immediate resistance near 13375 – 13400 range and if index crosses and sustains above this level then may reach 13525 – 13550 range.
Midnifty has immediate support near 13125 – 13100 range and if this support is broken then index may tank near 12975 – 12950 range.
The index is expected to be range bound. However, Iran US talk progress will decide momentum in the near term.
NIFTY rally coming due TO BANKNIFTY/NIFTY DIVERGENCENIFTY and BANKNIFTY have created a significant spread divergence, with NIFTY showing relative strength while BANKNIFTY remains comparatively muted. Such expansion in the spread often indicates sectoral rotation, where capital shifts away from banking heavyweights and flows into broader market constituents. This type of divergence typically precedes impulsive moves in the stronger index rather than immediate mean reversion.
From a price-action perspective, NIFTY holding firm while BANKNIFTY lags suggests absorption of supply and sustained buying interest in non-banking sectors. If the spread continues to widen or remains elevated, it increases the probability of a strong directional move in NIFTY during the session. Overall structure points toward a potential sharp rally in NIFTY today, while traders should monitor the spread behavior closely for continuation or invalidation. As always, manage risk and trade the structure, not the bias.
TARGET - 25800
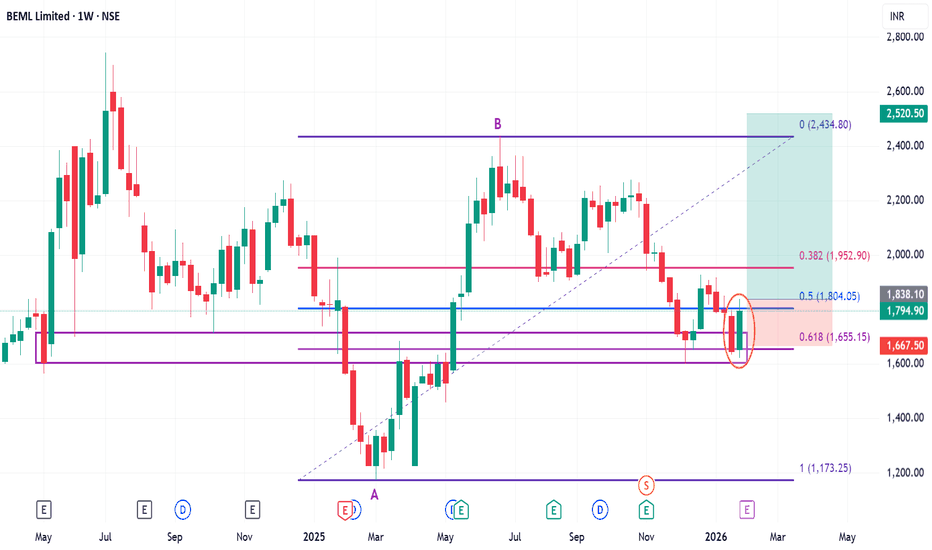
Positional or Longterm Opportunity in BEMLGo Long @ 1838.1 for Targets of 2008.7, 2179.3, 2349.9, and 2520.5 with SL 1667.5
Reasons to go Long :
1. On Weekly timeframe If we draw Fibonacci retracement from the recent swing low (A) to the swing high (B) then the stock took support from the 0.618 Fibonacci level.
2. In addition to this, the stock formed a Bullish Engulfing Pattern (marked with a orange color) around 0.618 Fibonacci level.
3. Also there is a strong demand zone (marked with a purple color) from which the stock is taking support.
Positional or Longterm Opportunity in HBL EngineeringGo Long @ 794.1 for Targets of 867.05, 940, 1012.95, and 1085.9 with SL 721.15
Reasons to go Long :
1. On Weekly timeframe If we draw Fibonacci retracement from the recent swing low (A) to the swing high (B) then the stock took support from the 0.382 Fibonacci level.
2. In addition to this, the stock formed a Bullish Engulfing Pattern (marked with a orange color) around 0.382 Fibonacci level.
3. Also there is a strong demand zone (marked with a purple color) from which the stock is taking support.
Nifty Intraday Analysis for 02nd February 2026NSE:NIFTY
Index has resistance near 25025 – 25075 range and if index crosses and sustains above this level then may reach near 25275 – 25325 range.
Nifty has immediate support near 24625 – 24575 range and if this support is broken then index may tank near 24375 – 24325 range.
The market is expected to trend downward due to geopolitical uncertainty and the hike in STT on the F&O segment proposed in the Union Budget 2026-27.
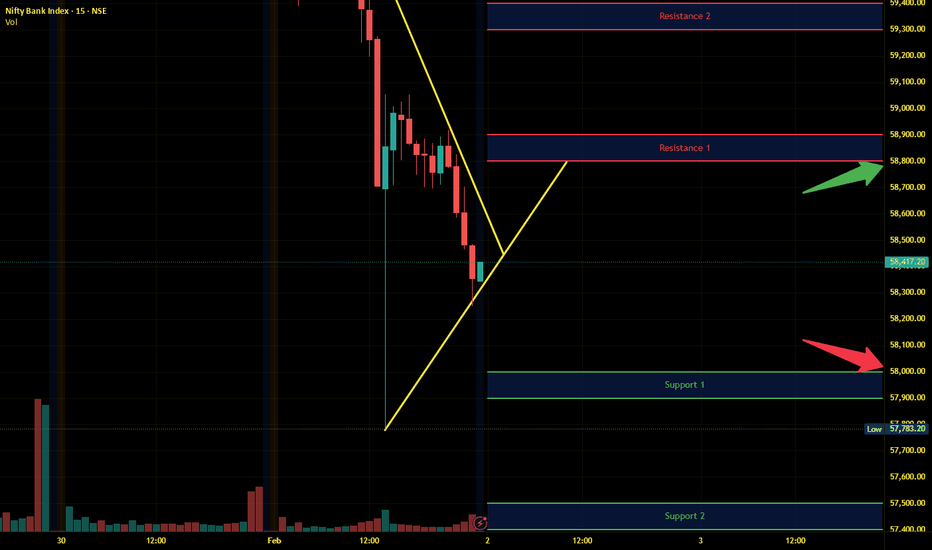
Banknifty Intraday Analysis for 02nd February 2026NSE:BANKNIFTY
Index has resistance near 58800 – 58900 range and if index crosses and sustains above this level then may reach near 59300 – 59400 range.
Banknifty has immediate support near 58000 - 57900 range and if this support is broken then index may tank near 57500 - 57400 range.
The market is expected to trend downward due to geopolitical uncertainty and the hike in STT on the F&O segment proposed in the Union Budget 2026-27.
Finnifty Intraday Analysis for 02nd February 2026 NSE:CNXFINANCE
Index has resistance near 26925 - 26975 range and if index crosses and sustains above this level then may reach near 272005 - 27250 range.
Finnifty has immediate support near 26475 – 26425 range and if this support is broken then index may tank near 26200 – 26150 range.
The market is expected to trend downward due to geopolitical uncertainty and the hike in STT on the F&O segment proposed in the Union Budget 2026-27.
Midnifty Intraday Analysis for 02nd February 2026NSE:NIFTY_MID_SELECT
Index has immediate resistance near 13150 – 13175 range and if index crosses and sustains above this level then may reach 13300 – 13325 range.
Midnifty has immediate support near 12900 – 12875 range and if this support is broken then index may tank near 12750 – 12725 range.
The market is expected to trend downward due to geopolitical uncertainty and the hike in STT on the F&O segment proposed in the Union Budget 2026-27.


