Part 2 Support and Resistance Why Traders Use Options
Options are versatile instruments. Traders use them for:
Speculation – Betting on price movement to earn profits.
Hedging – Protecting existing investments from adverse price moves.
Income Generation – Selling options (writing) to earn the premium.
For example:
A trader may buy a call option expecting prices to rise.
A portfolio manager may buy put options to protect their stocks from falling prices.
An experienced investor may sell covered calls to earn regular income.
Support

EMA vs SMA vs WMA: Which Moving Average Should You Use?🔎 Intro / Overview
Moving Averages remain one of the most trusted tools in technical analysis. They smooth price action, highlight the trend, and often act as dynamic support or resistance.
In this post, we compare the 20-period SMA, EMA, and WMA on BTCUSD 4H to show how each reacts differently to market moves.
___________________________________________________________
📔 Concept
SMA (Simple Moving Average): Every candle in the lookback is weighted equally → smooth but slower to react.
EMA (Exponential Moving Average): Recent candles carry more weight → reacts faster, hugs price closely.
WMA (Weighted Moving Average): Linear weighting → a balance between SMA’s stability and EMA’s sensitivity.
The difference lies in responsiveness. Faster averages react early but risk false signals, slower averages confirm trends but lag.
___________________________________________________________
📌 How to Use
1️⃣ Plot the 20-period SMA, EMA, and WMA together.
2️⃣ Watch how each responds during pullbacks, rallies, and consolidations.
3️⃣ Use EMA for quicker signals, SMA for smoother long-term view, and WMA if you prefer a middle ground.
4️⃣ Combine with price action or RSI to avoid relying on moving averages alone.
___________________________________________________________
🎯 Trading Plan
Intraday traders: EMA crossovers (e.g., 9 vs 21 EMA) for faster entries and exits.
Swing traders: SMA for identifying trend direction and major support/resistance.
Balanced traders: WMA for medium-term setups where stability and responsiveness matter equally.
Always align the moving average with your trading style and risk appetite.
___________________________________________________________
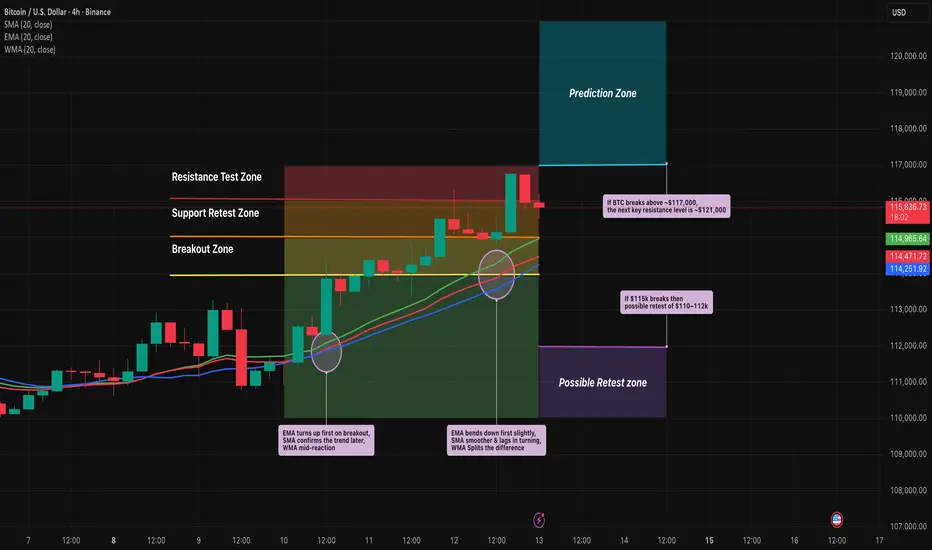
📊 Chart Explanation
On BTCUSD 4H:
EMA (red) bent upward first during the $114k breakout, SMA (blue) confirmed later, and WMA (green) sat between them.
At the $115k retest, EMA dipped first, while SMA lagged.
At $116.5–117k resistance, EMA whipsawed but SMA stayed smoother.
Notice how these differences become clear during sharp pullbacks, quick rallies, and sideways ranges.
___________________________________________________________
👀 Observation
EMA is quick but noisy ⚡, SMA is calm but late 🕰️, WMA strikes a middle ground ⚖️.
___________________________________________________________
❗ Why It Matters?
Choosing the right moving average impacts how quickly you spot entries, confirm trends, and manage stop-losses. Understanding the differences helps traders adapt strategies to both trending and sideways markets.
___________________________________________________________
🎯 Conclusion
No single moving average is “best.” Each serves a purpose depending on the timeframe and style of trading. The key is consistency — choose one that aligns with your plan, test it, and apply it with discipline.
👉 Which one do you prefer in your trading — EMA, SMA, or WMA?
___________________________________________________________
⚠️ Disclaimer
📘 For educational purposes only ·
🙅 Not SEBI registered ·
❌ Not a buy/sell recommendation ·
🧠 Purely a learning resource ·
📊 Not Financial Advice
Profitable Trading The defining feature of day trading is that traders do not hold positions overnight; instead, they seek to profit from short-term price movements occurring during the trading session.It can be considered one of the most profitable trading methods available to investors.
The Rule of 90 is a grim statistic that serves as a sobering reminder of the difficulty of trading. According to this rule, 90% of novice traders will experience significant losses within their first 90 days of trading, ultimately wiping out 90% of their initial capital.

Advance divergence Strong divergence is the most reliable type of divergence, often signaling a significant reversal. It occurs when the price makes a new high or low, but the indicator fails to do so, indicating weakening momentum.
Traders use divergence to assess the underlying momentum in the price of an asset, and for assessing the likelihood of a price reversal. For example, investors can plot oscillators, like the Relative Strength Index (RSI), on a price chart.

Technical trading Technical trading is a broader style that is not necessarily limited to trading. Generally, a technician uses historical patterns of trading data to predict what might happen to stocks in the future. This is the same method practiced by economists and meteorologists: looking to the past for insight into the future.

Option and Database trading Options data captures information on options contracts, including pricing and trading volumes, useful for investment strategies. Discover our guide and top options data providers. Options are a type of contract that gives the buyer the right to buy or sell a security at a specified price at some point in the future.

PCR in trading The Put-Call Ratio (PCR) is a popular technical indicator used by investors to assess market sentiment. It is calculated by dividing the volume or open interest of put options by call options over a specific time period. A higher PCR suggests bearish sentiment, while a lower PCR indicates bullish sentiment.

Option chain in trading Option chain is a chart that will give in-depth information related to all stock contracts available for Nifty stocks. The best thing about the option chain is that it provides valuable information about the current security value and how it will affect it in the long term.

Lecture for option trader Hammer & Hanging Man Patterns + Examples. 5min video.
Put Options: Buying vs. Selling. 3min video.
"Bread & Butter" Iron Condor Rules, POPs and Visuals. 4min video.
Instruments to trade Volatility. 10min video.
Strike Price - ITM ATM OTM. 7min video.
You can get started trading options by opening an account, choosing to buy or sell puts or calls, and choosing an appropriate strike price and timeframe. Generally speaking, call buyers and put sellers profit when the underlying stock rises in value. Put buyers and call sellers profit when it falls.

Advance divergence Seeing divergence increases profitability by alerting a trader to protect profits. Technical traders generally use divergence when the price moves in the opposite direction of a technical indicator.
Strong divergence is the most reliable type of divergence, often signaling a significant reversal. It occurs when the price makes a new high or low, but the indicator fails to do so, indicating weakening momentum.

Database tradingThere are four types of trading: day trading, position trading, swing trading, and scalping. Traders should pick one that suits them and figure out the risks and costs to trade safely. What is stock market trading?
Deutsche Bank in association with Sharekhan Ltd brings to you db TradePro, a unique platform for trading in shares online. A superior trading platform and multi-channel access are just two of the many benefits that Deutsche Bank customers enjoy by trading through db TradePro*.

market analysis in tradingThe goal of a market analysis is to determine the attractiveness of a market, both now and in the future. Organizations evaluate the future attractiveness of a market by gaining an understanding of evolving opportunities and threats as they relate to that organization's own strengths and weaknesses.
Market analysis refers to the process of analyzing financial markets. This process encompasses various types of analysis, often assigned to two categories, technical analysis and fundamental analysis.

option and database trading Options data captures information on options contracts, including pricing and trading volumes, useful for investment strategies. Discover our guide and top options data providers.
Options are a type of contract that gives the buyer the right to buy or sell a security at a specified price at some point in the future. An option holder is essentially paying a premium for the right to buy or sell the security within a certain time frame.

RSI in trading The relative strength index (RSI) is a momentum indicator that measures recent price changes as it moves between 0 and 100. The RSI provides short-term buy and sell signals and is used to track the overbought and oversold levels of an asset.

Option tradingOptions are a type of contract that gives the buyer the right to buy or sell a security at a specified price at some point in the future. An option holder is essentially paying a premium for the right to buy or sell the security within a certain time frame.
When options are better. Options can be a better choice when you want to limit risk to a certain amount. Options can allow you to earn a stock-like return while investing less money, so they can be a way to limit your risk within certain bounds. Options can be a useful strategy when you're an advanced investor.

ADX in trading The average directional index (ADX) is a technical indicator used by traders to determine the strength of a financial security's price trend. It helps them reduce risk and increase profit potential by trading in the direction of a strong trend.

RSI divergenceAn RSI divergence occurs when the indicator and price begin to reach different levels, indicating a change in momentum that precedes a change in price direction. For example, a bullish divergence occurs when the security makes a lower low but the indicator forms a higher low.

Option trading Options are a type of contract that gives the buyer the right to buy or sell a security at a specified price at some point in the future. An option holder is essentially paying a premium for the right to buy or sell the security within a certain time frame.
When options are better. Options can be a better choice when you want to limit risk to a certain amount. Options can allow you to earn a stock-like return while investing less money, so they can be a way to limit your risk within certain bounds. Options can be a useful strategy when you're an advanced investor.

Technical trading Technical analysis is a trading strategy used by investors to identify new investment possibilities. To anticipate future price movements of stocks or other assets, for example, past price and volume data is studied and shown on graphic charts, where trends, patterns, and technical indicators can be identified.

Option Trading Options are a type of contract that gives the buyer the right to buy or sell a security at a specified price at some point in the future. An option holder is essentially paying a premium for the right to buy or sell the security within a certain time frame.
You don't need a considerable sum of money to become an options trader. You can start small with a capital of less than Rs 2 lakhs too. However, as you start small, you need to be a careful trader so that you can cut down on the possibility of losses and enhance the return potential of your trades.

Basic detail of MACDA Moving Average Convergence Divergence indicator is a trend-following momentum indicator that depicts the relationship between two price-moving averages. Traders use the MACD to determine whether bullish or bearish momentum is strong in order to determine when to enter and exit transactions.
When the MACD line crosses above the signal line, it can be read as an indication to buy, while when it crosses below the signal line, it is an indication to sell.

Database trading Assets which can be considered trade secrets may include 'know-how' databases, recipes, technical designs, software code or even pricing matrices, and must be protected via the implementation of a trade secrets policy.
There are four types of trading: day trading, position trading, swing trading, and scalping. Traders should pick one that suits them and figure out the risks and costs to trade safely. What is stock market trading?

Advance trading Advanced trading strategies usually involve multiple technical indicators and more complicated instruments, such as options and futures. Why Not Buy Before the Dividend and Then Sell? By. Brian Beers.
Advanced traders use a range of sophisticated tools to decode market trends. This includes understanding complex chart patterns, trend lines, and technical indicators such as Fibonacci retracements, Bollinger Bands and Ichimoku Clouds.
