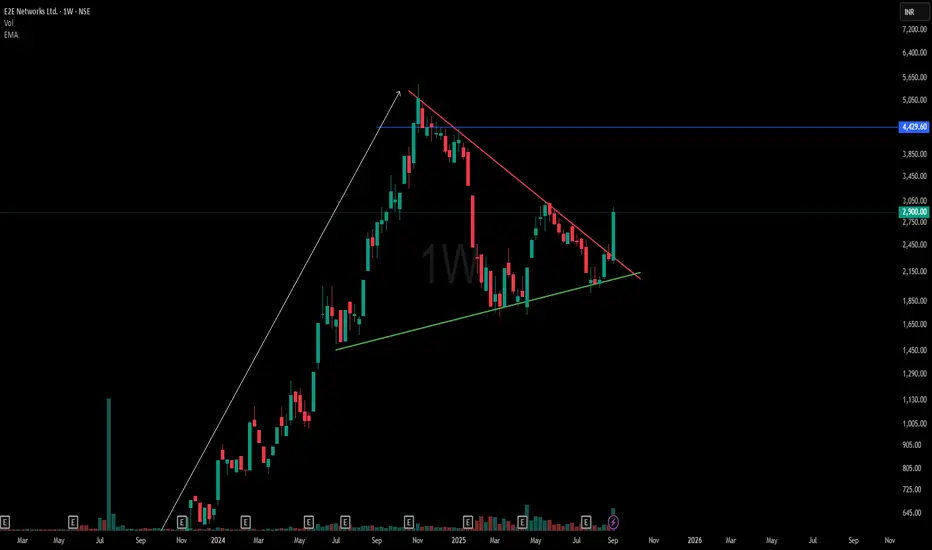
Part 2 Support and Resistance Why Traders Use Options
Options are versatile instruments. Traders use them for:
Speculation – Betting on price movement to earn profits.
Hedging – Protecting existing investments from adverse price moves.
Income Generation – Selling options (writing) to earn the premium.
For example:
A trader may buy a call option expecting prices to rise.
A portfolio manager may buy put options to protect their stocks from falling prices.
An experienced investor may sell covered calls to earn regular income.
Support

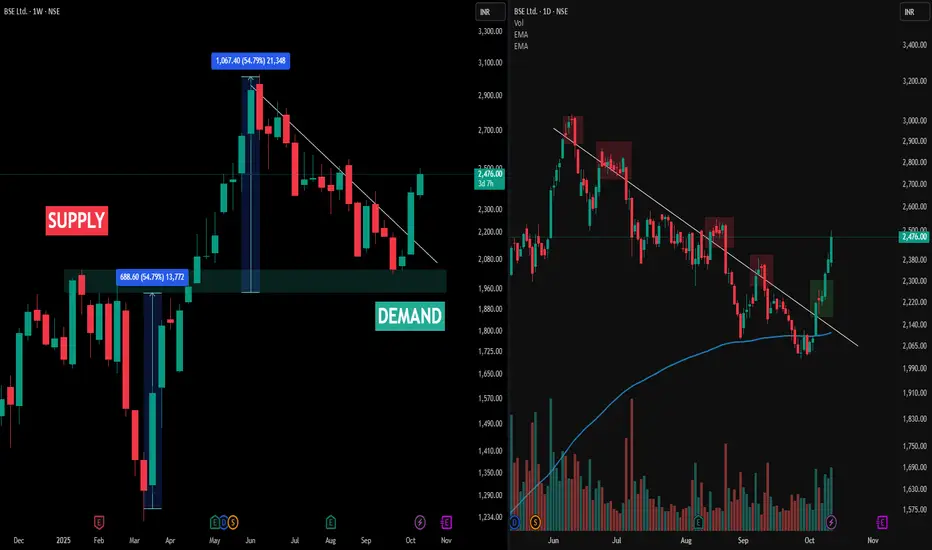
Multi-Timeframe Observation: BSE Ltd• The image above presents a multi-timeframe view of BSE Ltd (NSE), with the left side displaying the Weekly Timeframe (WTF) chart and the right side showing the Daily Timeframe (DTF) chart. The weekly chart highlights the main demand and supply zones, with large upward moves originating from demand and visible percentage swings marked for clarity.
• A key observation is the Change of Trend (CT) line. On the weekly chart (left), price action repeatedly challenged but never closed above the CT, indicating resistance at this structural level. This is confirmed on the daily chart (right), where each significant upward move into the CT region is marked by red boxes—showing failed attempts to sustain above the CT and repeated rejections.
• The green box on the daily chart points to a recent bounce from demand, but the price still faces resistance at the CT as per the weekly structure. Consistent volume activity and price response across both timeframes offer a crystal clear illustration of trend dynamics and supply-demand interplay. The post is strictly an analytical observation of price structure, not a prediction or recommendation.
Disclaimer
This post is intended for observational and educational purposes only. It does not constitute financial advice or recommend any trading action. Please consult a certified financial advisor and conduct your own research before making investment decisions.
BUY TODAY SELL TOMORROW for 5%DON’T HAVE TIME TO MANAGE YOUR TRADES?
- Take BTST trades at 3:25 pm every day
- Try to exit by taking 4-7% profit of each trade
- SL can also be maintained as closing below the low of the breakout candle
Now, why do I prefer BTST over swing trades? The primary reason is that I have observed that 90% of the stocks give most of the movement in just 1-2 days and the rest of the time they either consolidate or fall
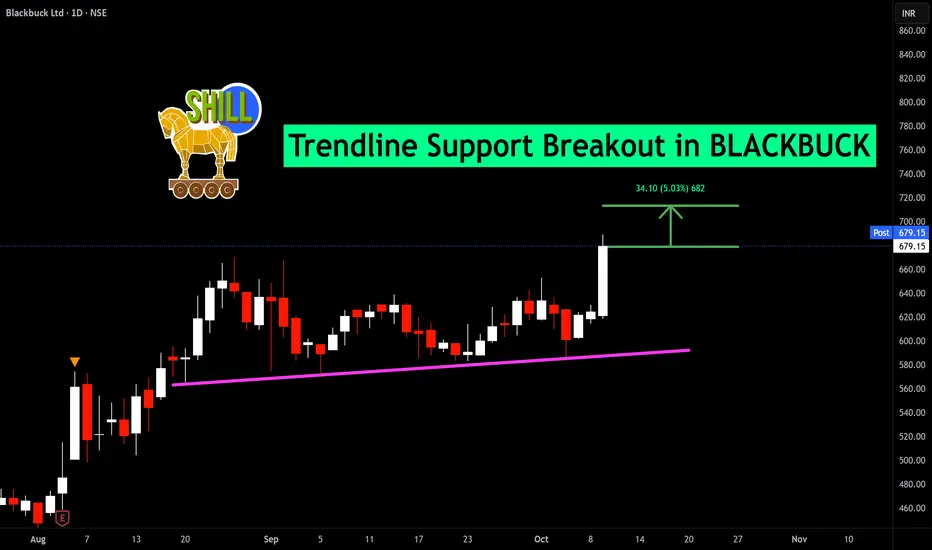
Trendline Support Breakout in BLACKBUCK
BUY TODAY SELL TOMORROW for 5%
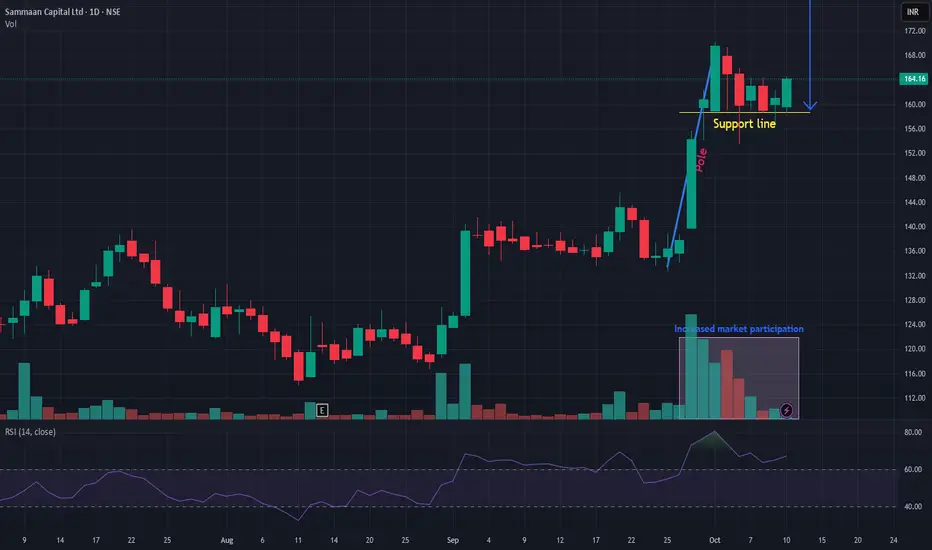
SAMMAANCAP SAMMAANCAP is showing very good strength and currently available at low risk. Forming VCP pattern. Seems like currently facing from sideways and may come out of the range and will take a new ride above resistance line. Risk-reward quite in favor. Keep it in a watchlist.
LINKUSD – Waiting for Pullback to Support Before Long EntryLINK was recently rejected at resistance, and we’re now watching for a pullback to confirm support before entering a long spot trade.
🔸 Trade Setup
We are targeting a long spot entry around $21.00 – $21.50, which aligns with prior structure and potential buyer interest. This zone could provide a strong foundation for a rebound if confirmed with price action or volume.
🔸 Targets & Risk Management
Take Profit 1: $27.00 – $31.00
Take Profit 2: $38.00 – $43.00
Stop Loss: Below $19.50
A clean bounce off support with a bullish structure would trigger the setup. Waiting for confirmation is key. As always, manage risk carefully.

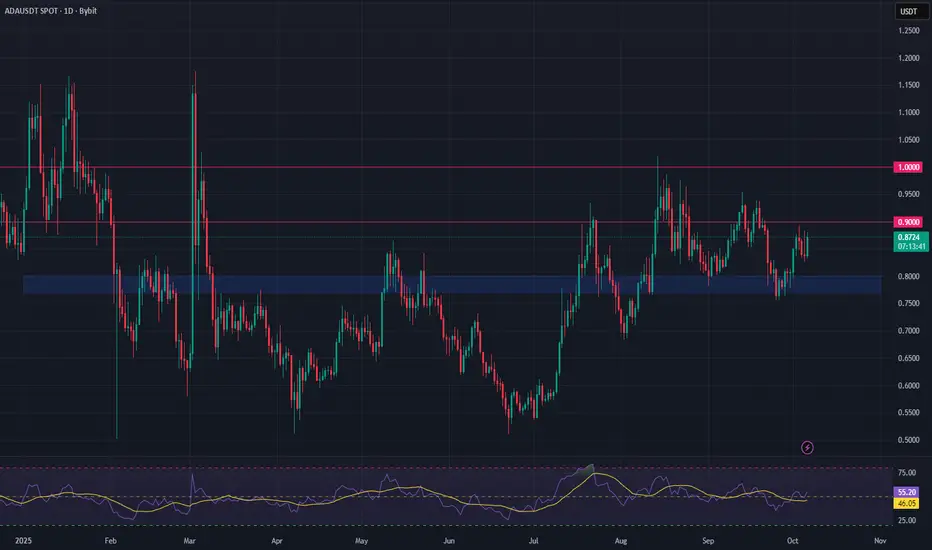
Cardano (ADA) – Bulls Regain Control, Eyes on $0.90 BreakoutCardano had a strong week, managing to hold above key support at $0.77 and closing with a bullish weekly candle. This price action signals a shift in momentum, with buyers back in control.
However, ADA now faces a critical test: the $0.90 resistance level. So far, bullish momentum hasn't been strong enough to force a breakout, but with the broader market showing strength, this level may not hold for long.
A confirmed breakout above $0.90 would be significant, opening the path for a potential move above $1 — a level not seen since mid-2022.
Looking forward, October has started with a strong bullish tone across the crypto market. If this continues, Cardano could be positioned for a fresh rally, provided bulls can take out the $0.90 resistance.
📌 Key Levels to Watch:
Support: $0.77
Resistance: $0.90
Target if breakout confirms: $1+
🟢 Bias: Bullish above $0.77
🔴 Risk: Failure at $0.90 could lead to a retest of support
XRP Breaks Above $3 – Bullish Momentum BuildsOverview:
XRP has officially closed the week above the $3 mark, a psychological resistance now turning into support. This is a major technical shift suggesting renewed bullish control.
🔑 Key Levels to Watch:
Support: $3.00
Short-Term Target: $3.20
Major Resistance / Magnet: $3.60 (All-Time High)
📊 Market Structure:
XRP appears to be breaking out of a consolidation zone between $2.70 and $3.00. This range held for several weeks, and a clean breakout could fuel a strong continuation toward previous highs.
🐂 Bullish Scenario:
Continued higher highs with volume could open the path to $3.20 and eventually $3.60.
A successful retest of the $3 level as support would further validate the breakout.
⚠️ Risk Note:
Watch for any fakeouts or low-volume rallies. A drop below $3 would negate the breakout and put the $2.70 support back in play.
📅 Outlook:
With Q4 2025 underway, a rally toward the ATH at $3.60 could be driven by both technical momentum and market sentiment.
💬 What’s your take? Are we heading for a new ATH this quarter?
📌 #XRP #Crypto #Altcoins #Breakout #TechnicalAnalysis #Q4Outlook

How to Backtest, Create a Strategy and Execute a Trade In this video I have showed a good trade is executed with proper planning and mindset .
Charts Used in this video are older than 3 months . Only for educational content .

BUY TODAY SELL TOMORROW for 5%DON’T HAVE TIME TO MANAGE YOUR TRADES?
- Take BTST trades at 3:25 pm every day
- Try to exit by taking 4-7% profit of each trade
- SL can also be maintained as closing below the low of the breakout candle
Now, why do I prefer BTST over swing trades? The primary reason is that I have observed that 90% of the stocks give most of the movement in just 1-2 days and the rest of the time they either consolidate or fall
Trendline Support in LUMAXIND
BUY TODAY SELL TOMORROW for 5%

BUY TODAY SELL TOMORROW for 5%DON’T HAVE TIME TO MANAGE YOUR TRADES?
- Take BTST trades at 3:25 pm every day
- Try to exit by taking 4-7% profit of each trade
- SL can also be maintained as closing below the low of the breakout candle
Now, why do I prefer BTST over swing trades? The primary reason is that I have observed that 90% of the stocks give most of the movement in just 1-2 days and the rest of the time they either consolidate or fall
Trendline Support in DENORA
BUY TODAY SELL TOMORROW for 5%

Buy, Sell, or Skip? Multi Timeframe Support ZonesUncover how support levels across multiple timeframes help clarify key buy/sell decisions—purely for technical education.
Chart used is 3 months old for educational purposes only.

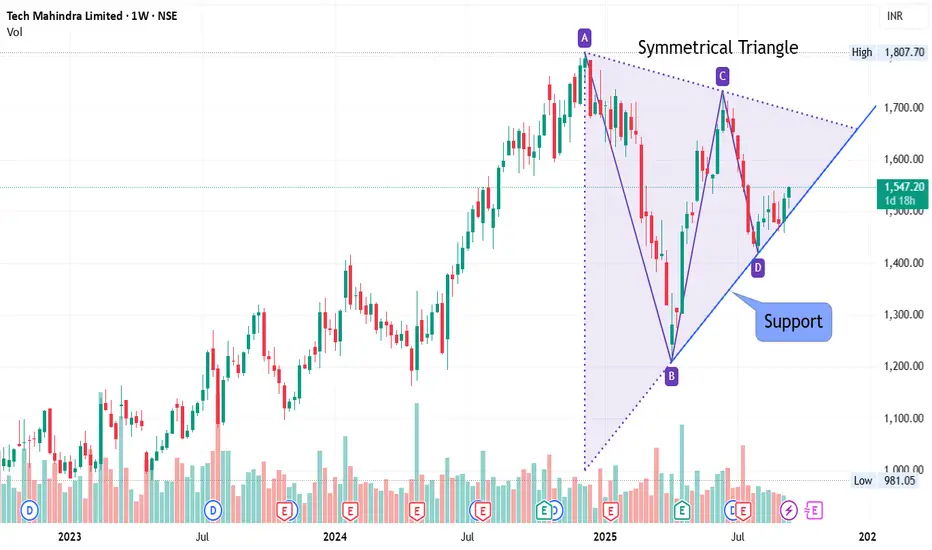
At Support - Weekly Chart - TECHM📊 Script: TECHM
📊 Industry: IT - Software (Computers - Software & Consulting)
Key highlights: 💡⚡
📈On Weekly Chart Script is forming symmetrical triangle and trading near support line.
📈 Script is trading at upper band of BB.
📈 MACD and Double Moving Averages are giving Crossover
📈 Right now RSI is around 58.
📈 One can go for Swing Trade.
⏱️ C.M.P 📑💰- 1547
🟢 Target 🎯🏆 - 1612 / 1655
⚠️ Stoploss ☠️🚫 - 1499
⚠️ Important: Always maintain your Risk & Reward Ratio.
✅Like and follow to never miss a new idea!✅
Disclaimer: I am not SEBI Registered Advisor. My posts are purely for training and educational purposes.
Eat🍜 Sleep😴 TradingView📈 Repeat 🔁
Happy learning with trading. Cheers!🥂
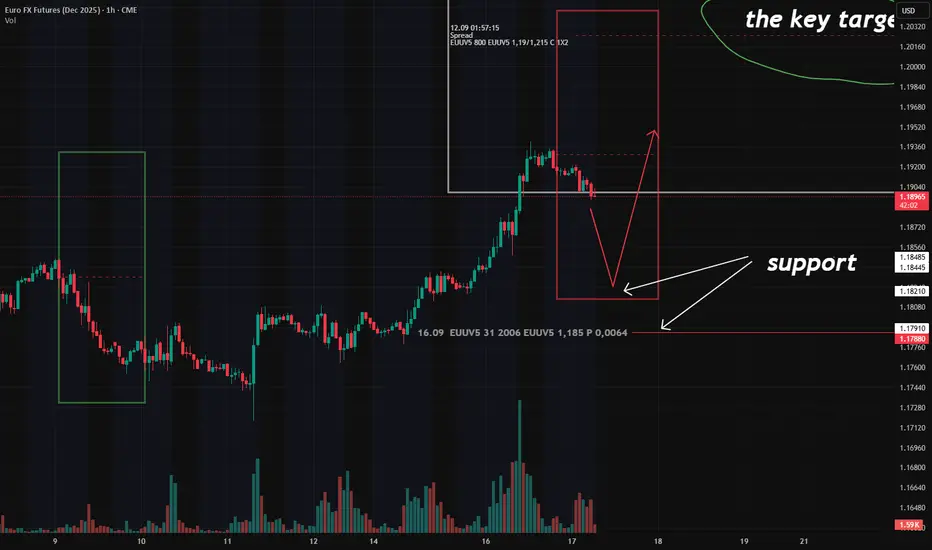
Market Sentiment: Optimism for Euro – But Here’s My Plan According to last CME report, there’s clear bullish sentiment across major currencies trading against the US dollar.
We’re seeing naked calls placed at multiple levels above current prices:
1.38 on GBP
1.295 on CHF
In other words: options traders are pricing in further USD weakness.
This aligns with earlier signals:
1.The JPY 'Butterfly' (still active)
2. The EUR 'Ratio spread' — also still in play
So what’s my move today?
✅ First: I exited all positions this morning.
No overexposure ahead of the Fed decision.
🎯 Now: I’m watching for long entries near the ER zone (see chart).
Notably, just below ER low boundary - put at 1.185 (act as support), which appeared in the report.
The option is worth ~$900K — not huge, but significant enough to catch my eye.
I’ll watch closely — and only enter if price respects it.
Stock-wise Investigation: Breakouts or Support? ( MTF )Using 3-month-old chart data, this video explores how stocks tend to favor breakouts or support zones, with key technical terms to sharpen your pattern recognition skills—purely educational in nature.

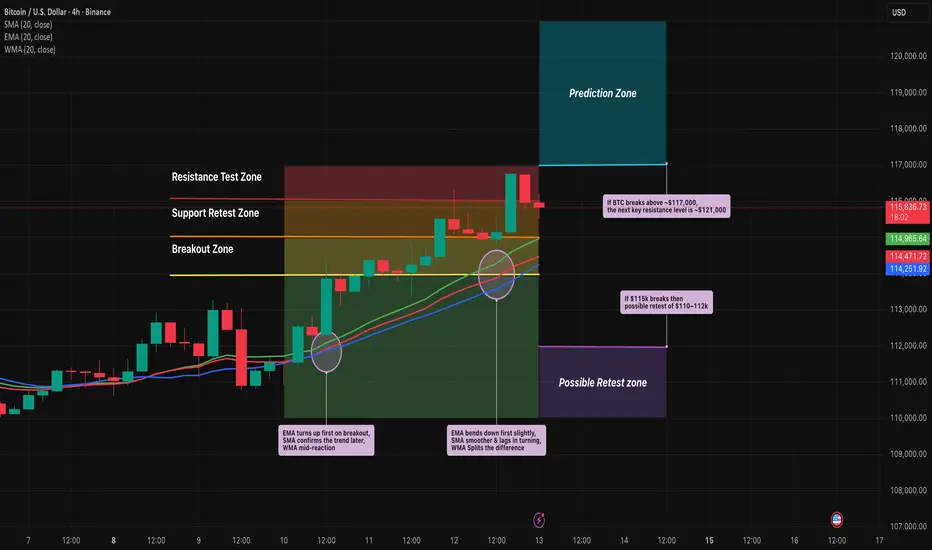
EMA vs SMA vs WMA: Which Moving Average Should You Use?🔎 Intro / Overview
Moving Averages remain one of the most trusted tools in technical analysis. They smooth price action, highlight the trend, and often act as dynamic support or resistance.
In this post, we compare the 20-period SMA, EMA, and WMA on BTCUSD 4H to show how each reacts differently to market moves.
___________________________________________________________
📔 Concept
SMA (Simple Moving Average): Every candle in the lookback is weighted equally → smooth but slower to react.
EMA (Exponential Moving Average): Recent candles carry more weight → reacts faster, hugs price closely.
WMA (Weighted Moving Average): Linear weighting → a balance between SMA’s stability and EMA’s sensitivity.
The difference lies in responsiveness. Faster averages react early but risk false signals, slower averages confirm trends but lag.
___________________________________________________________
📌 How to Use
1️⃣ Plot the 20-period SMA, EMA, and WMA together.
2️⃣ Watch how each responds during pullbacks, rallies, and consolidations.
3️⃣ Use EMA for quicker signals, SMA for smoother long-term view, and WMA if you prefer a middle ground.
4️⃣ Combine with price action or RSI to avoid relying on moving averages alone.
___________________________________________________________
🎯 Trading Plan
Intraday traders: EMA crossovers (e.g., 9 vs 21 EMA) for faster entries and exits.
Swing traders: SMA for identifying trend direction and major support/resistance.
Balanced traders: WMA for medium-term setups where stability and responsiveness matter equally.
Always align the moving average with your trading style and risk appetite.
___________________________________________________________
📊 Chart Explanation
On BTCUSD 4H:
EMA (red) bent upward first during the $114k breakout, SMA (blue) confirmed later, and WMA (green) sat between them.
At the $115k retest, EMA dipped first, while SMA lagged.
At $116.5–117k resistance, EMA whipsawed but SMA stayed smoother.
Notice how these differences become clear during sharp pullbacks, quick rallies, and sideways ranges.
___________________________________________________________
👀 Observation
EMA is quick but noisy ⚡, SMA is calm but late 🕰️, WMA strikes a middle ground ⚖️.
___________________________________________________________
❗ Why It Matters?
Choosing the right moving average impacts how quickly you spot entries, confirm trends, and manage stop-losses. Understanding the differences helps traders adapt strategies to both trending and sideways markets.
___________________________________________________________
🎯 Conclusion
No single moving average is “best.” Each serves a purpose depending on the timeframe and style of trading. The key is consistency — choose one that aligns with your plan, test it, and apply it with discipline.
👉 Which one do you prefer in your trading — EMA, SMA, or WMA?
___________________________________________________________
⚠️ Disclaimer
📘 For educational purposes only ·
🙅 Not SEBI registered ·
❌ Not a buy/sell recommendation ·
🧠 Purely a learning resource ·
📊 Not Financial Advice
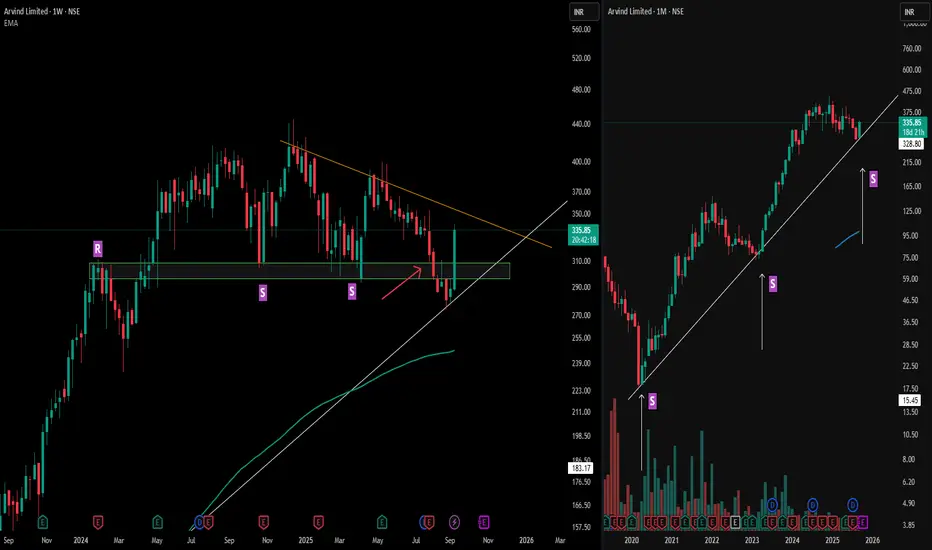
Arvind : Spotting Fake Breakdowns with Multi-Timeframe SupportArvind Limited highlights how a broader perspective can clarify deceptive price moves.
On the left (weekly), resistance ("R") flipped into support ("S") multiple times, with the orange counter trendline framing the recent structure. The red arrow marks a moment when weekly support appeared broken—a classic fake breakdown as price quickly reclaimed the zone with decisive strength.
Looking right (monthly), the MTFA view explains the recovery: a long-standing trendline support anchors the zone, helping absorb downside attempts and fueling the swift reversal. This alignment across timeframes illustrates how long-term technical structures often override short-term volatility, and why reviewing bigger picture charts is essential for pattern validation—not for prediction.
Disclaimer: This analysis is for educational purposes only and does not constitute investment advice. Always do your own research before making financial decisions.
BUY TODAY SELL TOMORROW for 5%DON’T HAVE TIME TO MANAGE YOUR TRADES?
- Take BTST trades at 3:25 pm every day
- Try to exit by taking 4-7% profit of each trade
- SL can also be maintained as closing below the low of the breakout candle
Now, why do I prefer BTST over swing trades? The primary reason is that I have observed that 90% of the stocks give most of the movement in just 1-2 days and the rest of the time they either consolidate or fall
Trendline support in APOLLO
BUY TODAY SELL TOMORROW for 5%

Perfect Symmetrical Triangle Chart Pattern💡 Chart Pattern Education
Symmetrical triangles are powerful continuation patterns that form when buyers and sellers reach equilibrium. The converging trendlines create a coiling effect, building pressure for the next major directional move. Studies show 68-75% success rate when traded with proper volume confirmation.
⚡ Matching the Chart shown and the above definition
✅ Higher lows trend intact on support trendline
✅ Lower highs forming clean resistance line
✅ Consolidation phase showing market indecision
✅ Volume declining as expected in triangle patterns
✅ Multiple timeframe confirmation visible
Disclaimer:
This analysis is for educational and informational purposes only and does not constitute financial advice or a recommendation to buy or sell any security. Trading involves risk, and past performance is not indicative of future results. Traders should conduct their own due diligence and consider their risk tolerance before making any trading decisions
ICICI Bank at a Crucial Support Zone: Can Bulls Take Charge?ICICI Bank (₹1,402) is holding firm above the ₹1,380–1,400 support zone, a level that has sparked rebounds multiple times in the past.
✅ RSI back at 51 → momentum improving
✅ MACD showing bullish divergence → early reversal signal
⚡ Key hurdle: falling trendline resistance at ₹1,416
📈 Bullish setup: Sustaining above ₹1,400 and breaking ₹1,416 could fuel a rally toward ₹1,439–1,452.
Disclaimer: The information provided in this analysis is for educational and informational purposes only and should not be considered as financial or investment advice.

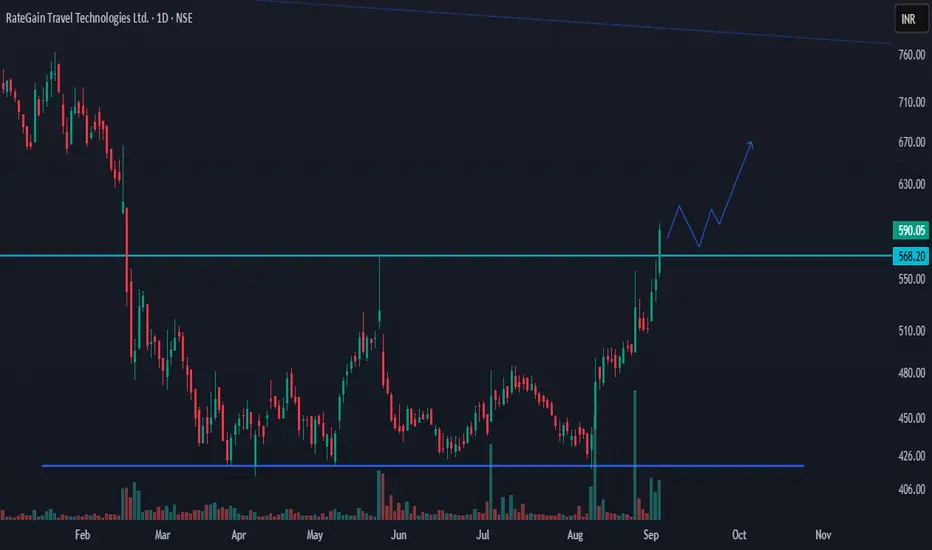
Breakout on daily chart - Holding TradeRATEGAIN is shaping up so nicely.
The stock built a base around 430–445 and has now moved back above the 568–570 zone, which turns into support if daily closes keep holding.
As long as price stays above 570, the next areas to watch are 645–660 and then 700-720, with a bigger hurdle near 800–810 from the old down‑trend line.
A healthy setup would be a dip toward 572–585 that shows buying strength; that gives a cleaner entry. Manage risk below 548 for a tight stop, or below 530 for a wider swing stop.
If the stock closes back under 570 and doesn’t quickly recover, treat it as a failed reclaim and wait. On the business side, the company has been posting double‑digit growth with improving margins from its AI‑driven travel‑tech products—so buying dips while 570 holds and higher lows keep forming makes sense.
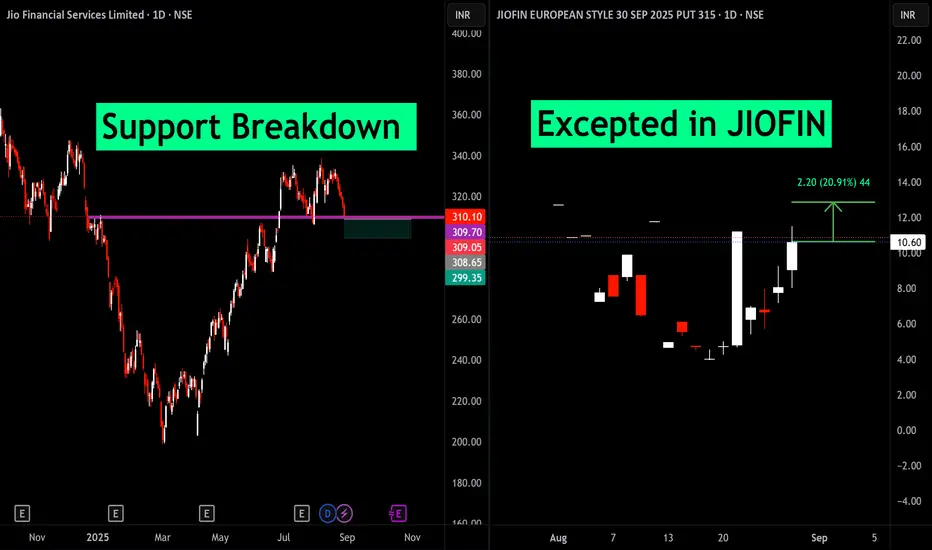
Support Breakdown Excepted in JIOFINThe idea shown in this TradingView chart is a strategy based on a support breakdown in Jio Financial Services Limited (JIOFIN), coupled with a position in its associated put option for further downside protection and potential profit.
Support Breakdown Concept
The left side of the chart highlights a horizontal support level that has been tested multiple times and subsequently broken by the recent price action.
A support breakdown typically signals bearish sentiment; traders expect further decline after such a technical event.
This setup is classified as a short or sell signal for JIOFIN shares as long as price remains below the broken support.
Put Option Reaction
On the right, the chart shows JIOFIN’s 315 European Style Put Option expiring in September 2025.
The put option price has surged (up 31.68%) in response to the underlying stock’s breakdown, reflecting increased demand for downside protection and speculative profit.
Options traders might buy puts to profit from further decline or hedge against losses in the underlying stock.
Trading View Idea Summary
JIOFIN’s support breakdown signals potential further downside in the stock.
The associated put option sees buying interest, aligning with bearish expectations.
This is a classic technical-plus-derivatives strategy often used in active trading: combine chart-based signals with options to amplify or hedge results.
ETH Buy at perfect zone.ETH Buy scenario at perfect zone. ETH is creating a perfect scenario for buy on 4H TF.
1. Price is at support, FVG and OB confluence in premium zone at OTE.
2. Also showing rejection in price action.
3. Trend line is faked out.
P.S. - it is just analysis not any trade recommendation.

Gold Faces Resistance, Buyers Should Stay Alert near Key SupportGold Futures (MCX) Analysis: Key Points to Watch
Current Price Range: Gold Futures are trading around ₹98,700 to ₹98,750.
Resistance Zone: Gold has been repeatedly rejected near its high around ₹101,500, showing strong selling pressure at this level.
Trendline Broken: Recently, gold broke an important upward trendline that had acted as a reliable bounce-back support.
Key Support Emerging: After this break, a key support level has appeared around ₹97,700 to ₹97,750. This zone will be important to watch for potential price stabilization.
Additional Support Levels: The chart also highlights other support zones that could provide buying interest if prices decline further.
Trader Outlook: Buyers need to remain cautious and vigilant at these levels. The market shows signs of short-term weakness, and how gold behaves around these supports will be crucial for the next move.
Gold is at a critical juncture where it faces both selling pressure and key supports. Watching the reaction around ₹97,700-₹97,750 will help gauge whether bulls regain control or further correction unfolds. Stay alert and manage risk carefully.
