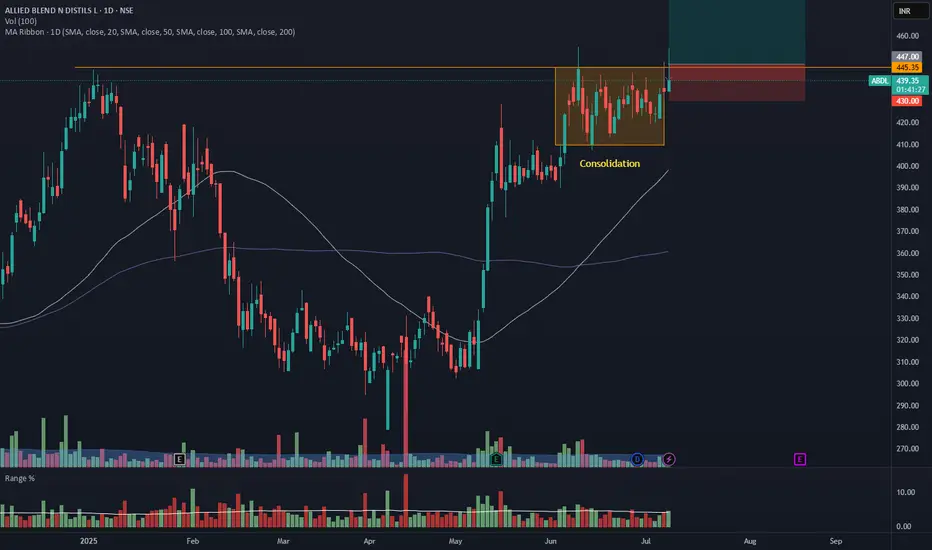
ABDL - Daily Timeframe Breakout Idea (Resistance Zone Break)Allied Blenders and Distillers Ltd. has shown a breakout above a key horizontal resistance level on the daily chart, accompanied by a nearly 2 times volume surge near the breakout zone, as seen earlier, supported by strong momentum.
🔍 Breakout Context:
- Price might break above the ~₹446 horizontal resistance, which had held for over 6 months.
The breakout zone has been supported by 2X volume and a range 1.5X of average near the resistance zone.
- The price is also trading above both the 50- and 100-day SMAs, indicating strong trend continuation.
- This aligns with a bullish continuation setup.
📉 Trade Plan:
- CMP: ₹439.15
- Entry: Near ₹446
- Target: ₹481 (~7.5% upside from CMP)
- Stop-Loss: ₹430
- Risk-Reward Ratio: ~ 1 : 2
📌 Note:
- Look for a confirmation candle to enter the trade.
- Avoid chasing the extended move unless confident in intraday momentum.
⚠️ Disclaimer: This post is for educational purposes only and not financial advice. Always do your research or consult a financial advisor before trading.
Support
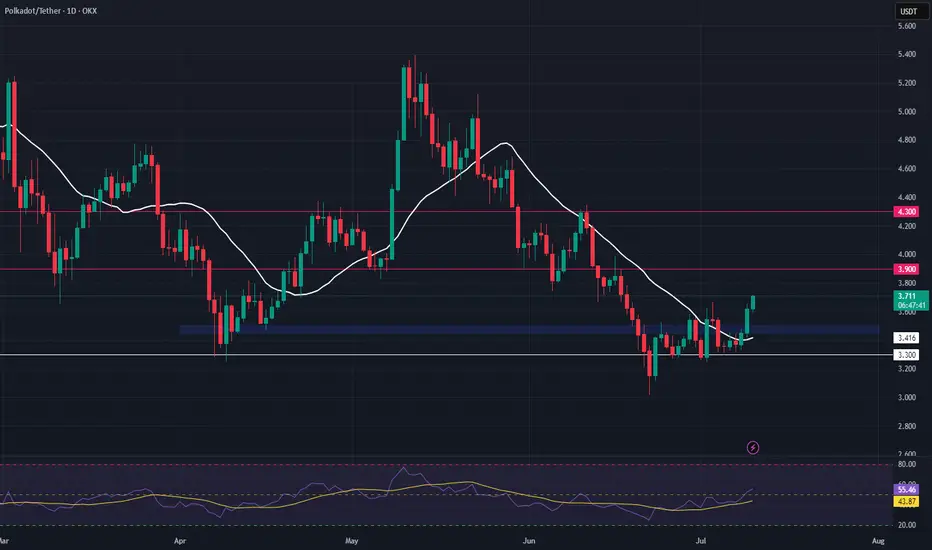
DOT Long Swing Setup – Structural Recovery with Support RetestDOT is showing early signs of recovery, reclaiming its 20-day SMA and flipping key horizontal resistance into support. We’re now watching for a retest of the $3.45–$3.50 zone to confirm the level and trigger a long entry.
📌 Trade Setup:
• Entry Zone: $3.45 – $3.50
• Take Profit Targets:
o 🥇 $3.90
o 🥈 $4.30
• Stop Loss: Daily candle close below $3.33
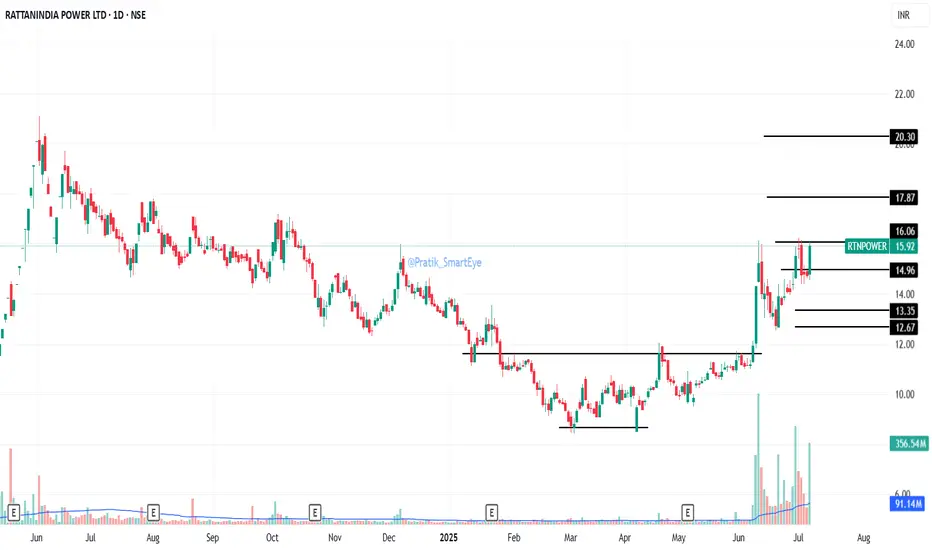
Rattan Power: Bounce From Support zoneRattan Power: Bounce From Support zone 14.95; CMP 15.55
Resistance at 16.06/17.87/20.30
Support 14.95/13.35
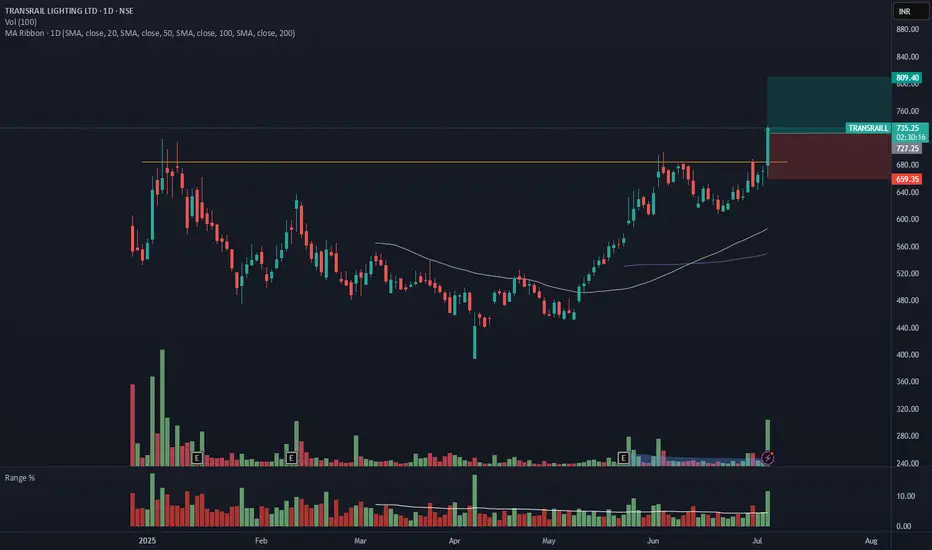
TRANSRAILL - Breakout from Daily TFTRANSRAILL has resistance weakening on the Daily charts and has given a breakout with good volume.
The target of this pattern signals an upside potential of ~10% from the current price level in the medium term.
The stock is trading above its 50- and 100-day simple moving averages (SMAs). The range is more than >2X, and the Volume is also >6X the average.
CMP- Rs. 727
Target Price- Rs.805( ~10% upside)
SL -859
Note- The breakout candle has gone up, extended, so be mindful of your position.
Disclaimer: This is not a buy/sell recommendation. For educational purpose only. Kindly consult your financial advisor before entering a trade.
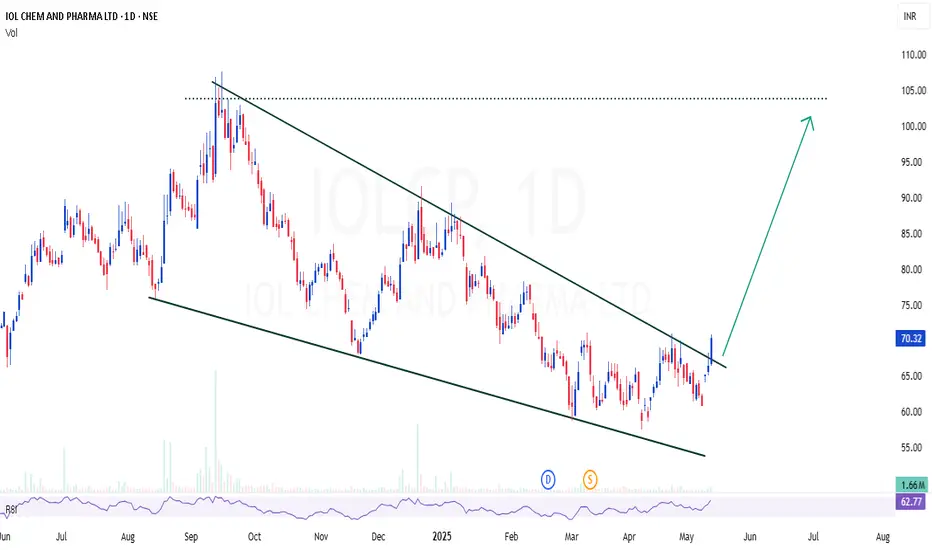
IOLCP | Perfect channel / wedge breakout - Looks good for 50%IOLCP | Perfect channel / wedge breakout - Looks good for 50%
CMP : 70
SL : 60
Target : 100
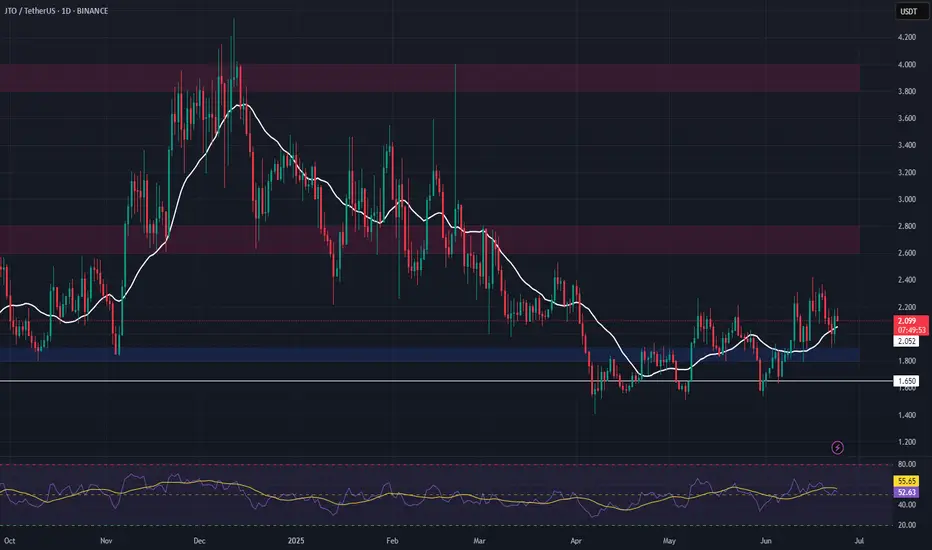
JTO Long Setup – Range Low Accumulation with Bottom PotentialJTO remains range-bound and is showing signs of a potential bottom, with downside liquidity largely cleared. We’re watching the $1.80–$1.90 zone for a long entry, as long as price holds above the key $1.65 invalidation level.
📌 Trade Setup:
• Entry Zone: $1.80 – $1.90
• Take Profit Targets:
o 🥇 $2.60 – $2.80
o 🥈 $3.80 – $4.00
• Stop Loss: Daily close below $1.65
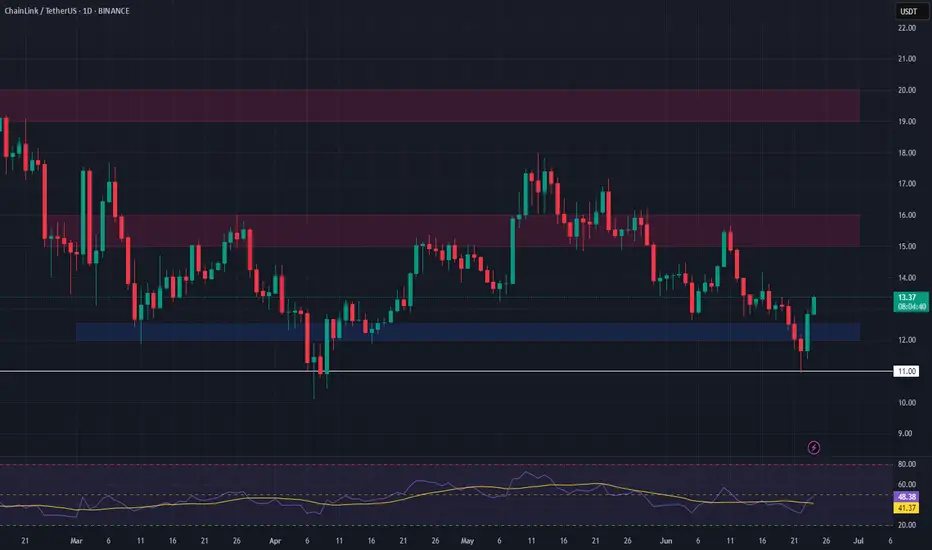
LINK Long Swing Setup – Higher Low Retest at Key SupportLINK has shown strong relative strength in recent weeks and is now retesting the $12 support zone. With broader markets stabilizing, this level could confirm a higher low and set the stage for continued upside.
📌 Trade Setup:
• Entry Zone: Around $12.00
• Take Profit Targets:
o 🥇 $15.00 – $16.00
o 🥈 $19.00 – $20.00
• Stop Loss: Daily close below $11.00
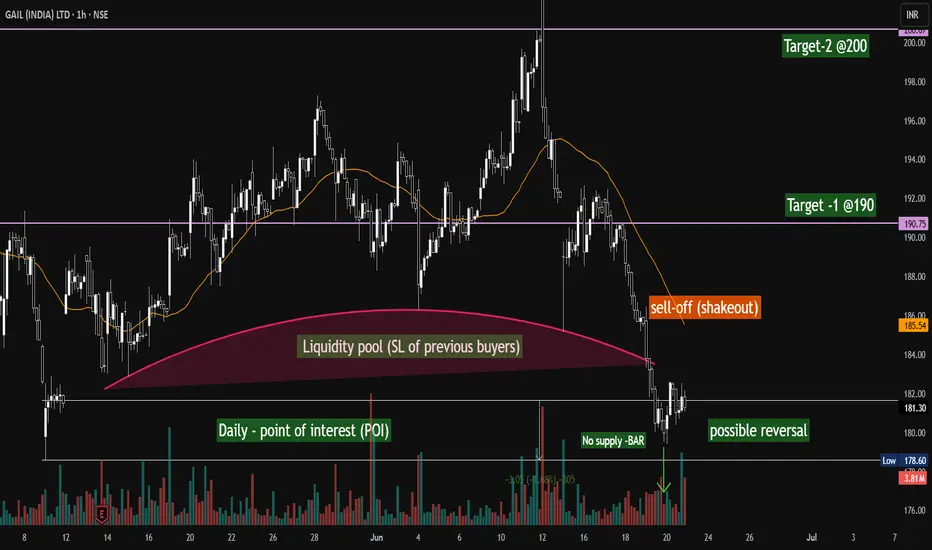
GAIL (INDIA) - Possible Reversal on the corner...GAIL (India) Ltd – 1H Chart Analysis (NSE) | June 21, 2025
Spotted a potential setup with key institutional footprints on the 1H chart:
🟥 Liquidity Pool Grab: Price dipped into the liquidity zone (SL sweep of previous buyers), potentially clearing weak hands.
📉 Shakeout Sell-Off: A sharp decline hints at a textbook shakeout—classic Wyckoff-style distribution at work.
✅ Daily POI + No Supply Bar: Price tapped into a higher timeframe (Daily) Point of Interest, accompanied by a low-volume no-supply bar—suggesting buyer strength.
🔁 Possible Reversal Brewing: Early signs of bullish intent emerging. Watching this zone for confirmation.
🎯 Targets in Sight:
Target 1: ₹190
Target 2: ₹200
Patience pays !!! —waiting for a break of structure and strength to follow through.
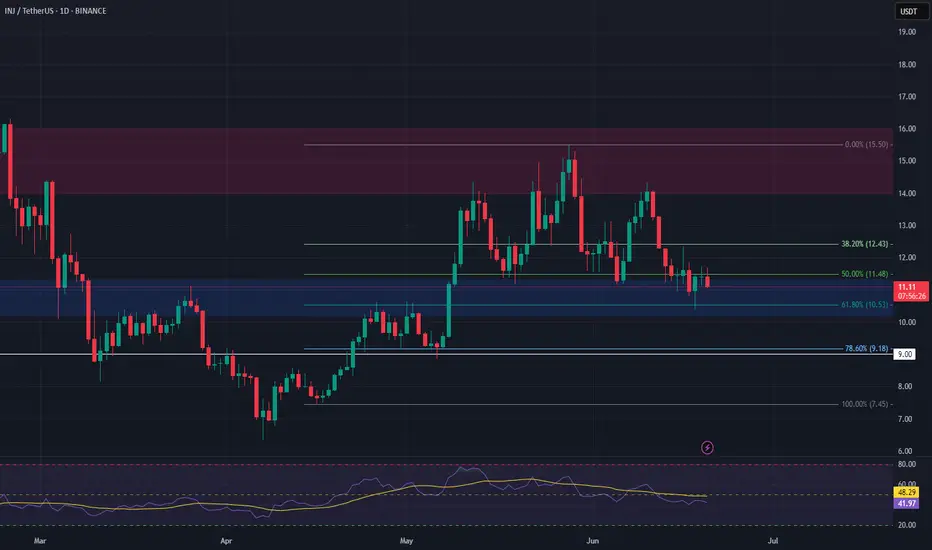
INJ Long Swing Setup – Approaching Fibonacci & Major SupportInjective (INJ) is nearing a key support zone that aligns with the 61.8% Fibonacci retracement level. This confluence area around $10.20–$11.30 offers a strong setup for a potential long swing trade.
📌 Trade Setup:
• Entry Zone: $10.20 – $11.30
• Take Profit Targets:
o 🥇 $14.00 – $16.00
o 🥈 $20.00 – $23.00
• Stop Loss: Daily close below $9.00
TRX Long Swing Setup – Waiting for Pullback After Bullish RallyTRX has seen a strong rally over the past few days, and we’re now watching for a retracement into support. The $0.260–$0.262 zone offers a potential long spot entry as price cools off.
📌 Trade Setup:
• Entry Zone: $0.260 – $0.262
• Take Profit Targets:
o 🥇 $0.278
o 🥈 $0.292
• Stop Loss: Daily close below $0.249

HYPE Long Swing Setup – Approaching Key Support ZoneHYPE is under pressure but now nearing a major support level, presenting a potential opportunity for a bounce. We’re eyeing the $39.00–$40.00 zone for a long entry as buyers may step in at this key area.
📌 Trade Setup:
• Entry Zone: $39.00 – $40.00
• Take Profit Targets:
o 🥇 $42.18
o 🥈 $43.90
• Stop Loss: Daily close below $38.31

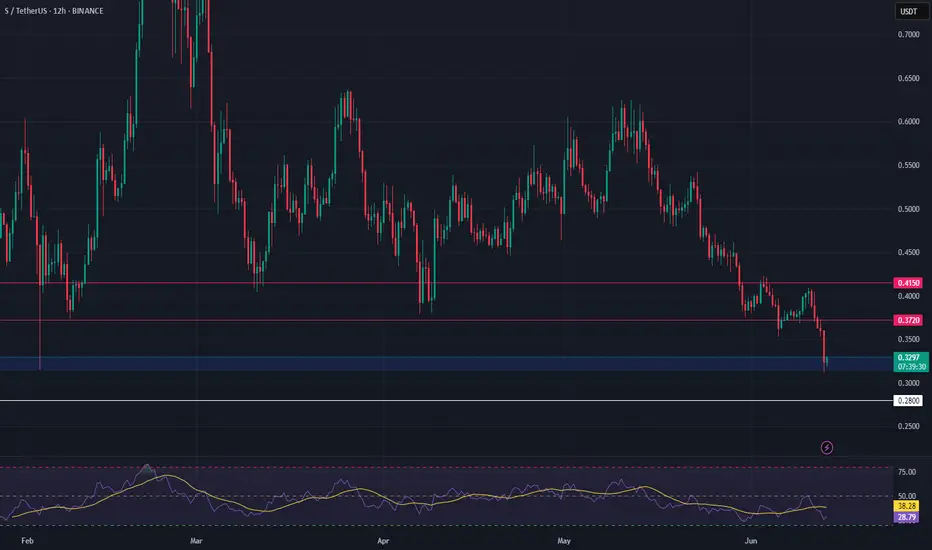
S Long Swing Setup – Retest of February Lows at Key SupportS is pulling back and now approaching a critical support zone, testing the February 2025 lows near $0.31. This area marks a key level for potential accumulation, offering a favorable long setup.
📌 Trade Setup:
• Entry Zone: $0.315 – $0.330
• Take Profit Targets:
o 🥇 $0.372
o 🥈 $0.415
• Stop Loss: Daily close below $0.280
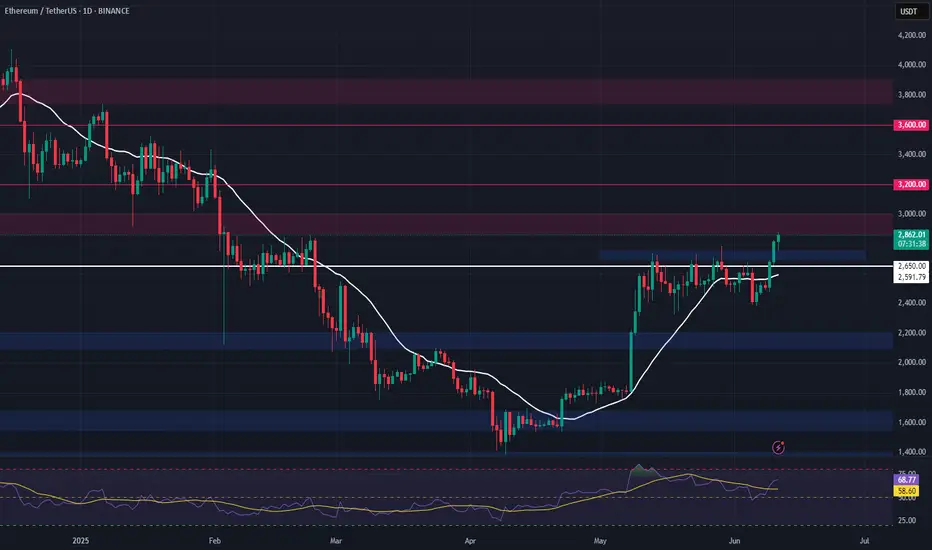
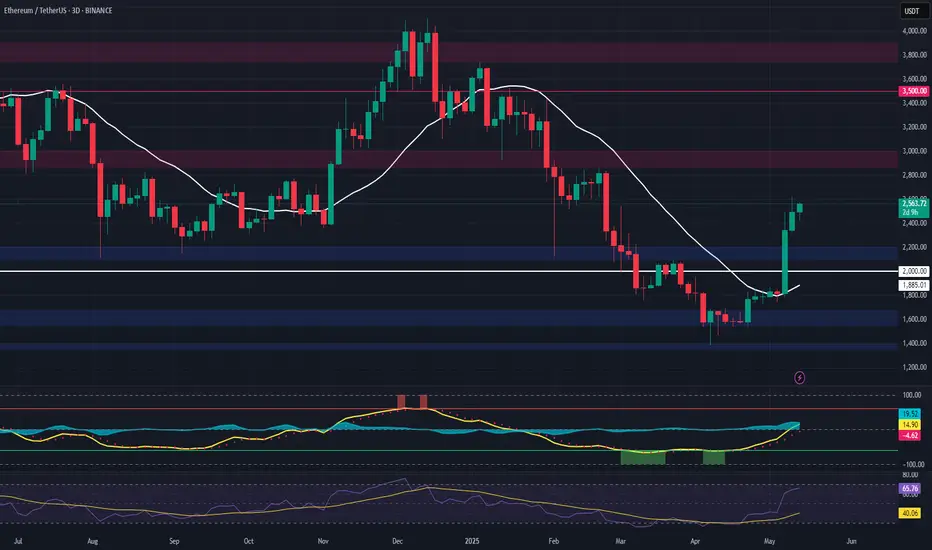
ETH Long Swing Setup – Breakout Retest of Key ResistanceETH has broken above the critical $2,750 resistance, signaling bullish momentum. We’re now watching for a retrace into the $2,700–$2,750 zone, which is expected to act as support for a continuation higher.
📌 Trade Setup:
• Entry Zone: $2,700 – $2,750
• Take Profit Targets:
o 🥇 $3,000
o 🥈 $3,200
o 🥉 $3,700
• Stop Loss: Daily close below $2,650
GRASS–Long Swing Trade Setup After 80% Rally GRASS has seen a strong +80% move recently, and is now pulling back into a key support zone. This type of price action—post-rally consolidation at support—often precedes another leg higher, particularly if structure holds and momentum resumes.
🔹 Entry Zone:
$2.16 – $2.77 (support area & previous breakout zone)
🎯 Take Profit Targets:
🥇 $2.80 (recent high / range reclaim)
🥈 $3.50 (next major resistance zone)
🛑 Stop Loss:
$2.00 (just below structural invalidation level)
📌 Strategy Notes:
Volume surge confirms strong interest; this pullback could be accumulation.
Monitor for bullish engulfing or higher low confirmation on lower timeframes.
Maintain discipline with tight invalidation under $2.00.
If support holds and a reversal candlestick confirms, this could be a high-probability continuation setup. Let me know if you'd like a risk-reward breakdown or chart overlay!

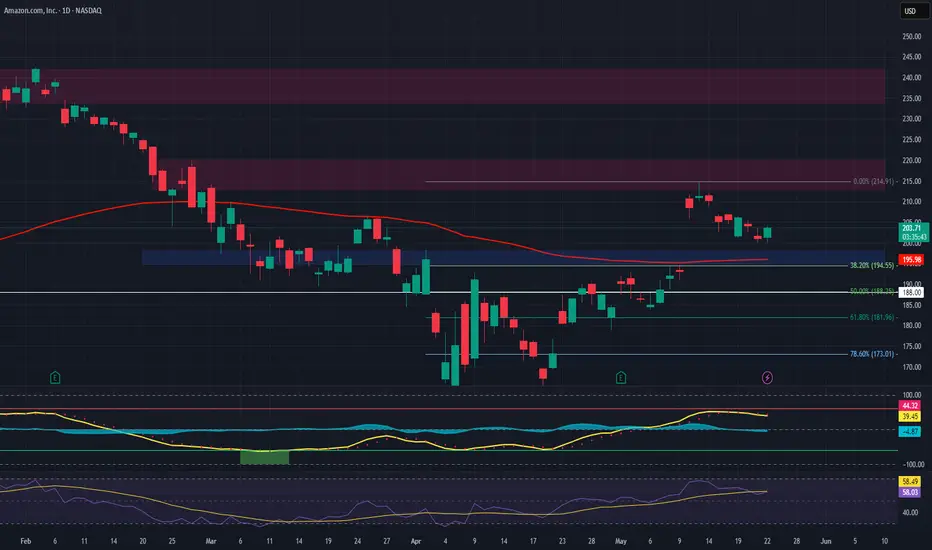
AMZN – Long Spot Trade Setup at Key SupportAmazon NASDAQ:AMZN is currently retracing into a major support level near $195, offering a solid long opportunity as broader market momentum holds up. This level has previously acted as a strong base, and price could now be positioning for a bullish continuation.
🔹 Entry Zone:
Around $195 (major support area)
🎯 Take Profit Targets:
🥇 $213 – $220 (previous resistance, aligns with local Fibonacci extension levels)
🥈 $234 – $242 (macro target zone if the broader market continues to rally)
🛑 Stop Loss:
Just below $188 (clear invalidation if key support breaks)
New opportunity; Nupur Recyclers ltd: 70% Roi ; SwingAdd this to watchlist and wait for entry.👁️🗨️
For short term investment ;
Leave a " Like If you agree ".👍
.
Wait for small retracement & daily candle to close above - "66".
Trade carefully untill ENTRY level.
.
Entry: 66
target:75-90-100-110-121
sl:57
major stoploss/ support: 50
.
.
Enter only if market Sustains above
"Yellow box" mentioned.
.
.
Don't make complicated trade set-up.📈📉
Keep it " simple, focus on consistency "💹
Refer our old ideas for accuracy rate🧑💻
Follow for daily updates👍
.
Refer old posted idea attached below.

Chainlink (LINK) – Momentum Shift with Strong EMA ReclaimLINK is showing a clear structural shift, having reclaimed both the 20-week and 200-week EMAs, signaling a potential transition from accumulation to expansion. The recent sweep of liquidity near $14 further strengthens the bullish case.
This setup provides a clean opportunity to enter on retracement to support, with solid upside if the momentum holds.
🔹 Entry Zone:
$13.00 – $13.50 (support + previous liquidity sweep zone)
🎯 Take Profit Targets:
🥇 $20 (HTF resistance)
🥈 $25 (macro range mid/high)
🥉 $30 (prior major resistance)
🛑 Stop Loss:
Daily close below $12.00 (structure invalidation)

Ethereum (ETH) – Early Recovery Setup After Liquidity SweepEthereum has printed a bullish deviation below key liquidity ($1,500) and reclaimed the 20-day EMA, flipping prior resistance into support — a classic signal of early reversal momentum.
We're now watching for a pullback into the $2,100–$2,200 demand zone to offer an optimal spot entry before a potential move into higher timeframe targets.
🔹 Entry Zone:
$2,100 – $2,200 (pullback into reclaimed support/demand)
🎯 Take Profit Targets:
🥇 $3,000
🥈 $3,500
🥉 $3,900
🛑 Stop Loss:
Close below $2,000 (to invalidate reclaim of structure)
#nifty50 ANALYSIS FOR TOMORROWNSE:NIFTY
#nifty50 ANALYSIS FOR TOMORROW 🔺
❇️ IMPORTANT LEVELS 🚀
❇️ Support: 24268-24196-24101
❇️ Resistance: 24432-24528-24601-24675
👉🏻 PURPLE LINE: 24364-24310 is a key level for selling.
👉🏻 thetradeforecast 🇮🇳

AVAX Trade Setup – Support Zone Long OpportunityAvalanche (AVAX) has pulled back and is now approaching a key support area, offering a high-reward swing setup if bulls defend the level.
🔹 Entry Zone:
$20.00 – $21.00 (Support Zone)
🎯 Take Profit Targets:
🥇 $22.50 – $24.00
🥈 $27.00 – $29.00
🛑 Stop Loss:
Just below $18.50

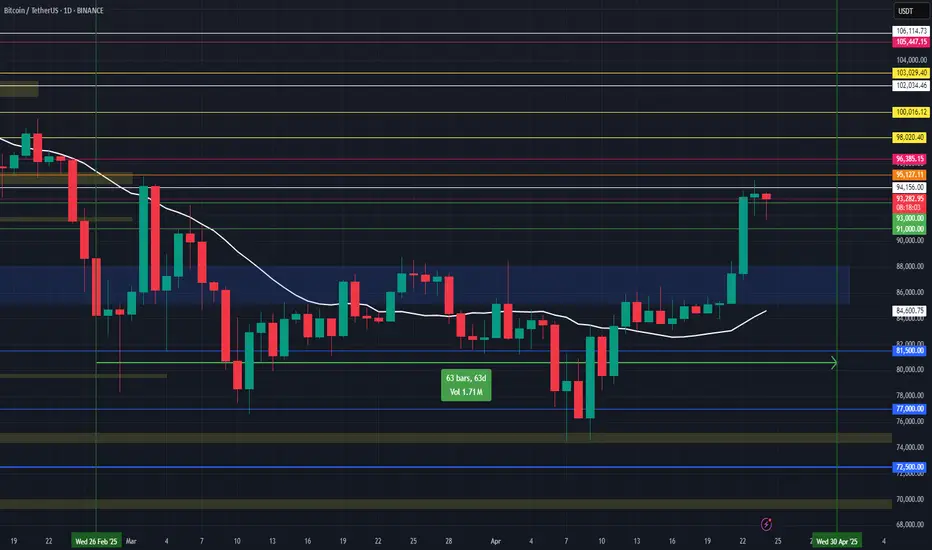
Bitcoin Breaks $88K — Eyes on Key Resistance ZoneSurging Momentum:
In the past few hours, Bitcoin has surged by 10%, breaking through the $88,000 resistance and reaching around $94,000. This marks a powerful continuation of bullish momentum.
Key Resistance Ahead:
The $92,000–$95,500 zone, which acted as strong support between November and February, is now expected to serve as major resistance. A rejection from this range could lead to a short-term retracement.
Retracement Zones:
If Bitcoin fails to break through $95,500:
First support: $91,000
Deeper pullback: $85,000–$87,500
Breakout Scenario:
If Bitcoin decisively breaks and holds above $95,500 on higher timeframes, we could see a continuation toward the next resistance between $102,000 and $108,000.
Conclusion:
Bitcoin is at a key inflection point. Whether it confirms a breakout or sees a short-term correction, this range will be crucial in shaping the next phase of the bull cycle. 📈🔥
#Bitcoin #BTC #Crypto #TechnicalAnalysis #Breakout #Resistance #Support #MarketUpdate #BullRun
Confluence level - Nifty it can act as support or reversal 1. Downward regression channel bottom
2. Ascending Channel Bottom
3. Abc correct pattern 1:1
4. Previous Support level
What is confluence?
It's meeting point or multiple technical parameters coincides, like I mentioned above
What to expect?
1. Reversal if prices goes above 23400
2. If any short comming occurs next level could be 20200

BEML - Confluence of Supports Suggests a Potential Reversal!The weekly chart of BEML indicates a potential reversal as the stock approaches a critical confluence of support levels. After a significant correction from its all-time high, the price is now testing key technical levels that could act as a strong base for a bullish reversal.
Key Observations:
1. 200-Week EMA Support:
- The price is currently hovering near the 200-week EMA, which has historically acted as a strong dynamic support zone in trending markets.
2. Fibonacci Retracement:
- The stock is approaching the 0.618 Fibonacci retracement level, which is widely regarded as a golden ratio for potential reversals during corrections.
3. Potential Bullish Reversal:
- If the stock holds above this critical support zone, it could initiate a reversal toward higher levels.
---
Let me know your thoughts in the comments! #BEML #TechnicalAnalysis #SwingTrading"
---
Disclaimer:
This analysis is for informational and educational purposes only and does not constitute financial advice. Trading involves risk, and past performance is not indicative of future results. Always conduct your own research and consult with a qualified financial advisor before making any investment decisions.
