TITAN - Bullish Reversal & Long-Term Growth StoryTITAN | Bullish Reversal & Long-Term Growth Story
Stock: Titan Company Ltd (NSE: TITAN)
Timeframe: Daily Chart
Pattern: Bullish Reversal from Key Support(Bullish Engulfing)
🏷️ Stock Intro
Titan is India’s leading lifestyle & jewellery retailer with brands like Tanishq, CaratLane and Fastrack. Strong brand equity and robust consumer demand keep Titan a long-term structural growth story.
🔎 Price Action
Current Price: ₹3,401.20
After a sharp fall from the 3,740 zone, Titan bounced off the bottom range near ₹3,303 with a strong bullish candle & above-average volume (see chart).
Key Fibonacci levels: 23.6% at 3,406, 38.2% at 3,470, and 61.8% at 3,573.
🧮 Technical Analysis
Trend: Medium-term uptrend remains intact despite recent correction.
Volume: Spike to 1.45M signals aggressive buying near support.
Momentum: Bullish engulfing candle with open = low indicates strong intraday demand.
🎯 Key Levels
Support: 3,346 / 3,297 / 3,255
Resistance: 3,437 / 3,473 / 3,528
Top Range: 3,740 (major breakout level)
📊 Volume & Indicators
Bullish VWAP confirmation with BBSqueeze OFF → potential breakout if liquidity holds.
🆕 Latest Update & Growth Outlook
FY28 EPS projected ~₹75–76 (21% CAGR).
High ROE (~35%) and sustained jewellery demand keep Titan a premium growth play.
💹 STWP Educational Trade Illustration
This illustration is only for learning purposes and not a recommendation to trade or invest.
Chart Observation: Price action shows a recent bullish reversal near the ₹3,300 support zone with strong volume.
Illustrative Setup: A trader studying this pattern might observe a potential entry area around ₹3,418 with a protective stop near ₹3,300 to manage risk.
Potential Price Zones: Key resistance zones lie near ₹3,740 and ₹3,850, which could act as future reference levels if the bullish momentum continues.
Valuation Outlook: Based on projected FY28 EPS of about ₹75–76 and an illustrative P/E multiple of 70×, some analysts estimate a theoretical long-term fair value band of around ₹5,300–₹5,500, provided growth assumptions hold.
⚠️ Risk Reminder
Gold price volatility and discretionary slowdown can impact margins.
Premium valuation (~80× trailing P/E) requires consistent earnings growth.
🏁 Final Outlook
Titan shows a strong reversal setup backed by robust fundamentals and premium brand positioning. Ideal for positional swing traders and long-term investors seeking compounding stories.
💡 Learning Note:
This setup demonstrates how price action + Fibonacci levels + surge in volume can signal a high-conviction reversal trade when aligned with long-term growth fundamentals.
⚠️ Disclosure & Disclaimer – Please Read Carefully
The information shared here is meant purely for learning and awareness. It is not a buy or sell recommendation and should not be taken as investment advice. I am not a SEBI-registered investment adviser, and all views expressed are based on personal study, chart patterns, and publicly available market data.
Trading—whether in stocks or options—carries risk. Markets can move unexpectedly, and losses can sometimes exceed the money you have invested. Past performance or past setups do not guarantee future results.
If you are a beginner, treat this as a guide to understand how the market works and practice on paper trades before risking real money. If you are experienced, always assess your own risk, position sizing, and strategy suitability before entering trades.
Consult a SEBI-registered financial adviser before making any real trading decision. By engaging with this content, you acknowledge full responsibility for your trades and investments.
💬 Found this useful?
🔼 Give this post a Boost to help more traders discover clean, structured learning.
✍️ Drop your thoughts, questions, or setups in the comments — let’s grow together!
🔁 Share with fellow traders and beginners to spread awareness.
👉 “If you liked this breakdown, follow for more clean, structured setups with discipline at the core.”
🚀 Stay Calm. Stay Clean. Trade With Patience.
Trade Smart | Learn Zones | Be Self-Reliant 📊
Supportandresistances

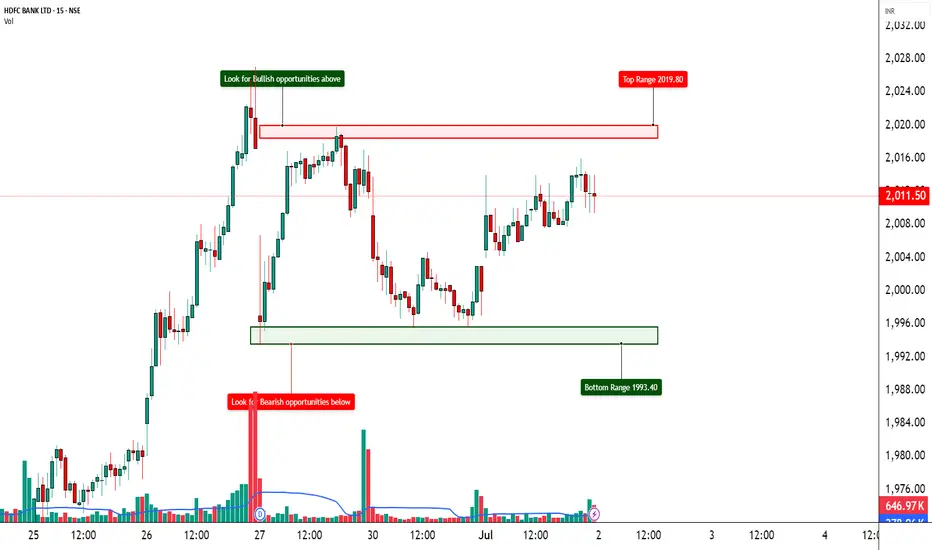
HDFCBANK – Stepping Into Bullish Territory?📈 HDFCBANK – Stepping Into Bullish Territory?
🔍 Strong Long Build-Up | Option Chain + Price Action Alignment
Chart Type: 15-min / 1H / Daily
Indicators: STWP Zones, Demand-Supply, Volume, OI Trends
🔹 What’s Catching Our Eye?
✅ Consistent Long Build-Up seen from 2000 CE to 2100 CE
✅ Massive OI Addition on 2040 CE (+6.33 lakh contracts = +50%)
✅ 2060 CE OI jumped +8.57 lakh = +82% – Serious bullish interest building up
✅ Put Writers exiting 2000 PE = Strong base forming around ₹2000
✅ Spot Price at ₹2012, sitting above psychological level
📊 What We’re Watching for:
📍 Breakout Zone: 2020–2040
📍 Targets: 2060 → 2080 → 2100
📍 Invalidation Below: 1985
📍 Momentum Confirmation: Strong close above 2040 with volume surge
📍 Option Chain Support: Heavy unwinding on 2000 PE confirms strength
📌 Trade Plan (Educational Purpose Only):
🔹 Bullish Idea: Buy above 2025 breakout with SL below 1985
🔹 Options: Look at 2040 or 2060 CE for directional exposure
🔹 BTST/Positional: If price closes above 2040 with rising OI and IV
⚠️ Disclaimer:
This post is for educational and learning purposes only.
It does not constitute buy/sell advice or investment recommendation.
Always consult your financial advisor before taking any positions.
STWP is not liable for any financial decisions based on this content.
📚 “Price is the headline, but data is the real story.”
💬 Will HDFCBANK reclaim its momentum zone, or is this just noise before the next move?
IRFC - Falling Wedge,This chart displays the daily price action of Indian Railway Finance Corporation Limited (IRFC) on the NSE (National Stock Exchange of India). Here’s an analysis based on the chart provided:
### Key Observations:
1. **Descending Wedge Pattern**:
- The price action has formed a falling wedge, a bullish reversal pattern. The price has broken out of the wedge, indicating a potential upward move.
2. **Support and Resistance**:
- The previous resistance level around ₹193.10, which also acted as support in past, is key. The breakout from the wedge aligns with this level, suggesting a retest of this area.
3. **Volume Analysis**:
- There’s been a spike in volume during the breakout, indicating strong buying interest. This adds credibility to the bullish breakout.
4. **Relative Strength Index (RSI)**:
- The RSI is near the neutral zone around 49.53, which suggests there’s room for upward momentum before entering overbought territory. The recent uptick in RSI supports the bullish outlook.
### Possible Scenarios:
- **Bullish Case**: If the price sustains above the ₹193.10 level, a continuation of the upward trend could lead to further gains, potentially towards previous highs around ₹230.
- **Bearish Case**: If the price fails to hold above the wedge breakout level and drops back into the pattern, a retest of lower support levels around ₹165-170 is possible.
### Conclusion:
The chart suggests a bullish breakout with potential for further upside, but watching the ₹193.10 resistance level is crucial for confirmation. The RSI and volume are supportive of a bullish scenario, but risk management is important in case of a false breakout.

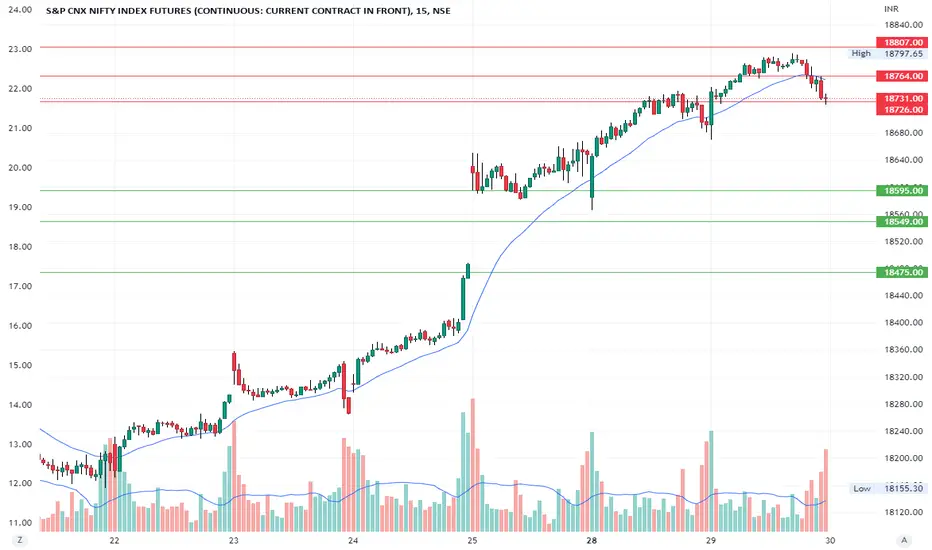
#Nifty future 15Min #SupportandResistance for 29/12/2022Hi All, here I shared my view on #nifty future Supports and Resistances level for 29/12/2022. for educational purpose only, not for trade recommended.

#Nifty future 15Min #SupportandResistance for 28/12/2022Hi All, here I shared my view on #nifty future Support and Resistance level for 28/12/2022. for educational purpose only, not for trade recommended.

#Nifty future 15Min #SupportandResistance for 27/12/2022Hi All, here I shared my view on #nifty future Support and Resistance level for 27/12/2022. for educational purpose only, not for trade recommended.

#Nifty future 15Min #SupportandResistance for 26/12/2022Hi All, here I shared my view on #nifty spot Support and Resistance level for 26/12/2022. for educational purpose only, not for trade recommended.

#Nifty future 15Min #SupportandResistance for 23/12/2022Hi All, here I shared my view on #nifty future Support and Resistance level for 23/12/2022. for educational purpose only, not for trade recommended.

#Nifty spot 15Min #SupportandResistance for 22/12/2022Hi All, here I shared my view on #nifty spot Support and Resistance level for 22/12/2022. for educational purpose only, not for trade recommended.

#Nifty spot 15Min #SupportandResistance for 21/12/2022Hi All, here I shared my view on #nifty spot Support and Resistance level for 21/12/2022. for educational purpose only, not for trade recommended.

#Nifty spot 15Min #SupportandResistance for 20/12/2022Hi All, here I shared my view on #nifty spot Support and Resistance level for 20/12/2022. for educational purpose only, not for trade recommended.

#Nifty spot 15Min #SupportandResistance for 19/12/2022Hi All, here I shared my view on #nifty spot Support and Resistance level for 19/12/2022. for educational purpose only, not for trade recommended.

#Nifty spot 15Min #SupportandResistance for 15/12/2022Hi All, here I shared my view on #nifty spot Support and Resistance level for 15/12/2022. for educational purpose only, not for trade recommended.

#Nifty spot 15Min #SupportandResistance for 13/12/2022Hi All, here I shared my view on #nifty spot Support and Resistance level for 13/12/2022. for educational purpose only, not for trade recommended.

#Nifty spot 15Min #SupportandResistance for 12/12/2022Hi All, here I shared my view on #nifty spot Support and Resistance level for 12/12/2022. for educational purpose only, not for trade recommended.

#Nifty spot 15Min #SupportandResistance for 09/12/2022Hi All, here I shared my view on #nifty spot Support and Resistance level for 09/12/2022. for educational purpose only, not for trade recommended.

#Nifty spot 15Min #SupportandResistance for 08/12/2022Hi All, here I shared my view on #nifty spot Support and Resistance level for 08/12/2022. for educational purpose only, not for trade recommended.

#Nifty spot 15Min #SupportandResistance for 07/12/2022Hi All, here I shared my view on #nifty spot Support and Resistance level for 07/12/2022. for educational purpose only, not for trade recommended.

#Nifty spot 15Min #SupportandResistance for 06/12/2022Hi All, here I shared my view on #nifty spot Support and Resistance level for 06/12/2022. for educational purpose only, not for trade recommended.

#Nifty Spot 15Min #SupportandResistance for 05/12/2022Hi All, here I shared my view on #nifty spot Support and Resistance level for 05/12/2022. for educational purpose only, not for trade recommended.

#Nifty Spot 15Min #SupportandResistance for 02/12/2022Hi All, here I shared my view on #nifty spot Support and Resistance level for 02/12/2022. for educational purpose only, not for trade recommended.

#Nifty spot 15Min #SupportandResistance for 01/12/2022Hi All, here I shared my view on #nifty spot Support and Resistance level for 01/12/2022. for educational purpose only, not for trade recommended.

#Nifty 15Min #SupportandResistance for 30/11/2022 #NIFTYFUTUREHi All, here I shared my view on #niftyfuture Support and Resistance level for 30/11/2022. for educational purpose only, not for trade recommended.