IRFC - Falling Wedge,This chart displays the daily price action of Indian Railway Finance Corporation Limited (IRFC) on the NSE (National Stock Exchange of India). Here’s an analysis based on the chart provided:
### Key Observations:
1. **Descending Wedge Pattern**:
- The price action has formed a falling wedge, a bullish reversal pattern. The price has broken out of the wedge, indicating a potential upward move.
2. **Support and Resistance**:
- The previous resistance level around ₹193.10, which also acted as support in past, is key. The breakout from the wedge aligns with this level, suggesting a retest of this area.
3. **Volume Analysis**:
- There’s been a spike in volume during the breakout, indicating strong buying interest. This adds credibility to the bullish breakout.
4. **Relative Strength Index (RSI)**:
- The RSI is near the neutral zone around 49.53, which suggests there’s room for upward momentum before entering overbought territory. The recent uptick in RSI supports the bullish outlook.
### Possible Scenarios:
- **Bullish Case**: If the price sustains above the ₹193.10 level, a continuation of the upward trend could lead to further gains, potentially towards previous highs around ₹230.
- **Bearish Case**: If the price fails to hold above the wedge breakout level and drops back into the pattern, a retest of lower support levels around ₹165-170 is possible.
### Conclusion:
The chart suggests a bullish breakout with potential for further upside, but watching the ₹193.10 resistance level is crucial for confirmation. The RSI and volume are supportive of a bullish scenario, but risk management is important in case of a false breakout.
Supportandresistances

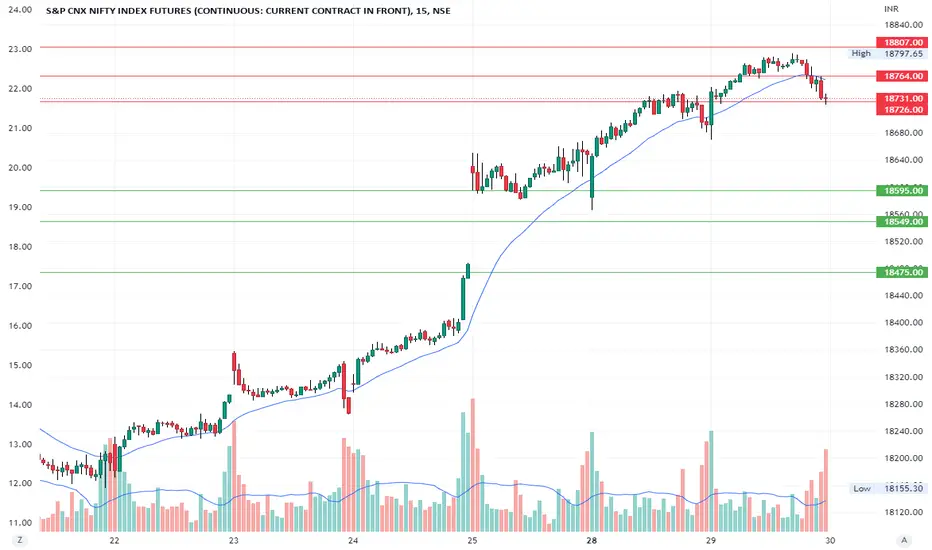
#Nifty future 15Min #SupportandResistance for 29/12/2022Hi All, here I shared my view on #nifty future Supports and Resistances level for 29/12/2022. for educational purpose only, not for trade recommended.

#Nifty future 15Min #SupportandResistance for 28/12/2022Hi All, here I shared my view on #nifty future Support and Resistance level for 28/12/2022. for educational purpose only, not for trade recommended.

#Nifty future 15Min #SupportandResistance for 27/12/2022Hi All, here I shared my view on #nifty future Support and Resistance level for 27/12/2022. for educational purpose only, not for trade recommended.

#Nifty future 15Min #SupportandResistance for 26/12/2022Hi All, here I shared my view on #nifty spot Support and Resistance level for 26/12/2022. for educational purpose only, not for trade recommended.

#Nifty future 15Min #SupportandResistance for 23/12/2022Hi All, here I shared my view on #nifty future Support and Resistance level for 23/12/2022. for educational purpose only, not for trade recommended.

#Nifty spot 15Min #SupportandResistance for 22/12/2022Hi All, here I shared my view on #nifty spot Support and Resistance level for 22/12/2022. for educational purpose only, not for trade recommended.

#Nifty spot 15Min #SupportandResistance for 21/12/2022Hi All, here I shared my view on #nifty spot Support and Resistance level for 21/12/2022. for educational purpose only, not for trade recommended.

#Nifty spot 15Min #SupportandResistance for 20/12/2022Hi All, here I shared my view on #nifty spot Support and Resistance level for 20/12/2022. for educational purpose only, not for trade recommended.

#Nifty spot 15Min #SupportandResistance for 19/12/2022Hi All, here I shared my view on #nifty spot Support and Resistance level for 19/12/2022. for educational purpose only, not for trade recommended.

#Nifty spot 15Min #SupportandResistance for 15/12/2022Hi All, here I shared my view on #nifty spot Support and Resistance level for 15/12/2022. for educational purpose only, not for trade recommended.

#Nifty spot 15Min #SupportandResistance for 13/12/2022Hi All, here I shared my view on #nifty spot Support and Resistance level for 13/12/2022. for educational purpose only, not for trade recommended.

#Nifty spot 15Min #SupportandResistance for 12/12/2022Hi All, here I shared my view on #nifty spot Support and Resistance level for 12/12/2022. for educational purpose only, not for trade recommended.

#Nifty spot 15Min #SupportandResistance for 09/12/2022Hi All, here I shared my view on #nifty spot Support and Resistance level for 09/12/2022. for educational purpose only, not for trade recommended.

#Nifty spot 15Min #SupportandResistance for 08/12/2022Hi All, here I shared my view on #nifty spot Support and Resistance level for 08/12/2022. for educational purpose only, not for trade recommended.

#Nifty spot 15Min #SupportandResistance for 07/12/2022Hi All, here I shared my view on #nifty spot Support and Resistance level for 07/12/2022. for educational purpose only, not for trade recommended.

#Nifty spot 15Min #SupportandResistance for 06/12/2022Hi All, here I shared my view on #nifty spot Support and Resistance level for 06/12/2022. for educational purpose only, not for trade recommended.

#Nifty Spot 15Min #SupportandResistance for 05/12/2022Hi All, here I shared my view on #nifty spot Support and Resistance level for 05/12/2022. for educational purpose only, not for trade recommended.

#Nifty Spot 15Min #SupportandResistance for 02/12/2022Hi All, here I shared my view on #nifty spot Support and Resistance level for 02/12/2022. for educational purpose only, not for trade recommended.

#Nifty spot 15Min #SupportandResistance for 01/12/2022Hi All, here I shared my view on #nifty spot Support and Resistance level for 01/12/2022. for educational purpose only, not for trade recommended.

#Nifty 15Min #SupportandResistance for 30/11/2022 #NIFTYFUTUREHi All, here I shared my view on #niftyfuture Support and Resistance level for 30/11/2022. for educational purpose only, not for trade recommended.
#Nifty 15Min #SupportandResistance for 28/11/2022 #NIFTYFUTUREHi All, here I shared my view on #niftyfuture Support and Resistance level for 28/11/2022. for educational purpose only, not for trade recommended.

#Nifty 15Min #SupportandResistance for 25/11/2022 #NIFTYFUTUREHi All, here I shared my view on #niftyfuture Support and Resistance level for 25/11/2022. for educational purpose only, not for trade recommended.
