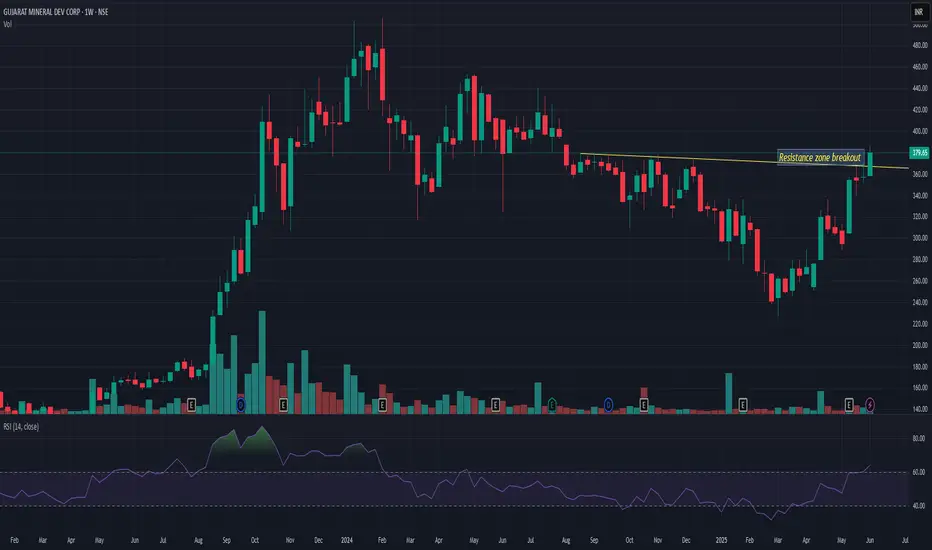
GMDCLTD GMDCLTD seems very strong on weekly charts. Shown strong momentum in recent trading days. And closing above 200 MA since last 5-7 sessions. Now if it closes above 385 then again it may resume its uptrend and may go up to 460 levels from here. 350 is very strong support. So closing below this may change my view
Supportandresistancezones
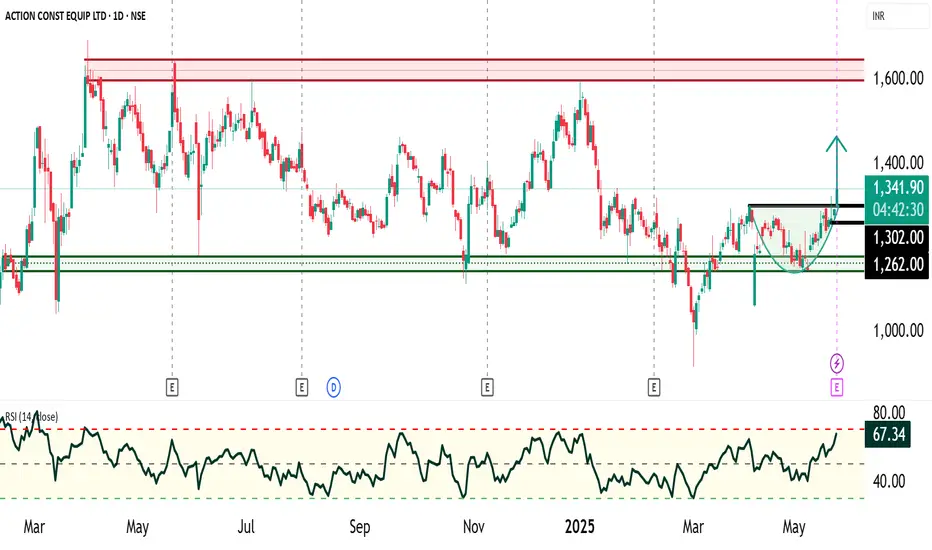
ACE Construction Ltd : Rounding Bottom Chart PatternACE Construction Ltd has been consolidating in a broad sideways range between ₹1,150 to ₹1,600 since February 2024. The price action has clearly defined support and resistance levels, with ₹1,150–₹1,200 acting as a strong accumulation zone and ₹1,550–₹1,600 serving as a firm resistance, where selling pressure consistently emerges.
Technical Pattern Observed (Hourly Timeframe): A Rounding Bottom pattern has been identified on the hourly chart, which is a bullish reversal pattern, indicating a shift from bearish to bullish sentiment.
Neckline Breakout Level: ₹1,300 (confirmed)
Breakout Confirmation: Price closed above neckline with volume support
Target Estimation (Measurement Rule):
Target 1: ₹1,450
Target 2 (Final): ₹1,550
Stop Loss: ₹1,260 (last swing high before breakout, risk-managed level)
Momentum & Trend Indicators:
Multi-EMA Bullish Crossover: Multiple exponential moving averages have aligned in a bullish formation, signaling trend continuation.
Relative Strength Index (RSI): Currently above 60, reflecting strengthening momentum and buyer dominance.
Fundamental Context: ACE Construction Ltd remains **fundamentally strong** with robust financials and growth visibility. The current price level provides an **attractive valuation**, further supporting the bullish technical setup.
Conclusion: The current technical setup presents a high-probability bullish opportunity in ACE Construction Ltd. The completion and breakout of the rounding bottom pattern, supported by bullish momentum indicators and favorable valuation, make a strong case for upward price movement towards ₹1,450–₹1,550 in the near term.
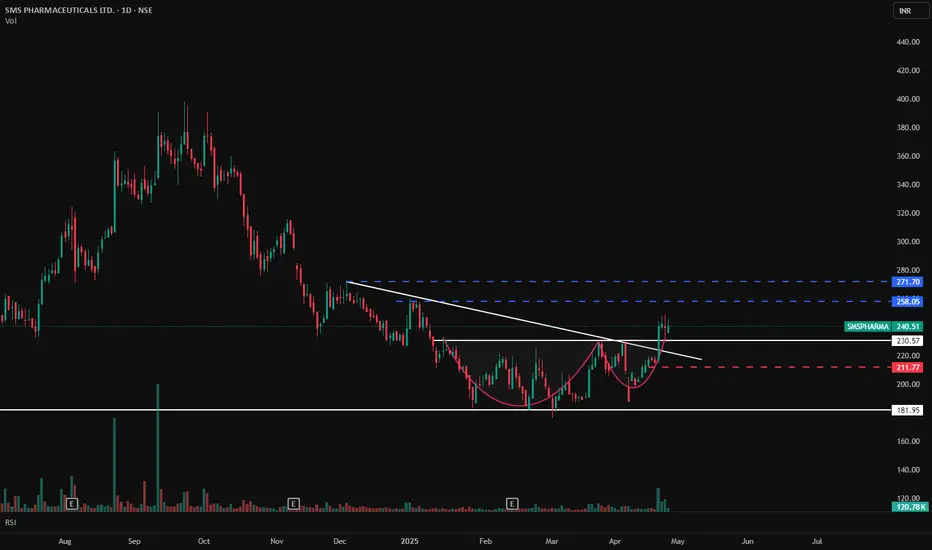
SMS PHARMA - Cup & Handle Breakout with Volume Confirmation📊 SMS PHARMA – Cup & Handle Breakout with Volume Confirmation
🕰️ Timeframe: 1D | 📐 Pattern: Cup & Handle Formation
🔍 Technical Setup:
SMS Pharma has formed a classic Cup & Handle pattern, which is a bullish continuation pattern. The breakout has occurred above the neckline resistance with a clean breakout candle, confirming bullish momentum.
The falling trendline resistance has also been decisively broken, adding further confidence to the breakout strength.
🔑 Key Levels to Watch:
🔵 Resistance (Upside Targets):
₹258.05
₹271.70
🔴 Support Zones:
₹230.57 (neckline support)
₹211.77 (handle base)
₹181.95 (major horizontal support zone)
📊 Volume & Indicators:
🔺 Volume Surge at breakout confirms strength and participation — a good sign for trend continuation.
📈 RSI: 64.58 — close to overbought zone, but still indicating strength. Minor consolidation near ₹240 would be healthy before further up move.
🧠 Bias: Bullish
📉 Any pullback to ₹230–₹235 can offer a good entry opportunity with risk managed below ₹211.
⚠️ Disclaimer: This is an educational analysis and not investment advice. Do your own research before making any trading decisions.
📈 Follow @PriceAction_Pulse for more breakout setups and swing trading ideas!
💬 Drop your thoughts in the comments — will this Cup & Handle breakout hit the ₹270 zone?
DOGEUSDT IN THE DANGER ZONE - SELLERS IN CONTROL?Symbol - DOGEUSDT
DOGEUSDT is encountering sustained selling pressure. Following a distribution phase characterized by a sharp upward move, the price has entered a correction phase and is now approaching a critical support area - often referred to as the 'panic zone'. A decisive breakdown below this level could accelerate the decline and trigger a more pronounced bearish trend.
DOGEUSDT has effectively relinquished the upward momentum accumulated during late April and early May. The distribution phase concluded around the 0.2600 level, after which the coin transitioned into a corrective decline. At present, DOGEUSDT is testing the pivotal support zone near 0.2140.
The focal point now is the base of the triangle formation near 0.2140 - a critical zone of support. A breakdown below this level would likely result in the liquidation of long positions and may prompt increased selling activity, thereby fueling bearish momentum.
Resistance levels: 0.2220, 0.2307
Support levels: 0.2145, 0.2135
The prevailing scenario anticipates a continuation of the downward trend. The primary trigger for further decline would be a confirmed breakdown below the 0.2135 support level, accompanied by price consolidation beneath this threshold.
Important Note: This bearish outlook would be invalidated if the price reverses and establishes sustained consolidation above 0.2220, A confirmed move above 0.2300 would strengthen bullish sentiment, at which point a renewed upward outlook would be considered.

ONWARD TECHNOLOGIES LTD📊 ONWARD TECHNOLOGIES LTD (1D) – CMP ₹313.00
📅 Published on: May 17, 2025
📈 Exchange: NSE
📌 Ticker: ONWARDTEC
🔍 Technical Chart Analysis
✅ Trendline Breakout:
A clean downtrend line breakout is visible on the daily chart, marking the end of a prolonged bearish phase. Price has decisively broken above the falling resistance trendline with a sharp bullish candle and strong volume confirmation.
✅ Volume Surge:
Breakout occurred with a 17.76% gain and significantly higher volume (1.23M), hinting at strong buying interest and possible institutional accumulation.
✅ Fibonacci Retracement Zones (from swing high ₹731.00 to low ₹207.30):
38.2% – ₹407.40
50.0% – ₹469.20
61.8% – ₹531.00
78.6% – ₹618.95
100% – ₹731.00
✅ Support Confirmation:
The price held the multi-year support zone around ₹207.97, which aligns with the 0.00% Fibo level, forming a strong base for reversal.
🧱 Key Support & Resistance Levels
🟩 Support Zones:
₹207.97 (Major long-term support)
₹265–270 (Breakout retest zone if pullback happens)
🟥 Resistance Zones (Fibonacci-based):
₹407.40 (38.2% FIB)
₹469.20 (50.0% FIB)
₹531.00 (61.8% FIB - Golden Ratio)
₹618.95
₹731.00 (Previous ATH)
📉 Timeframe: Daily (1D)
📈 Sentiment: Turning Bullish
💡 Conclusion:
After a long correction, ONWARDTEC has shown a breakout with strong volume from a downtrend line. Holding above ₹300 levels can open room for targets near ₹407–₹469 and beyond. A good setup for swing traders looking for reversal entries.
📌 Disclaimer:
This analysis is for educational and informational purposes only. Not financial advice. Please consult your advisor before making investment decisions.

Supply-Demand Flip Play with Volume Spike📈 BHARAT DYNAMICS LTD | Supply-Demand Flip Play with Volume Spike
📅 Date: May 09, 2025
📈 Timeframe: 15-Minute
🔍 Stock: BDL (NSE)
📊 **Price Action Update (Today):**
BDL opened strong at 1455 and rallied till 1595 before slipping down from a previously tested **Supply Zone (1547.40 – 1576.00)** The intraday move witnessed a sharp bullish rally from sub-1,455 levels, only to reverse sharply from the overhead supply. This creates a textbook example of **supply rejection after a demand-driven impulse**. The candle near close reflects a high-wick bearish rejection.
🧠 **Technical Overview:**
Today’s session was a high-volatility play showcasing both demand and supply dynamics. A **Possible Demand Zone (1447.30 – 1460.90)** emerged from a sharp buying reaction, indicating strong institutional interest. The price shot up almost ₹100 points in a short span with surging volumes, testing the overhead **Retested Supply Zone**, which held firm — confirming sellers’ presence. This makes the area between **1547 and 1576** a critical resistance for future rallies. Until broken decisively, traders should remain cautious about fresh longs at higher levels.
🧩 **Chart Pattern Insight:**
BDL’s 15-min chart displays a classic **Demand-to-Supply Flip** — a rally from demand, quick run-up, and sharp rejection at a pre-marked supply. This is often referred to as a “trap move” where late buyers are caught at highs. The clean volume spike at the breakout and immediate rejection within the supply zone is a common pattern seen in smart money distribution phases. Traders can look for potential **shorting setups** if the price re-enters the supply with weak momentum or **buying opportunities near the demand zone**, only with volume confirmation.
🧱 **Support & Resistance Analysis:**
* 🔼 **Resistance (Supply Zone):** 1547.40 – 1576.00
* 🔽 **Support (Demand Zone):** 1447.30 – 1460.90
A breakout above 1576 with strong volume can invalidate the supply zone. Until then, this remains a selling area. On the downside, if the price revisits the demand zone, it may offer a low-risk buying opportunity — but only if it holds with bullish candles and rising volume.
🔍 **Volume Analysis:**
The volume surged dramatically on the rally towards the supply zone, showing panic buying or aggressive short covering. The final rejection candle also saw elevated volume, which adds weight to the **supply zone rejection thesis**. Prior candles had lower volume, indicating absorption near lows and sudden spike into resistance. This is a signature behavior of “liquidity grabs.”
📌 **Educational Insight:**
This chart provides a clean **example of how price reacts to supply and demand zones**, especially intraday. Demand zones are best used for potential long setups only after a bullish confirmation, while supply zones can be used for shorts or to exit longs. These zones act as emotional points — where institutions look to trap retail traders. For intraday traders, this scenario shows why waiting for confirmation is key before entering trades around such zones.
⚠️ **Disclaimer:**
This analysis is for educational purposes only and does not constitute any investment advice or stock recommendation. Please consult with your financial advisor before taking any trading decisions. This post complies with SEBI regulations and is intended to promote financial literacy.

HOMEFIRST Long Idea .......HOMEFIRST chart shows strength with volumes in last few weeks. Channel breakout will push price higher.
Stoploss and Targets are given in Chart.
Risk Management is important.
NOTE: It is Housing Finance company. Good ROE over the years. Not much affected with NPA's like Micro-Finance companies. Fundamentals good. Portfolio stock. It also needs lower Interest rates to drive growth in company.

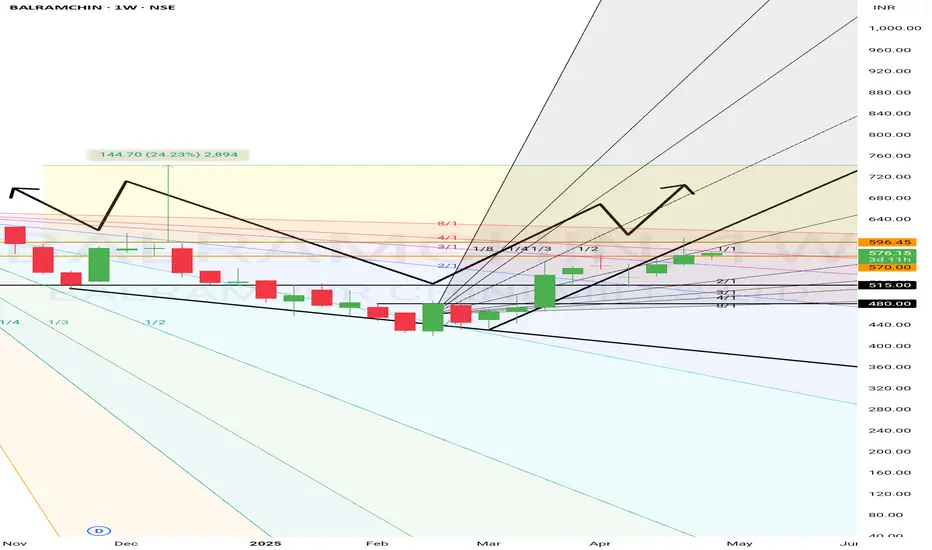
Analysis on Balrampur chiniIt Seems this stock is advancing towards it's resistance at 597, Once the resistant is broken then only it can hit it's target at 24% above breakout which was Previously at 575.2. The only issue is that if it Cannot break it's resistance the price may fall to it's support level as masked on chart. Hope to see stock move in momentum on daily basis so that upward direction continues.
SBICARD Looks good...SBICARD looks good for reversal in weekly chart.
Can Accumulate between 700-750 zone. Might reach channel upper line in coming years. Targets are given.
Stoploss for longtermInvestors is given.
Note : No idea about fundamentals. View is completely based on technical view of chart.

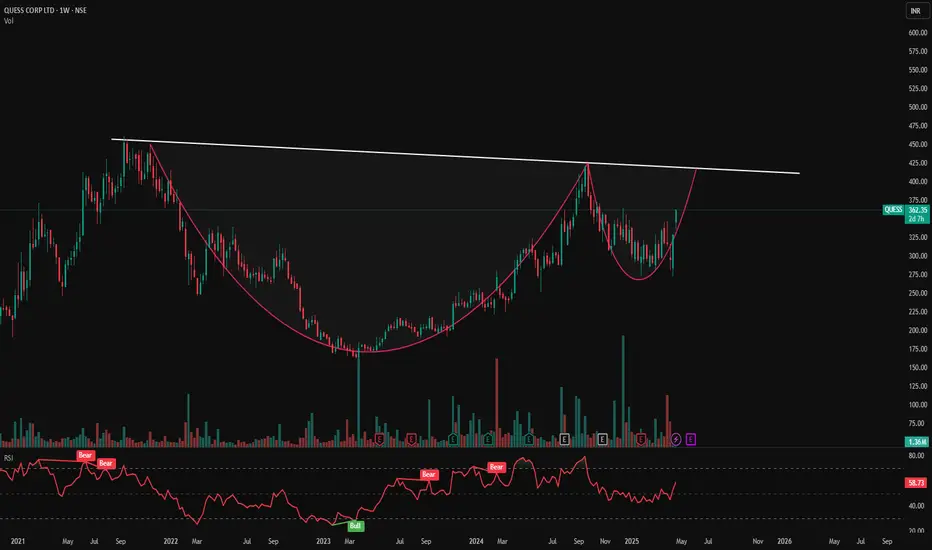
QUESS CORP LTD- Weekly Chart Analysis📊 QUESS CORP LTD – Weekly Chart Analysis
🕰️ Timeframe: 1W | 📈 Pattern: Cup & Handle Formation
🔍 Chart Overview:
QUESS is exhibiting a classic multi-year Cup & Handle pattern, forming over 3 years — a powerful technical setup indicating potential bullish continuation.
Currently, price is approaching a crucial descending trendline resistance that has been respected multiple times. A breakout above this level with volume confirmation could signal a major upside.
🔑 Key Technical Highlights:
📉 Trendline Resistance: Near ₹420
🟢 Immediate Resistance Zone: ₹390–₹420
🛑 Support Zone: ₹325–₹300
🔁 Breakout Watch: Close above ₹420 (weekly) with volume = bullish confirmation
📊 Volume & Momentum:
Increasing volume on recent up moves
RSI trending upward (if included, add RSI screenshot or note over 60+)
🧠 Bias: Bullish (on breakout confirmation)
🔔 What to Watch:
🔓 Breakout above ₹420 = trigger for swing/mid-term entries
📉 Breakdown below ₹325 may invalidate pattern
⚠️ Disclaimer: This is not financial advice. Chart shared for educational purposes only. Do your own research before investing.
📌 Follow for more chart setups | PriceAction_Pulse
💬 Drop your views or questions in comments!
KOTAKBANK Long Idea.....KOTAKBANK chart shows its near support zone. need to see what price does near supoort.
Will enter on confirmation of Breaking weekly resistance.
Fundamentals:
Pro's: SALES & PAT growth CAGR is positive these 3 years where price is in zone. Not an Overvalued stock.
Con's: PE derating might have happened due to drop in sales growth. this may continue till its growth kicks in coming quarters.

BAAZAR STYLE RETAIL LTD - Breakout Alert!📈 Chart Overview:
The stock has broken out of a long-term descending trendline with strong volume confirmation.
RSI is approaching the overbought zone, indicating strong momentum.
🔍 Key Levels:
Resistance: ₹320, ₹400
Support: ₹260, ₹200
📊 Observations:
A trendline breakout with a 20% price surge signals bullish strength.
RSI breakout suggests a potential continuation, but caution is needed for overbought conditions.
🚀 Trading View:
If the price sustains above ₹320, it could move toward ₹400.
A pullback to ₹260 could provide a good re-entry opportunity.
📌 Disclaimer: This is for educational purposes only. Do your research before making any trades.

SANDUMA-Positional Long trade-Swing tradeStock has rejected trendline multiple times. In next 1-2 session if it holds above 450 and breakout the trendline with bullish candle. Good opportunity to go long.
If it falls below 450, avoid.
Please don't forget click on follow button so you won't miss any upcoming ideas.
Any confusion, feel free to drop msg. Happy to help :)
This is only for educational purpose, please manage your risk accordingly.

RCF is in bullish mode.RCF is forming evening star candle stick pattern on monthly chart.
As per chart it may test 240 soon as it is previous high level.
Returns around 78%.
As per report upcoming monsoon session will be better than expectation.
It is in Demand zone can long it for next 2-4 months.

ETERNAL(ZOMATO)-Short term/positional long tradeStock has rejected trendline multiple times. From past 2 days it's holding near trendline and gone side ways.
If we see a breakout in 15th Apr'25 trading session it is good opportunity to go long.
Please avoid if goes below 218 or Opens gap down.
Please don't forget click on follow button so you won't miss any upcoming ideas.
Any confusion, feel free to drop msg. Happy to help :)
This is only for educational purpose, please manage your risk accordingly.

ULTRACEMCO-4hr/1day Long tradeThe stock has corrected within the recent fall and fully recovered. Almost trading near ATH.
Current high has tested multiple times.
On next trading session it has to open above 11400 good opportunity for long, if gap down avoid.
Any confusion, feel free to drop msg. Happy to help :)
This is only for educational purpose, please manage your risk accordingly.

Union Bank of India - Inverse Head & Shoulders Breakout!Union Bank of India (NSE: UNIONBANK)—Inverse Head & Shoulders Breakout! 🚀
📈 Chart Overview:
The stock has formed a multiple inverse head & shoulders pattern, indicating a strong bullish reversal.
A downtrend resistance has been breached, confirming bullish momentum.
🔍 Key Levels:
Resistance Levels: ₹140, ₹150
Support Levels: ₹125, ₹120
📊 Observations:
Volume spike supports the breakout, signaling strong buying interest.
RSI at 66.34, approaching overbought levels but still has room for further upside.
Sustaining above ₹130.02 will confirm further bullishness.
🚀 Trading View:
A breakout above ₹135 could lead to a further rally toward ₹140-₹150.
Any retest of ₹130.02 can act as a potential buying opportunity.
📌 Disclaimer: This is for educational purposes only. Always conduct your research before making any investment decisions.

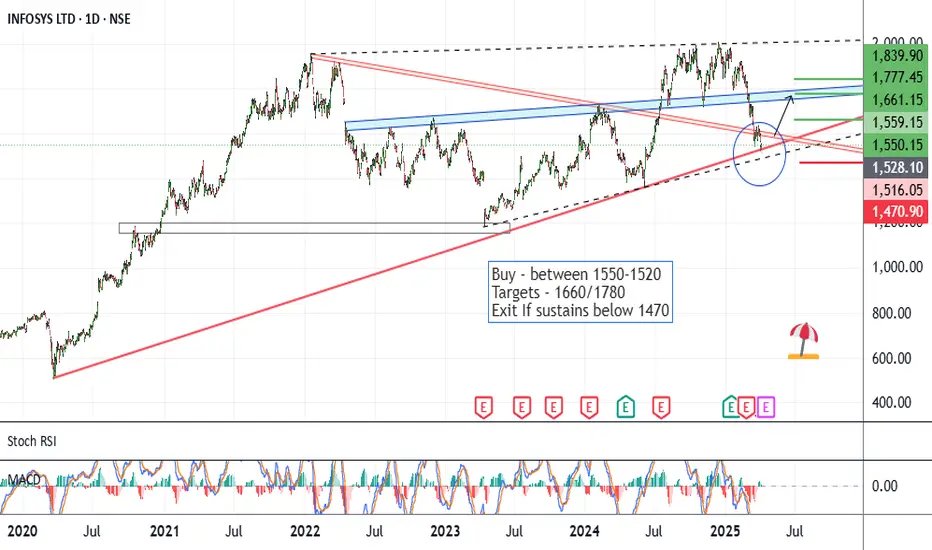
Infy - Long SetupCMP 1550 on 03.04.25
The chart marks all the important levels. The stock price has corrected by around 25% in recent weeks. According to the above setup, it seems to be on the supports.
If it reverses from these levels, it may go into a bullish phase ahead. Possible targets may be 1660/1780/1840.
The setup will lose significance if the price sustains below 1470.
One should keep the position size according to risk management.
All these illustrations are only for learning and sharing purposes, not a trading recommendation.
All the best.
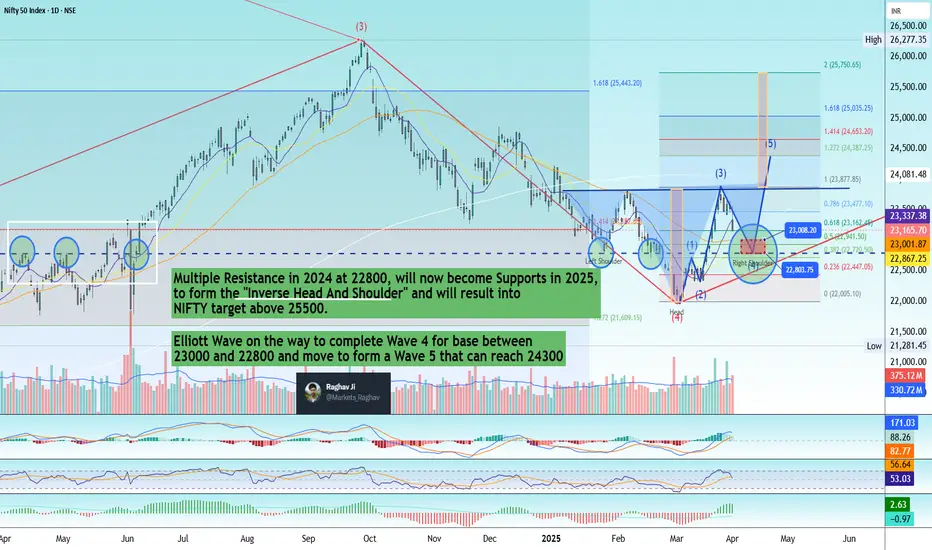
Shocked by Nifty50's sharp correction? Don't worry!Today NIFTY has crashed by 350+ points and reached 23165, a correction from 23800 levels .
Let me explain, This Nifty Daily chart is a classic example of how many fundamentals of Technical Analysis are satisfied.
1) Old resistances in 2024 at 22800 will now become Support levels
2) If it goes to 23000 and stops at 22800 levels it also fulfils the Wave 4 criteria, which says that Wave 4 never gets in Wave 1 territory
3) If this happens, the chart also completes an Inverse Head and Shoulder's Right Shoulder bottom to make an up-move towards the Neck.
4) if it crosses the Neck, the targets of Nifty will be above 25500, which will be 2500+points.
Technicals are beautiful only when you practice them.
Coal India Ltd - Breakout & Retest with Bullish MomentumCoal India Ltd has successfully broken a key resistance level and is currently retesting it, indicating potential bullish continuation. Entry zones are well-defined with a stop-loss to manage risk. Targets align with previous resistance levels, confirming strong risk-reward potential.
⚡ Key Technical Points:
- Resistance Breakout & Retest: Price has broken resistance and is retesting, a bullish confirmation signal.
- Resistance Breakout & Re-test 🔵
- Entry 1 - 401 🟢
- Entry 2 - 354 🟢 (Support Zone)
- Stop-Loss below 346 🔴 (Risk Management)
- Target 1 - 440.80 📈
- Target 2 - 502.75 📈
Why This is a Technically Strong Setup:
- ✅ Resistance Breakout & Retest: Price has broken a key resistance and is retesting it, a classic bullish continuation signal.
- ✅ Strong Support Levels: The 354 zone has acted as a solid support multiple times, making it a high-probability entry.
- ✅ Moving Averages Alignment: Price is reclaiming key moving averages, signaling trend reversal.
- ✅ Volume Confirmation: The breakout was backed by increasing volume, adding strength to the move.
- ✅ Favorable Risk-Reward Ratio: Defined stop-loss below 346 minimizes downside risk while upside targets offer a strong reward.
- ✅ Higher Highs & Higher Lows: Market structure suggests a shift to an uptrend.
🚨 No financial advice. Do your own research.

Zomato is showing weakness it may test 170 soon.Zomato is weak on monthly and weakly chart. It forms Fake breakout with double top pattern on monthly chart.
As per chart showing weakness on daily chart also as RSI drag below 40. It can short on any rise or here for target 170 soon.

LAYERUSDT - TIME FOR REVERSAL?Symbol - LAYERUSDT
CMP - 1.4200
LAYERUSDT is currently exhibiting a consolidation phase within an ongoing uptrend. The asset is outperforming the broader market; however, the initial reaction to the significant resistance at 1.4200 may result in a false breakout, followed by a retracement towards 1.275 or the 0.5 Fibonacci level.
Since the start of the session, LAYERUSDT has surpassed its daily Average True Range (ATR). However, upon encountering resistance, the coin may lack the momentum required for sustained upward movement. Liquidity in the vicinity of the 1.4200 level could serve to restrict price action, hindering the asset’s ability to break through this barrier on the first attempt.
At present, Bitcoin is testing its trend resistance, which could potentially lead to a reversal or continuation of its current downtrend, influencing altcoin prices accordingly.
Resistance levels: 1.4200, 1.4900
Support levels: 1.2932, 1.2747
The outcome hinges on the price's response at the 1.400 level. A sharp and distributive approach, with a high probability, is expected to result in a false breakout and a correction towards the aforementioned support levels. However, should LAYERUSDT show signs of slowing down and consolidating near 1.4000, there could be an attempt at a breakout, with further price movement dependent on the outcome of that attempt.

Nifty at a 1000-Day Trendline Support - Finally we are here !!Nifty is currently testing a confluence of two long-term trendlines – one from the monthly timeframe (blue line) and another from the weekly timeframe (yellow line). This 1000-day trendline cluster is a major reactive support zone, making this a make-or-break level for the index.
🔍 Key Observations:
✔️ The blue trendline represents a long-term uptrend, making it a crucial level for institutional traders.
✔️ The yellow trendline, which has also acted as a dynamic support, adds strength to this zone.
✔️ A breakdown below this cluster could open doors for further downside
✔️ However, if Nifty holds this level, a strong rebound can be expected, potentially continuing its long-term bullish structure.
🚀 What’s Next?
A weekly close below this zone could accelerate selling pressure.
If buying emerges, this could be a great risk-reward trade for swing and positional traders.
Price action confirmation is key before making any major trading decisions!
🔥 Will this historical support hold, or is a deeper correction coming? Drop your thoughts in the comments! 👇
