Petronet LNG weekly price action analysis for Feb-Mar 2026Analysis date: 31-Jan-26
Please note: This analysis is for education purpose only for those who seek to understand price action.
Forthcoming Budget/Qtrly Results may render this analysis invalid.
Please consult with your financial advisor before taking any decisions.
Petronet LNG seems to have formed a good base/support in 285-265 region spending almost 6 months forming a cluster of HH/HL/LH/LL as seen on the charts.
If the stock comes near 285 to 265 region it may take support for targets near 305/320 levels. Keep SL at 260
Happy Trading!
Supportandresitance

POLICYBZR - STWP Equity Snapshot📊 STWP Equity Snapshot – PB Fintech Ltd (POLICYBZR)
(Educational | Chart-Based Interpretation)
POLICYBZR continues to trade within a well-defined range structure, with repeated rejection from the 1960–2000 supply / distribution zone and consistent buyer activity emerging near the 1650–1609 demand / value zone. The stock has once again reverted from upper supply and is currently attempting a recovery from this demand region. The area around 1720–1740 now acts as a near-term balance zone. Holding above this region keeps the recovery attempt structurally valid and allows price to test higher reaction zones near 1755 and 1790, where selling pressure has appeared previously. However, sustained acceptance above these levels would be required to improve directional confidence. On the downside, continued weakness below 1650, and especially below 1609, would signal structural weakness and increase the probability of deeper mean reversion within the range. Until either boundary is resolved, price action should be viewed as rotation rather than trend development.
Recent market conditions reflect a neutral but stabilising environment. The recent strong bullish candle highlights buyer response from demand, but not trend confirmation. Bollinger Band behaviour shows that price is emerging from a compressed phase, with early expansion attempts visible, though follow-through remains limited. The BB squeeze context indicates potential for movement, but direction remains undecided. RSI near 45–46 reflects balanced momentum, consistent with a range-bound market rather than a trending phase. Price interaction with short-term averages suggests short-term stabilisation, while the wide CPR structure reinforces expectations of two-sided activity, consolidation, and rotational price behaviour instead of immediate directional continuation.
Volume analysis adds important context to the recovery attempt. Participation has improved during the recent bounce from demand, indicating active buyer involvement rather than a low-liquidity reaction. At the same time, volume intensity remains moderate (Vol X near 1.0), with no signs of climax or exhaustion. Selling phases have not been accompanied by aggressive volume expansion, suggesting controlled supply rather than panic distribution. Overall, volume behaviour supports range stability and validates the demand-side response, while still falling short of confirming accumulation or breakout intent.
From a short swing perspective, POLICYBZR remains structurally neutral as long as price trades between the 1650–1609 demand zone and the 1960–2000 supply zone. Acceptance above intermediate resistance would be required to shift bias toward higher range expansion. Conversely, sustained acceptance below 1609 would elevate downside risk and suggest continuation of mean reversion toward lower structural levels. Until such confirmation occurs, consolidation and rotational movement within the range should be expected.
Final Outlook (Condition-Based):
Momentum is improving but not decisive, the trend remains range-bound, risk is elevated due to overhead supply, and volume is supportive but non-confirmatory.
💡 STWP Learning Note
In range markets, demand reactions show interest — only acceptance above supply confirms intent.
⚠️ Disclaimer
This post is shared strictly for educational and informational purposes. It is not investment advice or a recommendation. Please consult a SEBI-registered financial advisor before making any financial decision.
🚀 Stay Calm. Stay Clean. Trade With Patience.

Gold Futures | Bullish Reversal Setup from Demand ZoneThis chart shows a bullish setup on Gold Futures (GC1!) based on a pullback into a 2-Hour + 125-Minute Demand Zone confluence due to FII's pending orders.
I’m expecting the price to retrace back into the marked demand area before continuing higher toward the upside targets.
Plan
• Entry: Inside the 2H & 125m Demand Zone
• Stop Loss: Just below the zone
• Target 1: 4,401
• Target 2: 4,438

Axis Bank — Positional Long Setup | Plan the Pullback🟢 Long Plan – Buy the Dip Zone
🛒 Entry Zones
Entry 1: around ₹1140
Entry 2: around ₹1132–₹1124 (deeper fill zone)
⛔ Stop Loss
Below ₹1124 (decisive breakdown = setup invalid)
🎯 Upside Targets
Target 1: Previous support retest near ₹1214
Target 2: Resistance retest around ₹1274
Target 3: Trail the position toward ₹1528 if momentum continues
I prefer partial booking + trailing SL as price moves higher.
Trade Logic: A positive Trend & Pulse on daily and weekly time frames + A strong Demand Zone with FII's Pending Orders.
Part 1 Candle Stick Patterns Understanding What Option Trading Profits Mean
Option trading profits refer to the financial gains a trader earns by buying or selling options contracts.
These profits arise from correctly predicting price movement in the market.
Options are leveraged instruments, so small price moves can generate large returns.
Profit is calculated based on premium difference, time decay, volatility changes, and strike-to-spot movement.

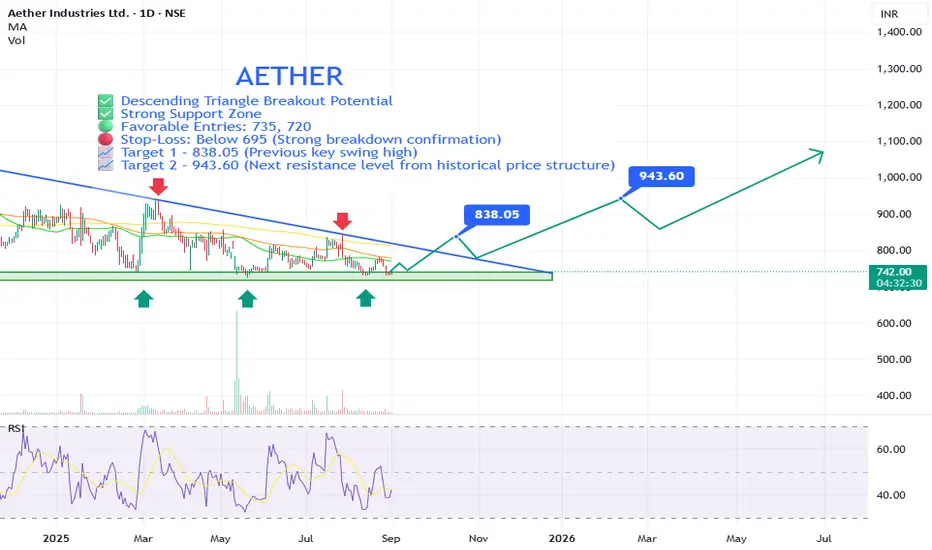
AETHER Bullish Reversal Setup with Strong Risk-Reward PotentialAether Industries Ltd is showing signs of a potential trend reversal from a well-established support zone, supported by a descending triangle breakout pattern and improving technical indicators. This setup suggests a strong risk-reward opportunity for swing traders and positional investors.
⚡ Key Technical Points:
🔵 Descending Triangle Breakout Potential: The price is nearing a breakout from a long-term descending triangle. A breakout above the trendline (~₹778–₹790) could trigger a strong uptrend.
🟢 Strong Support Zone: ₹700–₹720 has held as solid support multiple times (as marked by green arrows), indicating strong demand at these levels.
🟩 Bullish Divergence on RSI: Relative Strength Index (RSI) is showing higher lows while price remains flat or lower, indicating bullish divergence—a sign of potential reversal.
🟢 Favorable Entries: 735, 720
🔴 Stop-Loss: Below 695 (Strong breakdown confirmation)
📈 Target 1 – 838.05 (Previous key swing high)
📈 Target 2 – 943.60 (Next resistance level from historical price structure)
✅ Why This Is a Technically Strong Setup:
✅ Multiple Support Bounces: 700–720 zone has been tested at least 4 times in the last year, showing strength.
✅ Volume-Based Reactions: While volume is low now, past spikes at support zones suggest institutional interest.
✅ Clear Risk Management: Stop-loss is tight (~6–7%) with targets offering 1.5–3x risk-reward potential.
✅ Potential Trend Reversal: Break above descending trendline and moving averages could signal a shift to bullish structure.
✅ Long Base Formation: The stock has been consolidating for over a year—long base formations often lead to explosive moves.
📢 Disclaimer: This is not financial advice. Always do your own research or consult with a professional before making investment decisions.
Part 2 How to Draw Accurate Support and Resistance LevelsParticipants in Option Trading
There are four primary participants in the options market:
Buyer of Call Option (Long Call) – Expects the price to rise.
Seller of Call Option (Short Call) – Expects the price to fall or remain flat.
Buyer of Put Option (Long Put) – Expects the price to fall.
Seller of Put Option (Short Put) – Expects the price to rise or remain flat.
Each participant has a specific risk-reward profile. Option buyers have limited risk (the premium paid) and unlimited profit potential. Option sellers, on the other hand, have limited profit (premium received) but potentially unlimited risk.

Part 1 How to Draw Accurate Support and Resistance LevelsThe Key Components of an Option Contract
Underlying Asset:
The financial instrument (e.g., stock or index) on which the option is based.
Strike Price:
The price at which the holder of the option can buy (for calls) or sell (for puts) the underlying asset.
Expiry Date:
The date on which the option contract expires. In India, options can be weekly or monthly.
Premium:
The price the buyer pays to purchase the option contract from the seller (also known as the writer). This premium is non-refundable.
Lot Size:
Each option contract represents a fixed quantity of the underlying. For example, one NIFTY option lot equals 50 units, while one BANK NIFTY option equals 15 units.

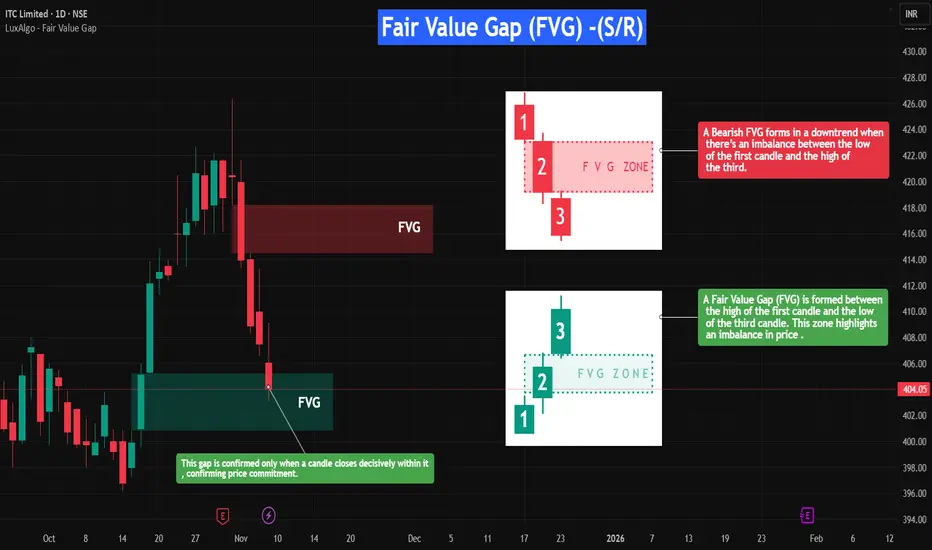
Fair Value Gap (FVG) — Support and Resistance (S/R)🔎 Overview
The Fair Value Gap (FVG) is a unique price imbalance or inefficiency on a price chart where the market rapidly moves, leaving one or more candles without overlapping wicks between highs and lows.
This signifies aggressive buying or selling, resulting in a “gap” of untraded prices.
Once spotted, FVGs often act as magnets, drawing price back to fill the gap — and later serve as dynamic support or resistance zones, depending on the market direction.
⸻⸻⸻⸻⸻⸻⸻⸻⸻⸻
📔 Concept
A Fair Value Gap forms when:
1️⃣ Resistance FVG -- A strong impulsive move causes the low of the first candle and the high of the third candle (in a three-candle sequence) to fail to overlap, leaving a visible gap.
2️⃣ Support FVG -- A strong impulsive move causes the high of the first candle and the low of the third candle (in a three-candle sequence) to fail to overlap, leaving a visible gap.
3️⃣ Imbalance -- This gap highlights an area where orders were skipped, signaling an imbalance between buyers and sellers.
4️⃣ Rebalance -- When revisited, a Bullish FVG often acts as support, while a Bearish FVG acts as resistance, as price reacts to rebalance the inefficiency before the trend continues.
⸻⸻⸻⸻⸻⸻⸻⸻⸻⸻
📌 How to Use
✅ Validation → A valid FVG exists as long as the gap remains unfilled, and traders watch for price to revisit and react to it.
🟩 Bullish FVG → Support: When price retraces into the gap and finds buying interest, the zone holds as support.
🔴 Bearish FVG → Resistance: When price rallies into a bearish gap and faces rejection, the zone holds as resistance.
❌ Devalidation → If price decisively closes inside the FVG, the gap is considered “filled,” and the setup loses significance.
Typically, the lowest unfilled bullish FVG below price in an uptrend (and the highest bearish FVG above in a downtrend) carries more weight and is prioritized for confluence.
⸻⸻⸻⸻⸻⸻⸻⸻⸻⸻
📊 Chart Explanation
Symbol → NSE:ITC
Timeframe → 1D
On the right-hand side, the Fair Value Gaps (FVGs) are illustrated in detail to give a closer look at how they form and function.
These visual examples explain how FVGs represent price inefficiencies — zones that later act as dynamic support or resistance once price revisits them.
On the left-hand side, you can see real-time examples of FVGs forming within live price action.
When a candle closes decisively inside a bullish FVG, it confirms price commitment, allowing the zone to act as support and potentially propel price upward.(These are plotted using open sourced indicator )
This setup beautifully demonstrates how understanding FVG structure helps identify high-probability reaction zones where the market seeks to rebalance itself.
⸻⸻⸻⸻⸻⸻⸻⸻⸻⸻
👀 Observation
Fair Value Gaps work best in volatile markets or during strong impulsive moves.
When price revisits an unfilled gap, the reaction helps define new support or resistance.
Combining FVGs with key structural levels, volume analysis, or momentum indicators (like RSI or Moving Averages) improves reliability.
Always prioritize clean, unfilled gaps aligned with the trend direction for higher conviction.
⸻⸻⸻⸻⸻⸻⸻⸻⸻⸻
💡 Conclusion
The Fair Value Gap not only signals where the market may “rebalance” itself after price inefficiencies but also identifies potential support and resistance zones.
Recognizing how bullish and bearish FVGs interact with price allows traders to anticipate reactions, manage risk, and refine entries and targets with greater accuracy.
⸻⸻⸻⸻⸻⸻⸻⸻⸻⸻
⚠️ Disclaimer
📘 For educational purposes only.
🙅 Not SEBI registered.
❌ Not a buy/sell recommendation.
🧠 Purely a learning resource.
📊 Not Financial Advice.
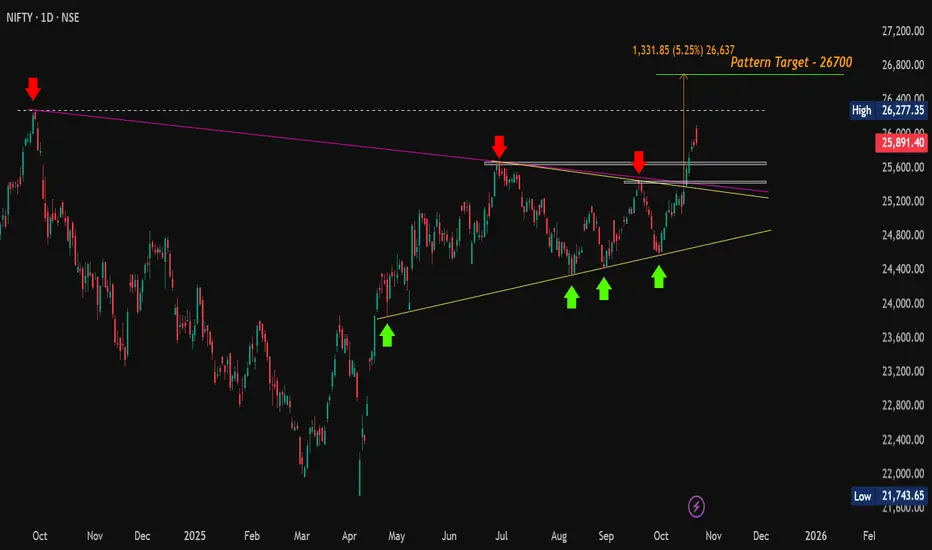
#Nifty | Breakout Confirmed, Now Eyes on Support for Next Move#Nifty Update (Daily):
CMP: 25,891.40
Following our previous update at 25,285, Nifty has decisively broken out above the Symmetrical Triangle pattern and surged to a high of 26,104 today. Price action formed a bearish candle but managed to close positively on the daily chart.
🔄 What to expect next?
A potential retest of breakout levels is likely as profit booking is expected after a strong rally of over 1,500 points from the swing low. Watch the key support zones closely for a possible bounce.
🔽 Support Zones to watch :
25,669 - 25,638
25,449 - 25,424
⚡️ If Nifty holds these levels and reverses, it could set the stage for a renewed upmove aimed at surpassing the all-time high (ATH) at 26,277.
🔼 Resistance Zones to watch :
26,104 (recent high)
26,216 - 26,277 (ATH)
📈 A sustained break above the ATH will confirm continuation toward the symmetrical triangle’s ultimate target near 26,700 .
#Nifty | #Nifty50 | #BreakOutRetest | #SymmetricalTriangle | #ChartPatterns | #SwingTrading | #PriceAction
📌 Disclaimer: This analysis is shared for educational purposes only. It is not a buy/sell recommendation. Please do your own research before making any trading decisions.
Simple Support & Resistance Strategy on XAUUSDThis chart illustrates a simple but effective support and resistance trading approach.
Support Levels:
Support 1: Acts as a key demand zone where buyers may step in if price revisits this area.
Support 2: A minor intraday support that can provide short-term bounce opportunities.
Resistance Levels:
Resistance 1: The broader supply zone where sellers previously pushed price lower.
Resistance 2: A closer level that may act as a barrier for short-term upward moves.
What’s Happening:
Currently, price has broken below Support 2 and is testing downward momentum. Two possible scenarios are highlighted:
Price retests Support 1, holds, and then bounces back toward Resistance 2.
Price fails to hold at Support 1, leading to further downside continuation.
Probability Outlook:
If buyers defend Support 1 strongly, probability favors a bounce toward Resistance 2.
If Support 1 breaks with volume, probability favors a bearish continuation move to lower levels.
This setup shows how simple zone-to-zone trading can provide clear potential paths without overcomplication.
👉 Always remember: This is not financial advice, but an educational demonstration of support/resistance principles.

APOLLOHOSP - TECHNICAL ANALYSIS________________________________________________________________________________
📈 Apollo Hospitals Enterprises Ltd. (APOLLOHOSP) – TECHNICAL ANALYSIS
📆 Date: June 28, 2025 | Timeframe: Daily Chart
🔍 For Educational Purposes Only
________________________________________________________________________________
📊 Structure Overview
• Pattern: Rounded "W" Base Breakout
• Breakout Level: ₹7,324
• Current Price: ₹7,308.50 (pullback after breakout)
• Volume: 523.58K vs avg. 456.66K – confirming breakout strength
• Trend Bias: Bullish (as long as price sustains above ₹7,176–₹7,043)
________________________________________________________________________________
📌 Key Zones
🔺 Top Range Resistance: ₹7,545.35
📛 Possible Supply Zone: ₹7,545.35–₹7,345.20 | SL: ₹7,553.15
🟧 Consolidation Zone: ₹6,750–₹7,300
🟩 Demand Support: ₹7,176 / ₹7,043 / ₹6,969
🔻 Bottom Support Range: ₹6,001 (long-term demand base)
Resistance Levels:
• ₹7,382.5
• ₹7,456.5
• ₹7,589.0
Support Levels:
• ₹7,176.0
• ₹7,043.5
• ₹6,969.5
________________________________________________________________________________
🧠 Technical Signals
✔️ Rounded W pattern breakout
✔️ Bollinger Band expansion (BB Squeeze OFF)
✔️ RSI around 62 – showing strength
✔️ SuperTrend & VWAP supportive during breakout
✔️ Sectoral tailwind: Hospitals gaining traction in current market narrative
________________________________________________________________________________
🎯 STWP Educational Trade Plan (For Study Only)
• Entry (Breakout Retest): ₹7,324
• Stop Loss: ₹6,989
• Risk: ₹335/share
• Position Size: 50 shares
• Risk-Reward Ratio: 1:1 | 1:2+
📌 Setup Logic: Volume-backed W Breakout + Consolidation Range Break + Sector Strength
________________________________________________________________________________
⚠️ Cautionary Notes
• Breakdown below ₹7,043 = weakening structure
• If price gets rejected at ₹7,456, sideways action likely
• Always track volume + RSI for divergence signs
________________________________________________________________________________
📢 Disclaimer
This is a study-based chart analysis shared for educational purposes only. It is not a buy/sell recommendation. The author is not SEBI-registered. Please consult a SEBI-registered advisor before making any investment decisions.
________________________________________________________________________________
💬 Your Turn:
Do you think ₹7,545 will break or will price revisit ₹7,000 first?
👇 Drop your view or chart in the comments — let’s grow together!
________________________________________________________________________________
STWP | Learn. Trade. Grow.
________________________________________________________________________________
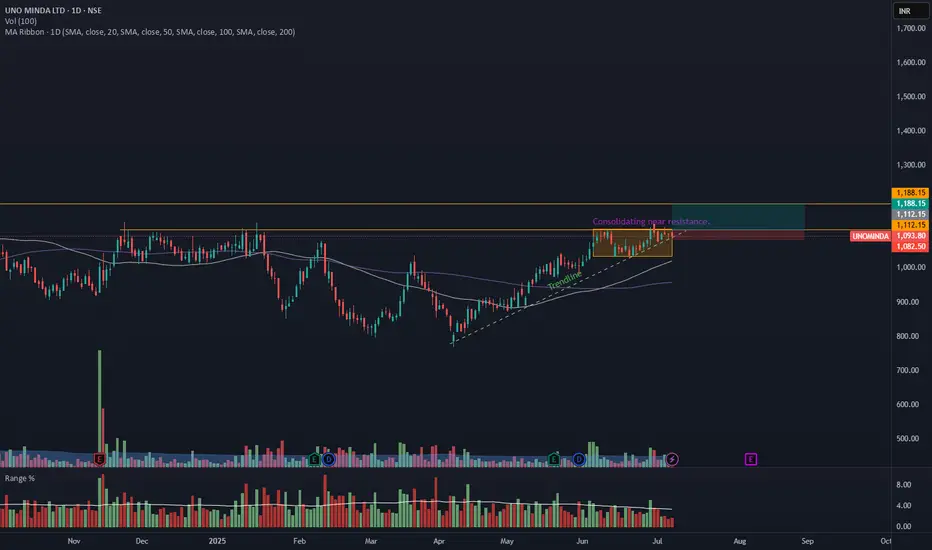
UNOMINDA – Daily Timeframe Breakout Idea (Resistance Zone Break)UNO MINDA LTD. has shown a breakout above a key horizontal resistance level on the daily chart, accompanied by a nearly 1.5 times volume surge near the breakout, as seen earlier, supported by strong momentum.
🔍 Breakout Context:
- Price might break above the ~₹1110 horizontal resistance, which had held for over 6 months.
- Breakout supported by more than average volume and just above average range near the resistance zone.
- The price is also trading above both the 50- and 100-day SMAs, indicating strong trend continuation.
- This aligns with a bullish continuation setup.
📉 Trade Plan:
- CMP: ₹1093
- Entry: Near ₹1112
- Target: ₹1188 (~7% upside from CMP)
- Stop-Loss: ₹1082
- Risk-Reward Ratio: ~1 : 2.0
📌 Note:
- Look for a confirmation candle to enter the trade.
- Avoid chasing the extended move unless confident in intraday momentum.
⚠️ Disclaimer: This post is for educational purposes only and not financial advice. Always do your research or consult a financial advisor before trading.
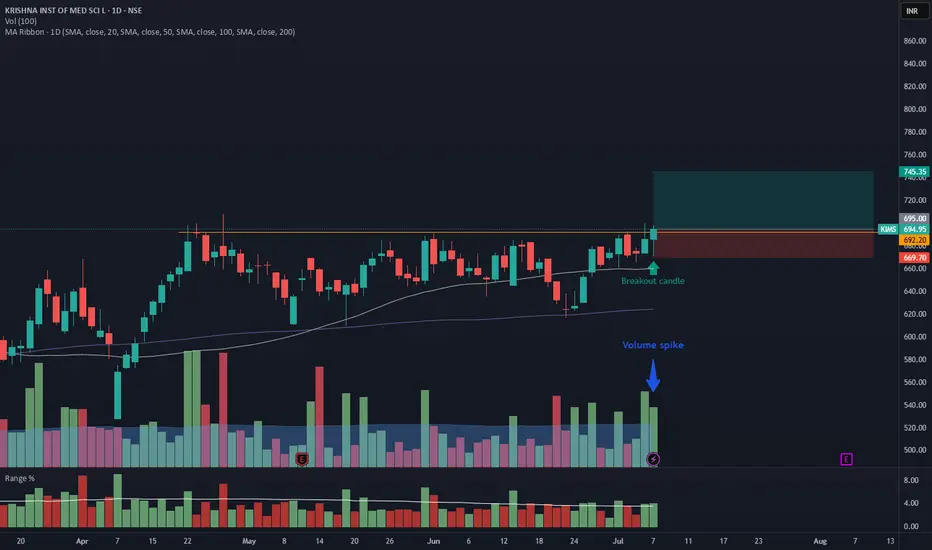
KIMS – Daily Timeframe Breakout Idea (Resistance Zone Break)
KRISHNA INSTITUTE OF MEDICAL SCIENCE has shown a breakout above a key horizontal resistance on the daily chart, accompanied by a ~2x volume surge, supported by strong momentum.
🔍 Breakout Context:
- Price broke above the ~692.20 horizontal resistance, which had held for over 2 months.
- Breakout supported by <2x average volume and just above average range on the breakout candle.
- The price is also trading above both the 50- and 100-day SMAs, indicating strong trend continuation.
- This aligns with a bullish continuation setup.
📉 Trade Plan:
- CMP: ₹694
- Entry: Near ₹695
- Target: ₹746 (~7.25% upside from CMP)
- Stop-Loss: ₹669
- Risk-Reward Ratio: ~1 : 2.0
📌 Note:
- Avoid chasing the extended move unless confident in intraday momentum.
⚠️ Disclaimer: This post is for educational purposes only and not financial advice. Always do your research or consult a financial advisor before trading.
TRENT LTD – INTRADAY ZONE ANALYSIS________________________________________________________________________________
📈 TRENT LTD – INTRADAY ZONE ANALYSIS
📆 Date: July 1, 2025 | ⏱ Timeframe: 15-Minute Chart
🔍 Educational Analysis for Learning Purposes Only
________________________________________________________________________________
📊 Zone Breakdown:
• 🔴 Top Range Resistance – 6,261
Marked in Red: This is a key supply zone where the price has previously stalled. Traders should watch for bearish reversal candlestick patterns like a bearish engulfing, evening star, or long upper wick rejection. A lack of follow-through volume here may indicate exhaustion.
• 🟠 Neutral Zone – Avoid Trade Area (6,155 – 6,210)
Marked in Orange: Price tends to be indecisive here. This is a “no trade zone” unless supported by a strong trend direction and setup. Historically, it has shown sideways movement and choppy behaviour.
• 🟢 Demand Zone – 6,105 to 6,066.50 | SL: 6,058.10
Marked in Green: Price reacted sharply from this zone with rising volume. A bullish engulfing candle confirmed demand here. Ideal for watching pullback opportunities on re-tests, supported by bullish confirmation candles.
• 🟩 Bottom Support – 5,968
A strong base level. A breakdown below this zone may signal a shift in short-term structure. Look for volume spike and wide-bodied red candle for bearish confirmation.
________________________________________________________________________________
🔍 Candlestick Observation:
At the Top Resistance Zone (6261), recent candles show upper wicks and indecision, but no strong bearish reversal yet. Volume is elevated, signaling activity, but candles show hesitation.
🧠 Interpretation: This could be an early sign of supply pressure. A follow-up bearish engulfing or strong rejection candle may validate a reversal. Until then, price may consolidate within the zone.
________________________________________________________________________________
⚙️ Educational Trade Ideas (Study Purpose Only)
▶️ Reversal Setup – Bearish Bias
• Entry: Below ₹6,190 on confirmation candle from resistance zone
• Stop Loss: Above ₹6,265
• Risk-Reward: 1:1 | 1:2 +
• 🧠 Ideal for learning how price reacts to supply after a sharp rally
________________________________________________________________________________
▶️ Pullback Setup – Bullish Bias
• Entry: Near ₹6,100–₹6,110 on bullish confirmation from demand zone
• Stop Loss: ₹6,058
• Risk-Reward: 1:1 | 1:2 +
• 🧠 A classic “Breakout–Retest–Continuation” setup with proper risk management
________________________________________________________________________________
⚠️ Disclaimer (SEBI-Compliant):
This content is shared strictly for educational and informational purposes only. It does not constitute investment advice or a trading recommendation. Always consult a SEBI-registered financial advisor before making investment decisions.
STWP | Learn. Trade. Grow.
________________________________________________________________________________
💬 What do you think about this TRENT setup?
Did you observe any volume divergence or trendline reaction?
👇 Drop your insights in the comments — let’s grow together!
________________________________________________________________________________
Bonus:

BLUE STAR LTD. – TECHNICAL ANALYSIS📈 BLUE STAR LTD. – TECHNICAL ANALYSIS
📆 Date: July 1, 2025 | ⏱ Timeframe: Daily Chart
🔍 Educational Breakdown – For Learning & Study Use Only
________________________________________________________________________________
🔹 Price Action Zones
• 🔴 Top Range (Resistance): 2417
• 🟢 Bottom Range (Support): 1521
________________________________________________________________________________
🔹 Chart Pattern: ✅
Rectangle/Box Consolidation Breakout – Price was range-bound in a tight zone and has given a strong breakout on high volume, indicating bullish intent.
________________________________________________________________________________
🔹 Reversal Candlestick Patterns
• Top Range (2417): ⛔ No recent candlestick activity visible at the top range.
• Bottom Range (1521): Todays Candle
✅ Bullish Engulfing + Strong Bullish Candle
✅ RSI Bounce + Volume Spike
✅ Confirmed by Price Action and Momentum Indicators
________________________________________________________________________________
📊 Trade Plan (Based on Reason and Logic)
🔼 Bullish Trade Setup:
• Entry: 1715 (Breakout Candle Close)
• Stop Loss: 1614.45 (Below consolidation and bullish candle)
• Target 1: 1850
• Target 2: 1980
• Reason:
o Strong breakout with above-average volume
o Multiple confirmations (RSI, Bollinger Band, Supertrend)
o Box breakout with previous supply cleared
________________________________________________________________________________
🔽 Bearish Trade Setup:
• If price fails to sustain above 1715 and closes back below 1680 zone
• Entry: Below 1665 (Fakeout confirmation)
• SL: Above 1715
• Target: 1615 / 1550
• Reason: Potential failed breakout & liquidity trap
________________________________________________________________________________
📌 Disclaimer
This analysis is shared for educational and study purposes only. It does not constitute investment advice. The author is not SEBI-registered. Please consult a SEBI-registered advisor before making trading decisions. Always use proper risk management and trade only with confirmation.
________________________________________________________________________________
💬 Comments
What’s your view on Britannia?
Drop your thoughts and chart setups
________________________________________________________________________________

BHARAT FORGE LTD. – INTRADAY ZONE ANALYSIS________________________________________________________________________________
📈 BHARAT FORGE LTD. – INTRADAY ZONE ANALYSIS
📆 Date: July 1, 2025 | ⏱ Timeframe: 15-Minute Chart
🔍 Educational Breakdown – For Learning & Study Use Only
________________________________________________________________________________
🔹 Price Action Zones
🔴 Top Range(Resistance): 1324.50
🟢 Bottom Range(Support): ₹1270
⚪ No Trade Zone: Mid-range, no clear directional bias
________________________________________________________________________________
🧩 Chart Pattern: No
There is no visible or marked chart pattern (e.g., flag, triangle, head and shoulders) on the chart.
________________________________________________________________________________
🔁 Reversal Candlestick Patterns:
🔴 Top Range: No visible reversal candle pattern at the supply zone on this chart snapshot, but the area has been marked for potential rejection.
🟢 Bottom Range: No textbook reversal candlestick (like pin bar, hammer, or engulfing) is clearly visible at ₹1270. However, the price bounced strongly from this level, indicating possible short-term support or buyer interest.
________________________________________________________________________________
🧠 1. Trade Plan (Based on Reason and Logic)
🔼 Bullish Trade:
Idea: If price retests ₹1270 and forms a bullish structure (strong bullish candle, reversal candles, volume support, long wick)
Stop Loss: Below ₹1269
Risk-Reward: 1:1 | 1:2+
Logic: you need to give an actual logic to this
________________________________________________________________________________
🔽 Bearish Trade:
Idea: If price rejects 1324.50 and forms a bearish structure (strong bearish candle, reversal candles, volume support, long wick)
Stop Loss: ₹1325
Risk-Reward: 1:1 | 1:2+
Logic: Historically rejected area as marked on chart.
________________________________________________________________________________
📦 2. Trade Plan Based on Demand/Supply Zones
🟥 Supply Zone Trade:
Zone: ₹1293.30 – ₹1299.90
SL: ₹1301.45
Plan: Trade the Supply Zone (only on rejection confirmation)
Risk-Reward: 1:1 | 1:2+
🟩 Demand Zone: No defined demand zone.
________________________________________________________________________________
📌 Disclaimer
This analysis is shared for educational and study purposes only. It does not constitute investment advice. The author is not SEBI-registered. Please consult a SEBI-registered advisor before making trading decisions. Always use proper risk management and trade only with confirmation.
________________________________________________________________________________
💬 Comments
What’s your view on Bharat Forge?
Will it reject from the supply zone or hold the bottom range?
Share your charts or thoughts below 👇
________________________________________________________________________________

SIEMENS LTD. – INTRADAY ZONE ANALYSIS________________________________________
📈 SIEMENS LTD. – INTRADAY ZONE ANALYSIS
📆 Date: July 1, 2025 | ⏱ Timeframe: 15-Minute Chart
🔍 Educational Analysis for Learning Purposes Only
________________________________________
📊 Zone Breakdown:
• 🔴 Top Range Resistance – 3,271.90
Marked in Red: This is a clearly defined supply zone where the price faced sharp rejection after testing highs. Bearish opportunity zone if a reversal pattern appears — watch for signs like bearish engulfing, double top, or rising volume + long upper wicks.
• 🟠 No Trade Zone – Around 3,225–3,260
Marked in Orange: This range has seen volatile, choppy action without clear bias. Traders may avoid fresh positions here unless directional strength emerges with volume confirmation.
• 🟢 Demand Zone – 3,182.60 to 3,165 | SL: 3,160.35
Marked in Green: Price reversed sharply from this area in the past with strong bullish candles. Acts as a low-risk buying area on retest with bullish confirmation. Risk-managed entries possible here.
• 🟩 Bottom Support – 3,101.10
Marked in Dark Green: Crucial structural support zone. Breakdown below this level could change the short-term trend to bearish. Currently a “last line of defense” for bulls.
________________________________________
🔍 Candlestick & Chart Pattern Observation:
✅ Bearish Rejection Near Top Zone:
A strong upper rejection candle (long wick) appeared right at the top resistance (3,271.90), followed by consistent lower highs and lower closes. This confirms seller presence. No double top yet, but early signs of a potential short-term top formation are visible.
✅ Bullish Reversal from Demand Zone:
The candle near 3,170 zone shows a sharp bullish engulfing move on higher volume — signaling potential institutional interest. This zone has repeatedly offered bounce opportunities.
📉 Volume Clue:
Volume expanded during the bounce from demand zone and tapered near resistance — confirming participation during dips and caution near highs.
________________________________________
⚙️ Educational Trade Ideas (Study Purpose Only)
▶️ Reversal Setup – Bearish Bias
• Entry: Below 3,245 on bearish continuation candle
• Stop Loss: Above 3,272 (Top Range)
• Risk-Reward: 1:1 | 1:2+
________________________________________
🧠 Ideal for studying exhaustion after a resistance test and confirmation through lower highs.
▶️ Pullback Setup – Bullish Bias
• Entry: Between 3,170–3,182 (Demand Zone)
• Stop Loss: 3,160.35
• Risk-Reward: 1:1 | 1:2+
🧠 Classic demand zone bounce setup. Strong volume + engulfing candle supports bullish case.
________________________________________
⚠️ Disclaimer (SEBI-Compliant):
This content is strictly for educational and informational purposes. It is not investment advice or a recommendation to buy/sell any securities. Always consult a SEBI-registered financial advisor before making any financial decisions.
STWP | Learn. Trade. Grow.
________________________________________
💬 Do you think the top is strong enough for a short? Or will bulls take control at demand again?
Drop your thoughts and analysis below ⬇️
________________________________________

ASIAN PAINTS LTD. – INTRADAY ZONE ANALYSIS________________________________________________________________________________
📈 ASIAN PAINTS LTD. – INTRADAY ZONE ANALYSIS
📆 Date: June 29, 2025 | ⏱ Timeframe: 15-Minute Chart
🔍 Educational Analysis for Learning Purposes Only
________________________________________________________________________________
📊 Zone Breakdown:
• 🔴 Top Range Resistance – 2,364.50
Marked in Red: This is a potential supply zone, where price may face resistance after a strong move up. Ideal for observing bearish reversal patterns like a shooting star, bearish engulfing, or a doji — especially if volume drops or candles show exhaustion.
• 🟠 Neutral Zone – Avoid Trade Area (2,320–2,340)
Marked in Orange: Historically indecisive. Avoid trades here as price often moves sideways or with false breakouts.
• 🟢 Demand Zone – 2,302.90 to 2,293.70 | SL: 2,292
Marked in Green: Price broke out with strong volume from this area. A retest may offer bullish pullback opportunities with proper confirmation candles.
• 🟩 Bottom Support – 2,275.40
Important base level. Breakdown below this zone may change overall short-term bias.
________________________________________________________________________________
🔍 Candlestick Observation:
At the resistance zone, the last candle shows slight upper rejection and reduced body size.
🧠 Interpretation: A possible early signal of exhaustion. Traders can watch for confirmation via volume drop or follow-up bearish candle for a short bias — or wait for breakout strength for long continuation.
________________________________________________________________________________
⚙️ Educational Trade Ideas (Study Purpose Only)
▶️ Reversal Setup – Bearish Bias
• Entry: Below ₹2,358 on bearish candle confirmation
• Stop Loss: Above ₹2,365
• Risk-Reward: 1:1 | 1:2+
• 🧠 Ideal for studying price rejection after a rally into resistance
________________________________________________________________________________
▶️ Pullback Setup – Bullish Bias
• Entry: Near ₹2,300 with bullish confirmation at demand zone
• Stop Loss: ₹2,292
• Risk-Reward: 1:1 | 1:2+
• 🧠 Useful example of “breakout → retest → continuation” pattern
________________________________________________________________________________⚠️ Disclaimer (SEBI-Compliant):
This content is shared strictly for educational and informational purposes. It is not investment advice or a trading recommendation. Please consult a SEBI-registered financial advisor before taking any investment decisions.
STWP | Learn. Trade. Grow.
________________________________________________________________________________
💬 What do you think about this setup?
Did you observe any other key patterns or zones?
👇 Drop your thoughts in the comments — let’s grow together!
________________________________________________________________________________

Bullish Breakout in VIP Industries 🔍 Chart Overview:
Breakout above resistance zone at ₹420
Strong volume spike confirming buying interest
Price action broke out of a consolidation channel
Formed a bullish flag/pennant pattern before breakout
🔧 Technical Indicators:
RSI moving above 60 → bullish momentum building
MACD crossover near zero line → fresh upward signal
50 EMA support intact, stock trading above all major EMAs

BEPL | Yet another good monthly candle at excellent areaBEPL | Yet another good monthly candle
Excellent area of value at this location
Breakout after 7 years consolidation and retesting
High probable setup for doubling
CMP : 119

SOBHA | Breakout after consolidation + 200 EMA supportSOBHA | Breakout after consolidation + 200 EMA support
CMP : 1433 (Dip : 1300)
SL : 1200
Target : 2000

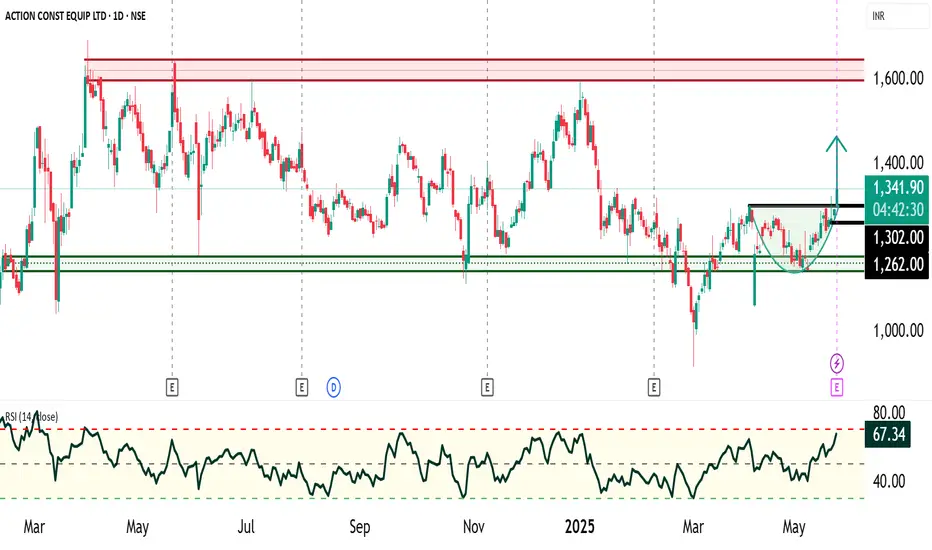
ACE Construction Ltd : Rounding Bottom Chart PatternACE Construction Ltd has been consolidating in a broad sideways range between ₹1,150 to ₹1,600 since February 2024. The price action has clearly defined support and resistance levels, with ₹1,150–₹1,200 acting as a strong accumulation zone and ₹1,550–₹1,600 serving as a firm resistance, where selling pressure consistently emerges.
Technical Pattern Observed (Hourly Timeframe): A Rounding Bottom pattern has been identified on the hourly chart, which is a bullish reversal pattern, indicating a shift from bearish to bullish sentiment.
Neckline Breakout Level: ₹1,300 (confirmed)
Breakout Confirmation: Price closed above neckline with volume support
Target Estimation (Measurement Rule):
Target 1: ₹1,450
Target 2 (Final): ₹1,550
Stop Loss: ₹1,260 (last swing high before breakout, risk-managed level)
Momentum & Trend Indicators:
Multi-EMA Bullish Crossover: Multiple exponential moving averages have aligned in a bullish formation, signaling trend continuation.
Relative Strength Index (RSI): Currently above 60, reflecting strengthening momentum and buyer dominance.
Fundamental Context: ACE Construction Ltd remains **fundamentally strong** with robust financials and growth visibility. The current price level provides an **attractive valuation**, further supporting the bullish technical setup.
Conclusion: The current technical setup presents a high-probability bullish opportunity in ACE Construction Ltd. The completion and breakout of the rounding bottom pattern, supported by bullish momentum indicators and favorable valuation, make a strong case for upward price movement towards ₹1,450–₹1,550 in the near term.