Nifty Neowave CyclesHello Everyone,
Welcome to Trading Idea, here are the details-
# wave 2 is making an flat structure, will activate once we 19868 high
# 19230 area will work as a support.
# for more clarity short term cycles chart will help
i will update the intraday chart when the times comes.
Supportandresitance

Expected Trend CyclesHello Everyone
This is our long term view chart and this is our view.
Notes
# Expect price to move up in upcoming week (1or 2) in form of wave (5) { our medium term cycle}
# After that you will see a correction in form of wave ((4)) {our long term cycle}
# Expect price to move up in form of wave(5)
Note- This is our general view , activation level will be given when the pattern completed because littile bit of forecast changes as price progress.

Bank Nifty 27.07.23BankNifty important intraday levels to watch for 27-07-2023
#Support: 46155
Long if candle closes above 46255.
Target 1 : 46370
#resistance: 46370
Sell below candle closes below 46155
Target 1 : 46000
Remember each level will act as a support and resistance individually

BHARTIARTL : Reversing from SMA20NSE:BHARTIARTL is reversing from SMA20 support after 6 days of selling pressure.

NIFTY50 Analysis! NSE:NIFTY Weekly Analysis!
NIFTY50 Long term Analysis!
Nifty is currently trading at its resistance levels. I have marked all the essential levels on the chart, please go through it.
Resistance Level = 18876.90
Support 1 = 18609
Support 2 = 18370.85
Disclaimer = All my analysis is for Educational Purposes only. Before entering into any trade - 1) Educate Yourself 2) Do your own research and analysis 3) Define your Risk to Reward ratio 4) Don't trade with full capital

Banknifty ( This week contract )Banknifty ( This week contract )
More probability is there for " 45250 "
.
For " long "
entry:45120
target: 45250/ 45450
stoploss: 44850
.
" BEARISH " only if market Breaks "
" Yellow box" mentioned.
.
.
don't be aggressive.
.
refer old ideas attached below.

Reliance - Classic morning star pattern formationReliance Industries Ltd is trading in a price range of 2200 - 2800 since Sep 2021.
In between this a strong support and resistance formed where 2200 act as a support and 2800 as a resistance.
Last week a bullish candlestick pattern formed in Reliance called Classic Morning Star at support level.
Here are the characteristics of a classic Morning Star pattern:
1. The first candle is a long bearish candlestick, indicating that the bears are in control of the market.
2. The second candle is a short candlestick that gaps down from the previous day's close. This candlestick is also known as a "Doji" and represents indecision in the market.
3. The third candle is a long bullish candlestick that gaps up from the previous day's close. This candlestick represents a shift in momentum from the bears to the bulls.
Morning star candlestick with inverted hammer at support level indicating a lot more.

Banknifty ( Next week contract )Banknifty ( 13/07/2023 )
.
For " long "
entry: 4250
target: 45500
stoploss: 45000
.
For " Short"
entry: 49950
target: 44750 / 44500
stoploss: 45250
.
enter only if market Breaks " S & R Zone "
.
wait for proper reversal and conformation.
.
don't be aggressive.
.
refer old ideas attached below.

Breakout in Hindustan Unilever Hindustan Unilever has given a breakout with increased volume after a long period. RSI is also above 60 showing strength. Can add this for short term gain as nifty is trading at all time high with a strict SL.
CMP - 2755
Target 1 - 2890
Target 2 - 3030
SL - 2700 (2%)
Disclaimer : This is for educational purpose only. Take advice from your financial advisor before investing.

SOLAR INDUSTRIES 28/06/2023I analyze chart patterns, price-volume analysis, along with volume profile and avwap. Also check the momentum in daily and weekly charts. Finally make a risk-reward trade setup.

Kotak Bank Swing Trade SetupKotak Bank is currently approaching a crucial support zone on the daily timeframe chart. This presents a potentially good opportunity for a swing trade.
Entry:
For entry, it is recommended to go long on the open of the next candle.
Stoploss:
To minimize risk, a stop loss should be placed below the support zone, with some buffer to avoid stop loss hunting.
Target:
As for the target, it is advised to aim for the next resistance level as indicated on the chart.
Thank you for considering this analysis, and feel free to follow for more insights.

IS #VGUARD READY TO BREAK 5YEARS CONSOLIDATION??Trade Wisely. We Can Just Predict.
Disclaimer: I am not a SEBI registered advisor , so before entering on my view please ask your SEBI Registered Advisor . Profit is your and loss is your.
If you love my analysis Like And Share wherever you want..

BANKNIFTY ( 18.05.2023 )entry: 44200
.
if there is possibility for bullish--
target-44350--44500
.
.
If down trend starts
entry:44000
.
t1-43770--t2-43570
.
after breaking yellow box mentioned
trend will be confirmed.
.
.
more probability is there for bullish .
.
take trade only after conformation.

IS #JUSTDIAL READY FOR U TURN??Trade Wisely. We Can Just Predict.
Disclaimer: I am not a SEBI registered advisor , so before entering on my view please ask your SEBI Registered Advisor . Profit is your and loss is your.
If you love my analysis Like And Share wherever you want..

Ubl stock chart is at important level If anyone wants to enter at UBl this is the right time because it is trading at very important level.Its a positional call ,holding period is 3 months. But dont trade without risk managemant. Happy trading !

Gold fades upside momentum within rising wedgeGold price eyes the first weekly loss in three as it retreats inside a 15-week-old rising wedge. However, the 21-day EMA adds strength to the $2,008 support, a break of which will confirm the bearish chart pattern suggesting a theoretical fall toward $1,750. That said, the $2,000 psychological magnet will precede the multiple lows marked near $1,970 and February’s peak of around $1,960 to act as an intermediate halt ahead of the aforementioned theoretical target of the wedge. It should be noted that the year-to-date bottom of around $1,810 may offer an extra filter towards the south.
On the contrary, Gold price recovery may initially aim for $2,050 ahead of challenging the stated wedge’s top line surrounding $2,075. In a case where the XAUUSD bulls defy the bearish chart formation by crossing the $2,075 hurdle, the recently flashed all-time high of around $2,080 and the $2,100 will be in the spotlight.
Overall, the Gold buyers appear to run out of steam and the rising wedge teases the bears. However, the downside appears challenging and has multiple speed-breakers, including the mixed signals flashed by the RSI (14) line and MACD signals.

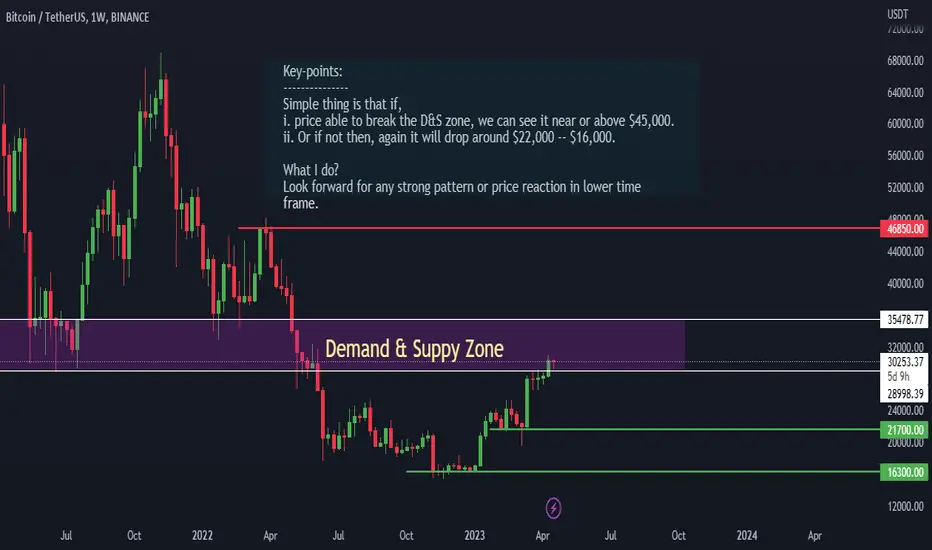
Is BITCOIN going to FALL again? All the key points, aspects, and probabilities are clearly mentioned on the Chart. Kindly do your own research before entering.
THANK YOU

WIPRO End of Fall ??!!Chart patterns insist me to go with above titled opinion
REASONS
1. In Monthly timeframe , WIPRO has been trading inside Ascending channel taking support and resistance (shown below)
2. Middle yellow trendline- Resistance turned Support looks favourable for the bounce.
3. Entry(safe) can be made after a good voluminous Breakout out of the white slanting trendline.
4. SL can the low of the Breakout candle.
As the stock has fell more than 50% , we can even wait for WEEKLY BREAKOUT and then enter upon retracement.
Will update as it moves!!!
Let's wait & watch , how it moves!!!!
NOTE- Just sharing my view...not a tip nor advice!!!

BANKNIFTY LEVELS 03/05/2023 BANKNIFTY ANALYSIS WITH LOGIC:
1. Considering today levels if there's flat opening or gap down price will move downward direction should break with strong candle below 43295 level then only, we will short up to 43065 level.
2. Consolidation may occur in between 43295 - 43450 level.
3. If there's gap up price may act more volatile and may break 43450 level with bullish candle during second half from that point, we can take long position up to 43600 level.
4. My act more vigorously after crossing 43600 level maintain strict stoploss while placing trades.
Have a safe and profitable day :)

base formation in infosys good for long 1. infy have made base formation at fib 0.5 levels
2. may retest of its breakdown
3. going long above its previous high 1270 with strict sl
4. R:R ===== 1:1
5. for big targets trailing sl should be done

A Comprehensive Analysis of Bitcoin Future Price MovementAll the key points, aspects, and probabilities are clearly mentioned on the Chart. Kindly do your own research before entering.
THANK YOU
lets understand support and resistance in detail support and resistance they play a truly crucial role in trading
If you want to trade like a pro, there's something you should know:
Support and resistance, they're the stars of the show!
this can be understood from the below:-
Support is like a floor, it holds prices up high,
Resistance is a ceiling, prices can't seem to fly.
When prices hit support, they tend to bounce back,
And when they reach resistance, they often lose track.
These levels are key, they're a trader's best friend,
They help you to enter, exit, and defend.
So pay attention to support and resistance, my friend,
They'll help you make profits and trade till the end!
volume confirmation along with breakouts are beautiful

BankNifty levels for the week 10 April 2023 - 14 April 2023Static levels analysis of BankNifty for ARPIL 10 to APRIL 14 2023
