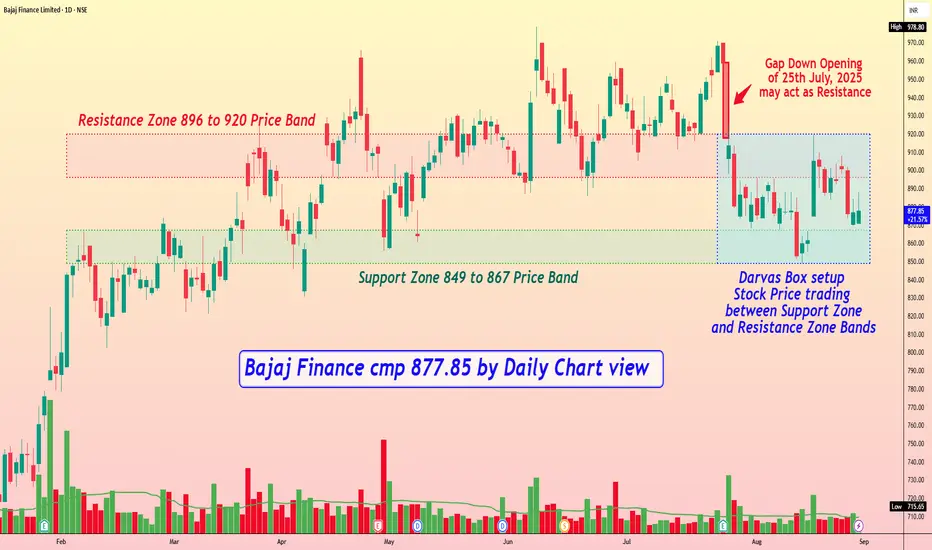
Bajaj Finance cmp 877.85 by Daily Chart viewBajaj Finance cmp 877.85 by Daily Chart view
- Support Zone 849 to 867 Price Band
- Resistance Zone 896 to 920 Price Band
- Gap Down Opening of 25th July, 2025 may act as Resistance
- Volumes in close sync with the average traded quantity over the past few days
- Darvas Box setup : Stock Price trading between Support Zone and Resistance Zone Bands
- Most of the Technical Indicators BB, EMA, MACD, RSI seem getting in the positive momentum
Supportresistancelevels
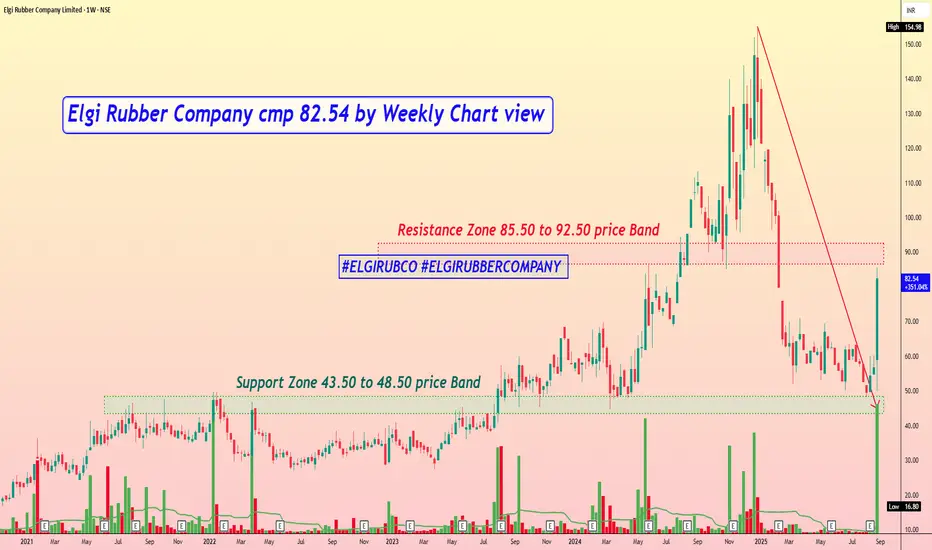
Elgi Rubber Company cmp 82.54 by Weekly Chart viewElgi Rubber Company cmp 82.54 by Weekly Chart view
- Support Zone 43.50 to 48.50 price Band
- Resistance Zone 85.50 to 92.50 price Band
- Price actively reversed from 4 years long past old Support Zone
- Heavy Volumes surged over the last week by demand based buying
- Falling Resistance Trendline Breakout sustained by bullish momentum
- Common Technical Indicators BB, EMA, MACD, RSI are trending positively
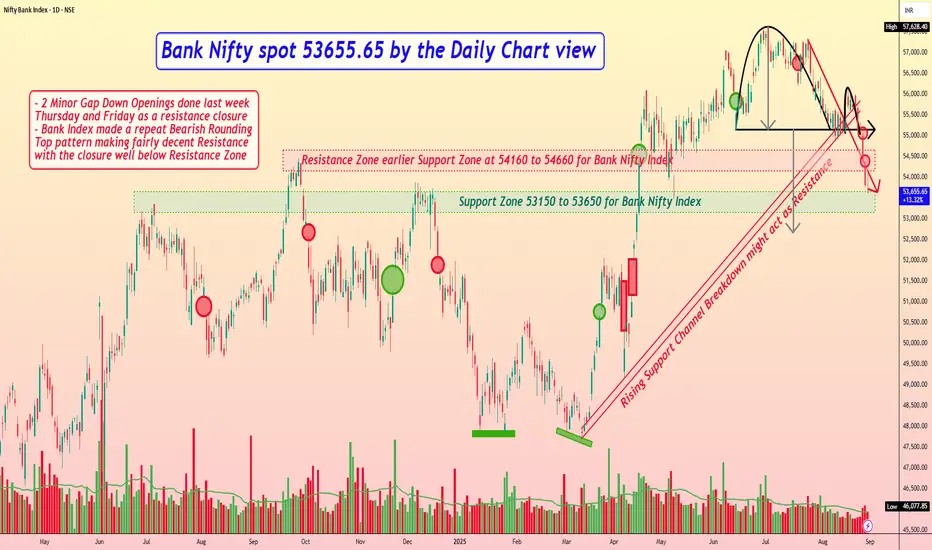
Bank Nifty spot 53655.65 by the Daily Chart view - Weekly updateBank Nifty spot 53655.65 by the Daily Chart view - Weekly update
- Support Zone 53150 to 53650 for Bank Nifty Index
- Rising Support Channel Breakdown might act as Resistance
- Resistance Zone earlier Support Zone at 54160 to 54660 for Bank Nifty Index
- Falling Resistance Trendline sustained by current Weekly closure below trendline
- 2 Minor Gap Down Openings done last week Thursday and Friday as a resistance closure
- Bank Index made a repeat Bearish Rounding Top pattern making fairly decent Resistance with the closure well below Resistance Zone
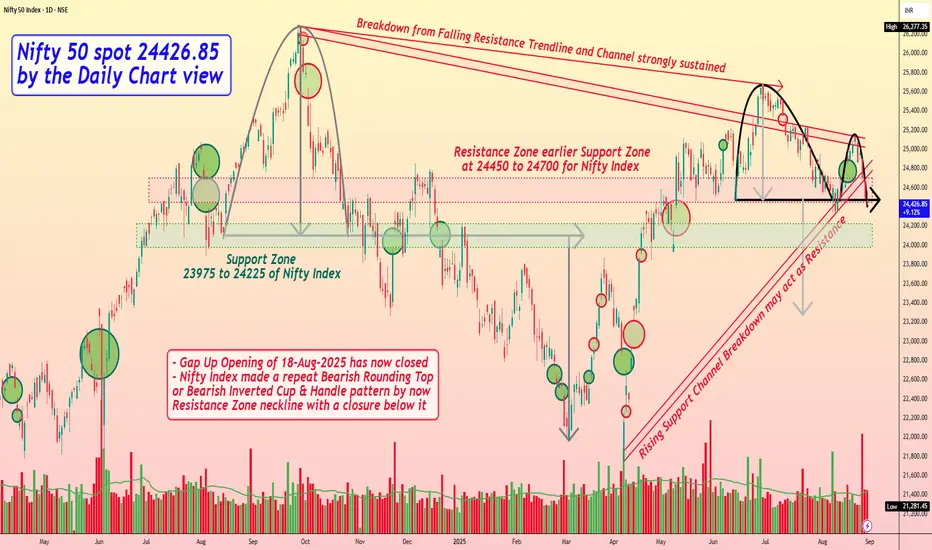
Nifty 50 spot 24426.85 by the Daily Chart view - Weekly updateNifty 50 spot 24426.85 by the Daily Chart view - Weekly update
- Support Zone 23975 to 24225 of Nifty Index
- Gap Up Opening of 18-Aug-2025 has now closed
- Resistance Zone earlier Support Zone at 24450 to 24700 for Nifty Index
- Rising Support Channel Breakdown may act as Resistance for upside move
- Breakdown from Falling Resistance Trendline and Channel has strongly sustained
- Nifty Index made a repeat Bearish Rounding Top or Bearish Inverted Cup & Handle pattern by now Resistance Zone neckline with a closure below it
Diffusion Engineers cmp 357.70 by Daily Chart view since listedDiffusion Engineers cmp 357.70 by Daily Chart view since listed
- Support Zone 325 to 345 Price Band
- Resistance Zone 365 to 385 Price Band
- Volumes are seen spiking above the average traded quantity
- Price trending and respecting the rising Rising Support Trendline
- Dotted Falling Resistance Trendline Breakout seems been attempted
- Multiple Bullish Rounding Bottoms rejected at Resistance Zone neckline
- Price reversed multiple times and backed out by strong Resistance Zone since listed
- Breakout above Falling Resistance Trendline from ATH level seems well sustained for now
- Price Breakout only possible by continued Volumes increase and few days closure above Resistance Zone

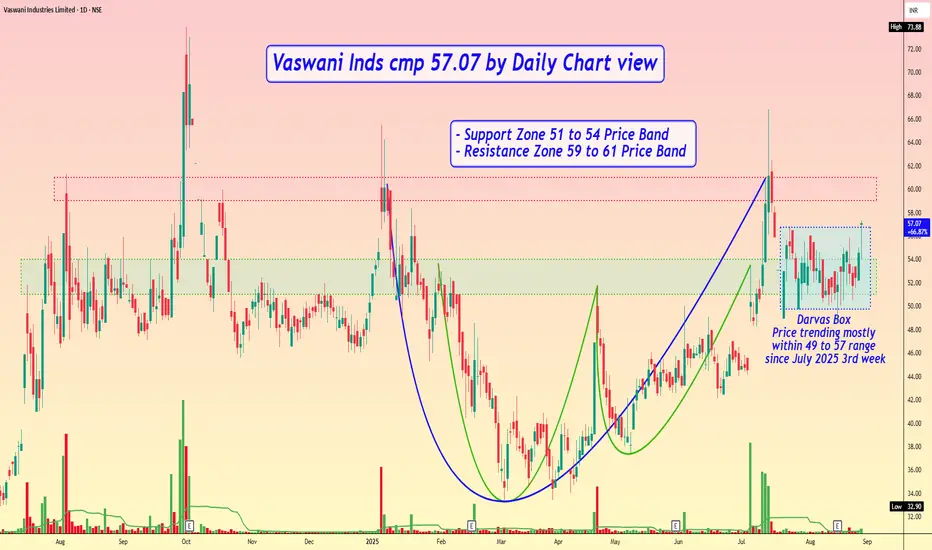
Vaswani Inds cmp 57.07 by Daily Chart viewVaswani Inds cmp 57.07 by Daily Chart view
- Support Zone 51 to 54 Price Band
- Resistance Zone 59 to 61 Price Band
- Volumes are in good sync with average traded quantity
- Bullish Rounding Bottoms made by Support Zone neckline
- Another Large Bullish Rounding Bottom made by Resistance Zone neckline
- Darvas Box - Price trending mostly within 49 to 57 range since July 2025 3rd week
Mphasis cmp 2917.70 by Daily Chart viewMphasis cmp 2917.70 by Daily Chart view
- Support Zone 2785 to 2845 Price Band
- Resistance Zone 2980 to 3045 Price Band
- Falling Resistance Trendline Breakout attempted
- Rising Support Trendline well respected by up-trending price
- Bullish Cup & Handle pattern done near the Resistance Zone neckline

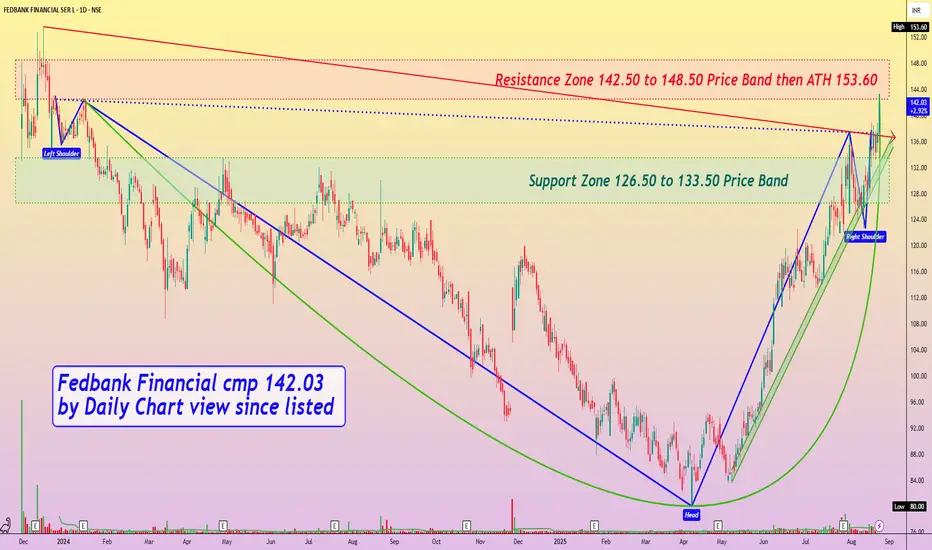
Fedbank Financial cmp 142.03 by Daily Chart view since listedFedbank Financial cmp 142.03 by Daily Chart view since listed
- Support Zone 126.50 to 133.50 Price Band
- Resistance Zone 142.50 to 148.50 Price Band then ATH 153.60
- Volumes seen to be in good close sync with the average traded quantity
- Rising Support Trendline Channel well respected by up-trending price momentum
- Falling Resistance Trendline Breakout seemingly might be retested prior to fresh uptrend
- Price testing retesting Support Zone over the last week for probable breakout beyond ATH 153.60
- Dual Bullish Technical patterns formed of Head & Shoulders and close to 18 month long Rounding Bottom
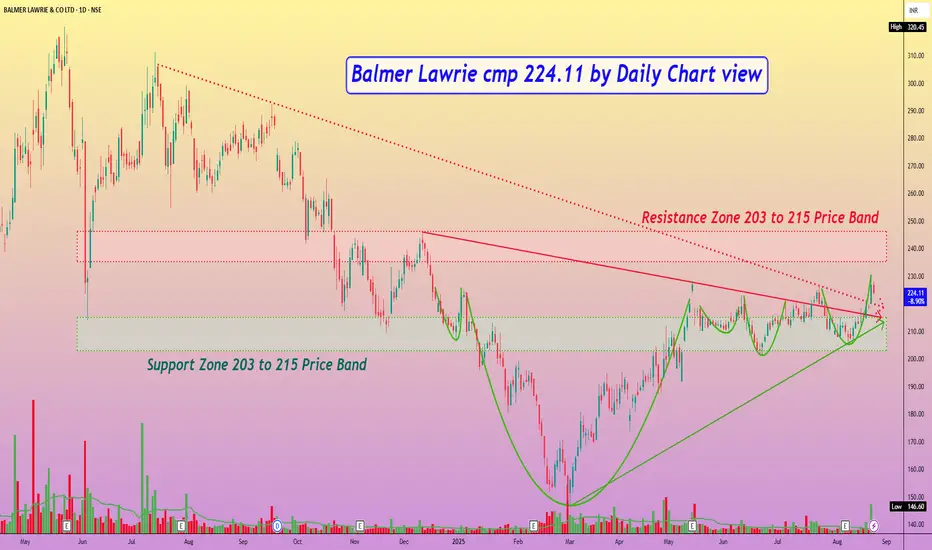
Balmer Lawrie cmp 224.11 by Daily Chart viewBalmer Lawrie cmp 224.11 by Daily Chart view
- Support Zone 203 to 215 Price Band
- Resistance Zone 203 to 215 Price Band
- Multiple Bullish Rounding Bottoms around Support Zone
- Both Falling Resistance Trendlines Breakout seems sustained
- Heavy Volumes surge on Friday post close sync with avg traded qty
- Upwards Price momentum has well respected the Rising Support Trendline
- [ b]*Inside Bar made on Friday closure, indicates observing caution either a Breakout or Breakdown*
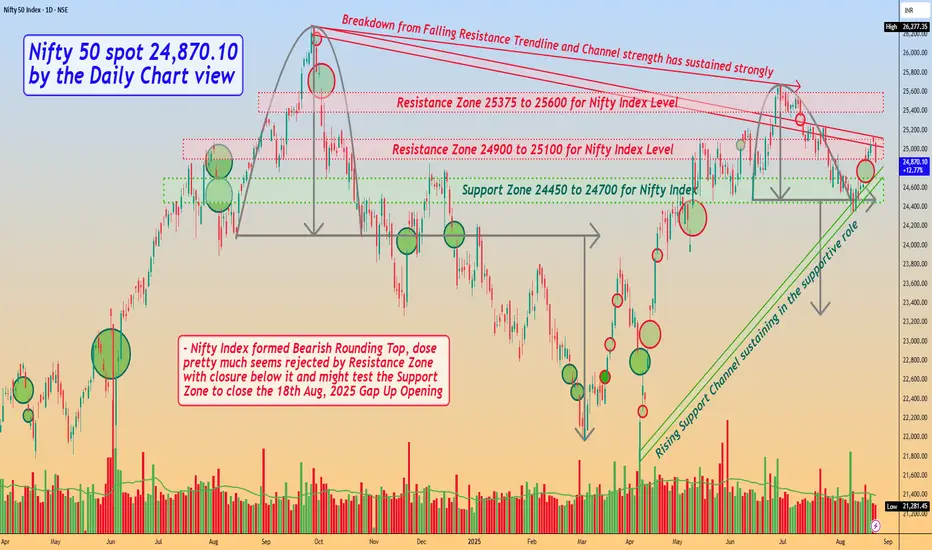
Nifty 50 spot 24,870.10 by the Daily Chart view - Weekly updateNifty 50 spot 24,870.10 by the Daily Chart view - Weekly update
- Support Zone 24450 to 24700 for Nifty Index
- Rising Support Channel sustaining in the supportive role
- Resistance Zone seen at 24900 to 25100 for Nifty Index Level
- Next Resistance Zone seen at 25375 to 25600 for Nifty Index Level
- Nifty Index formed Bearish Rounding Top, dose pretty much seems rejected by Resistance Zone with closure below it
- Basis Gap Up Opening done on 18th August, 2025, Nifty Index might just test Support Zone for closing Gap Up vacuum area
- Rest, let us HOPE FOR THE BEST TO HAPPEN, for the known fact that MARKETS ACT SUPREME ALL THE TIME, no matter what we propagate
Bank Nifty spot 55,149.40 by Daily Chart view - Weekly updateBank Nifty spot 55,149.40 by the Daily Chart view - Weekly update
- Rising Support Channel broken down from supportive role
- Next fairly decent Support Zone 54160 to 54660 for Bank Nifty Index
- Upwards going Resistance Zone 59550 to 56385 for Bank Nifty Index
- Next Strong Resistance Zone 56850 to 57250 and then ATH Level 57628.40
- Acting Support Zone 55050 to 55450 for Bank Nifty Index, will it be a Resistance Zone again
- Bank Nifty Index formed Bearish Rounding Top, somehow seen sustaining closure above the Support Zone for past 3 weeks, indicates consolidation, hope for an upward trajectory

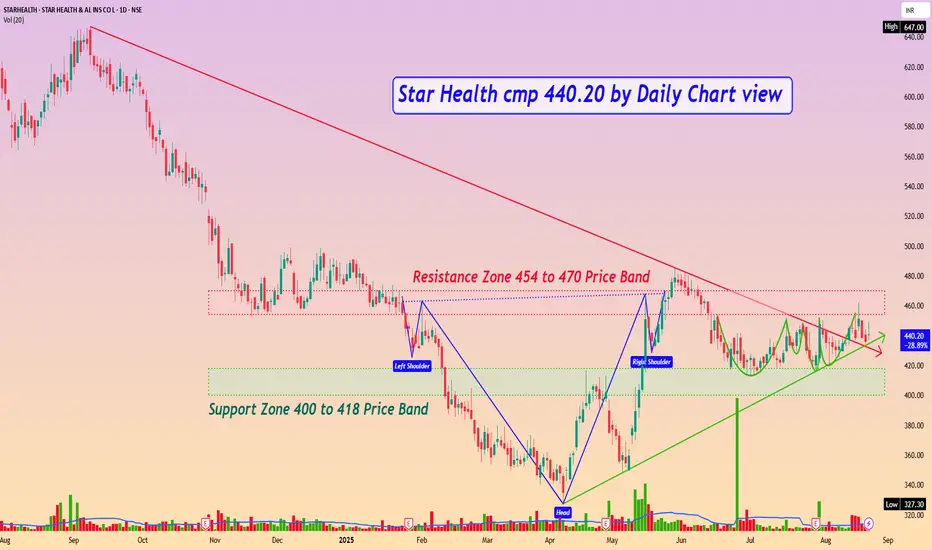
Star Health cmp 440.20 by Daily Chart viewStar Health cmp 440.20 by Daily Chart view
- Support Zone 400 to 418 Price Band
- Resistance Zone 454 to 470 Price Band
- *Price repeatedly rejected down from the Resistance Zone*
- Falling Resistance Trendline Breakout seems to be sustained
- *Volumes falling by selling pressure from the Resistance Zone*
- Rising Support Trendline yet well respected by up-trending price
- *Stock Price traversing within the Darvas Box between Support and Resistance*
- Bullishness indicated by Technical patterns Head & Shoulders and Rounding Bottoms
- *Price Breakout post crossing and sustaining for few days over Resistance Zone neckline hurdle*
Zydus Lifesciences cmp 989.45 by Daily Chart viewZydus Lifesciences cmp 989.45 by Daily Chart view
- Support Zone 946 to 966 Price Band
- Resistance Zone 996 to 1016 Price Band
- Falling Resistance Trendline and Zone Breakout attempted
- Volumes seem in decent sync with the average traded quantity
- Multiple Bullish Rounding Bottoms with Cup & Handle by Resistance Zone neckline
- Resistance Zone acting as a strong hurdle to crossover and breakout basis past reversals

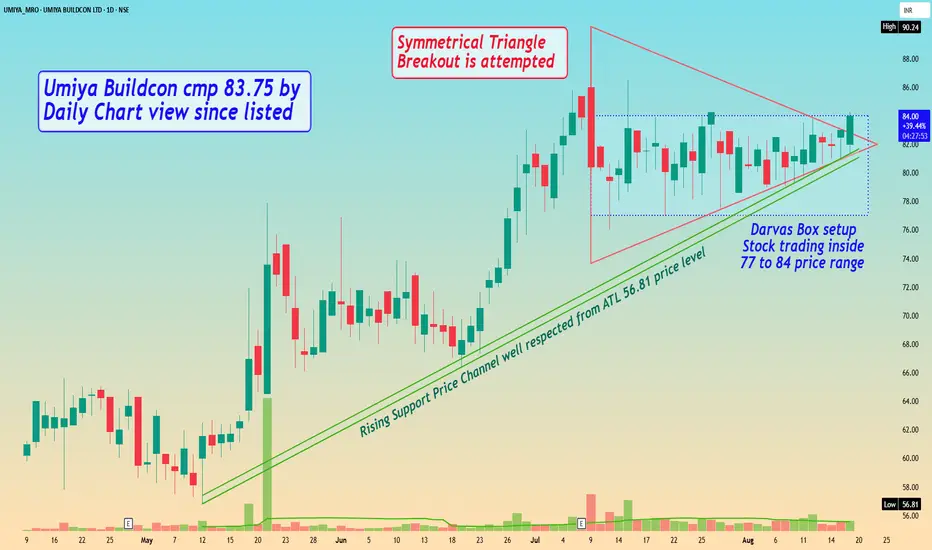
Umiya Buildcon cmp 83.75 by Daily Chart view since listedUmiya Buildcon cmp 83.75 by Daily Chart view since listed
- Support Zone 79 to 81 Price Band
- Resistance Zone 85 to 87 then ATH 90.24
- Symmetrical Triangle Breakout is attempted
- Volumes are in close sync with average traded quantity
- Darvas Box setup Stock trading inside 77 to 84 price range
- Rising Support Price Channel well respected from ATL 56.81 price level
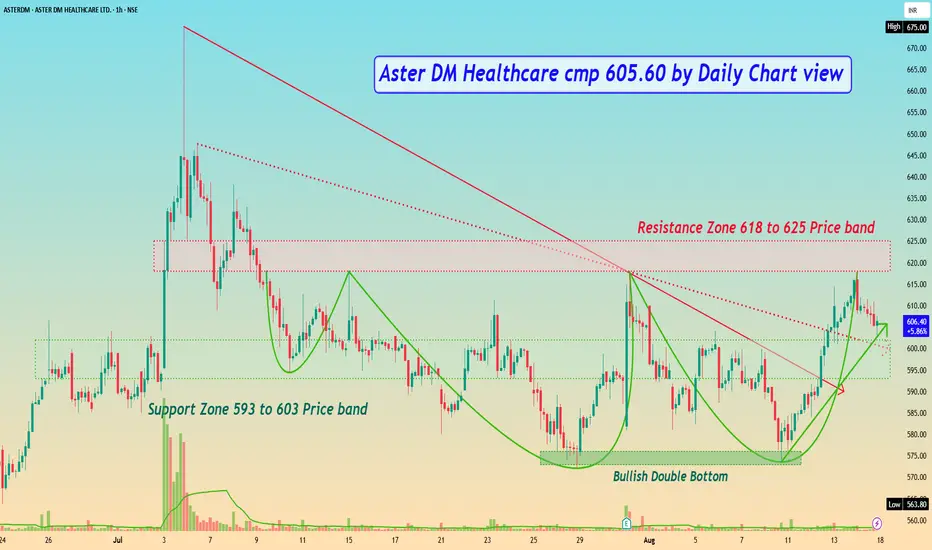
Aster DM Healthcare cmp 605.60 by Daily Chart viewAster DM Healthcare cmp 605.60 by Daily Chart view
- Support Zone 593 to 603 Price band
- Resistance Zone 618 to 625 Price band
- Stock price to test retest Support Zone for fresh upside
- Falling Resistance Trendlines Breakout is done and sustained
- Bullish Double Bottom formed around the 573 to 576 price level
- Bullish Rounding Bottoms formed but failed Breakout at Resistance Zone neckline
- Heavy Volumes needed above avg traded quantity for successful breakout over Resistance Zone
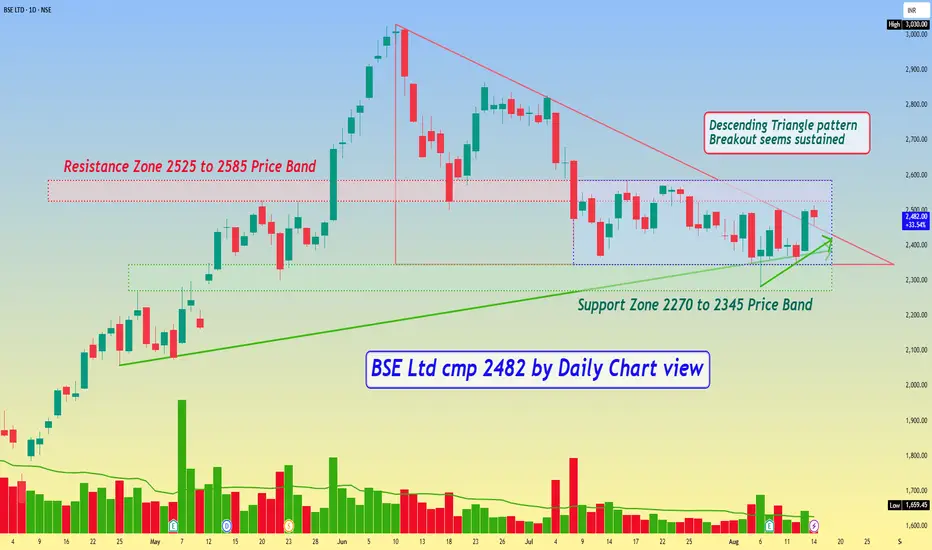
BSE Ltd cmp 2482 by Daily Chart viewBSE Ltd cmp 2482 by Daily Chart view
- Support Zone 2270 to 2345 Price Band
- Resistance Zone 2525 to 2585 Price Band
- Descending Triangle pattern Breakout seems sustained
- Stock seems trading within price range indicating Darvas Box setup
- Volumes seen gradually syncing closely with the average traded quantity
- Most known Technical Indicators BB, EMA, MACD, RSI, SAR seem trending positively
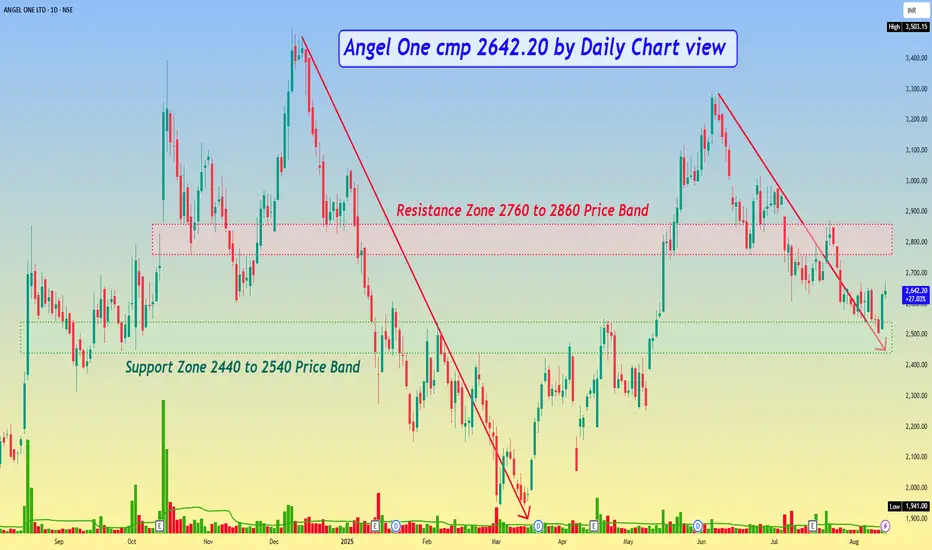
Angel One cmp 2642.20 by Daily Chart viewAngel One cmp 2642.20 by Daily Chart view
- Support Zone 2440 to 2540 Price Band
- Resistance Zone 2760 to 2860 Price Band
- Falling Resistance Trendline Breakout seems sustained
- Price reversal has taken upwards momentum post quick test retest of the Support Zone
- [ b]Will history repeat itself but from an early stage basis last Breakout from Falling Resistance Trendline
- Hoping for a breakout above Resistance Zone unlike breakdown, that occurred recently in last week of July 2025
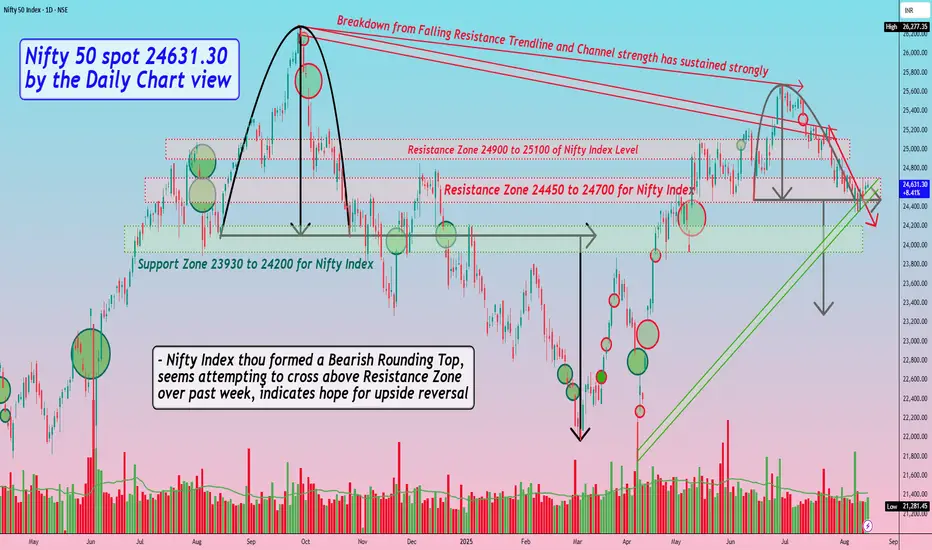
Nifty 50 spot 24631.30 by Daily Chart view - Weekly updateNifty 50 spot 24631.30 by Daily Chart view - Weekly update
- Support Zone 23930 to 24200 for Nifty Index
- Resistance Zone 24450 to 24700 for Nifty Index
- Breakout from above one of the Tiny Falling Resistance Trendline seems well sustained
- Rising Support Channel seems back in supportive role and maintained by current status of Nifty Chart setup
- Nifty Index thou formed a Bearish Rounding Top, seems attempting to cross above Resistance Zone over past week, indicates hope for upside reversal
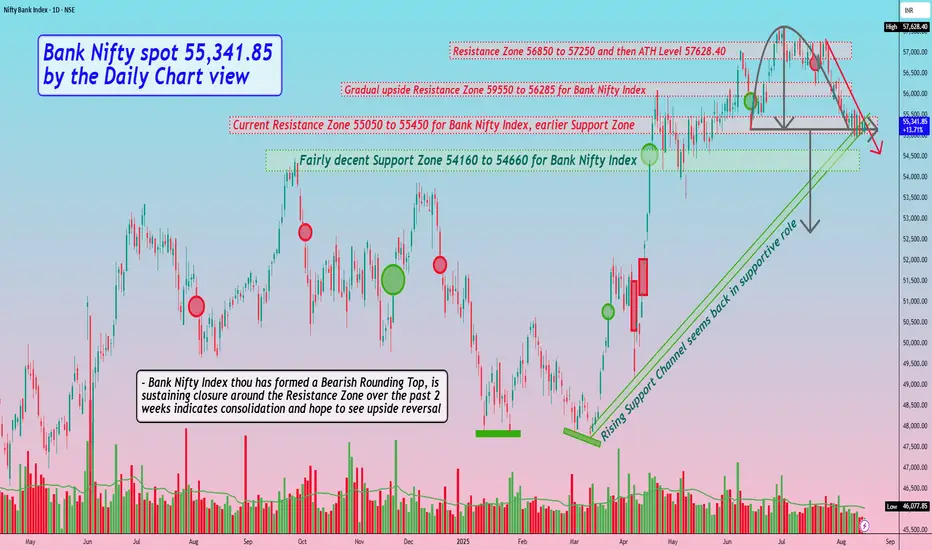
Bank Nifty spot 55,341.85 by the Daily Chart view - Weekly updatBank Nifty spot 55,341.85 by the Daily Chart view - Weekly update
- Fairly decent Support Zone 54160 to 54660 for Bank Nifty Index
- Current Resistance Zone 55050 to 55450 for Bank Nifty Index, earlier Support Zone
- Falling Resistance Trendline is yet a hurdle to cross over along with the current Resistance Zone
- Rising Support Channel seems back in supportive role and gives indicative feeling of probable upside reversal, so hope for the best to happen
- Bank Nifty Index thou has formed a Bearish Rounding Top, is sustaining closure around the Resistance Zone over the past 2 weeks indicates consolidation and hope to see upside reversal
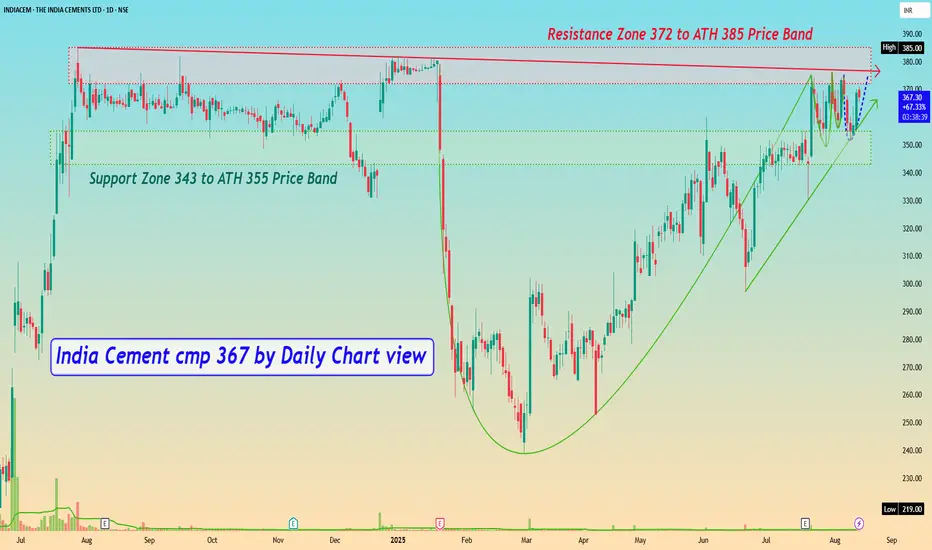
India Cement cmp 367 by Daily Chart viewIndia Cement cmp 367 by Daily Chart view
- Support Zone 343 to ATH 355 Price Band
- Resistance Zone 372 to ATH 385 Price Band
- Falling Resistance Trendline hurdle with Resistance Zone
- Bullish Cup and Handle pattern by the Resistance Zone neckline
- Rising Support Trendline seems well sustained by price momentum
- *Volumes steadily close to avg traded qty, need to increase for fresh breakout*
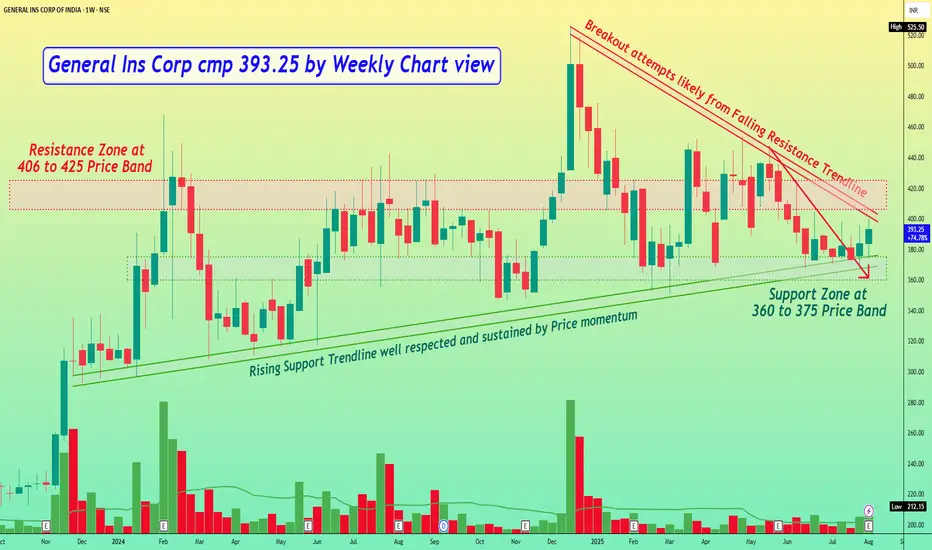
GICRE General Ins Corp cmp 393.25 by Weekly Chart viewGeneral Ins Corp cmp 393.25 by Weekly Chart view
- Support Zone at 360 to 375 Price Band
- Resistance Zone at 406 to 425 Price Band
- Breakout attempts likely from Falling Resistance Trendline
- Rising Support Trendline well respected and sustained by Price momentum
- Volumes seem well in sync with average traded quantity over the past few weeks
- *Subject to Strong Resistance Zone Breakout happens, it would a good hurdle to crossover*
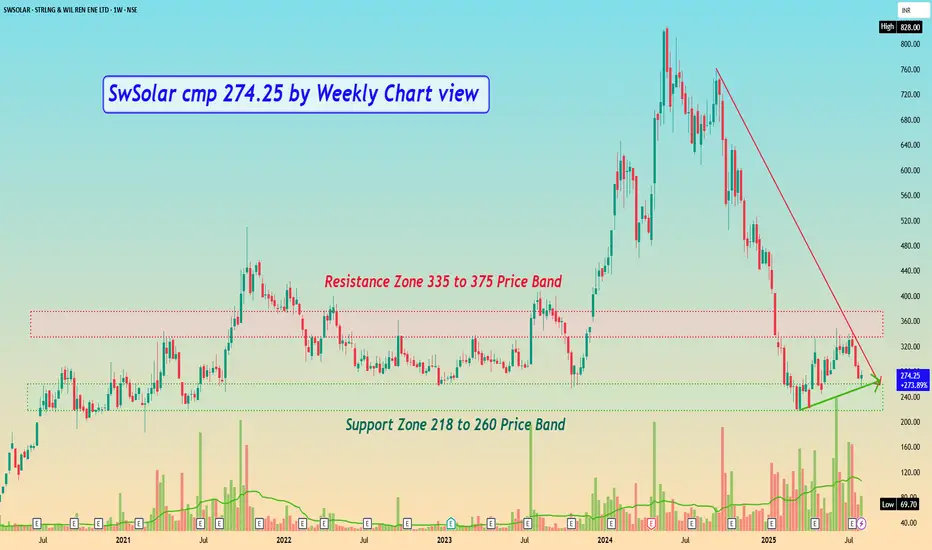
SwSolar cmp 274.25 by Weekly Chart viewSwSolar cmp 274.25 by Weekly Chart view
- Support Zone 218 to 260 Price Band
- Resistance Zone 335 to 375 Price Band
- Stock Price currently around Old Times Strong Support Zone
- Price reversal probability by past chart data seen basis Support Zone is sustained
- Price will need good incremental Volumes to breakout from fairly strong Resistance Zone
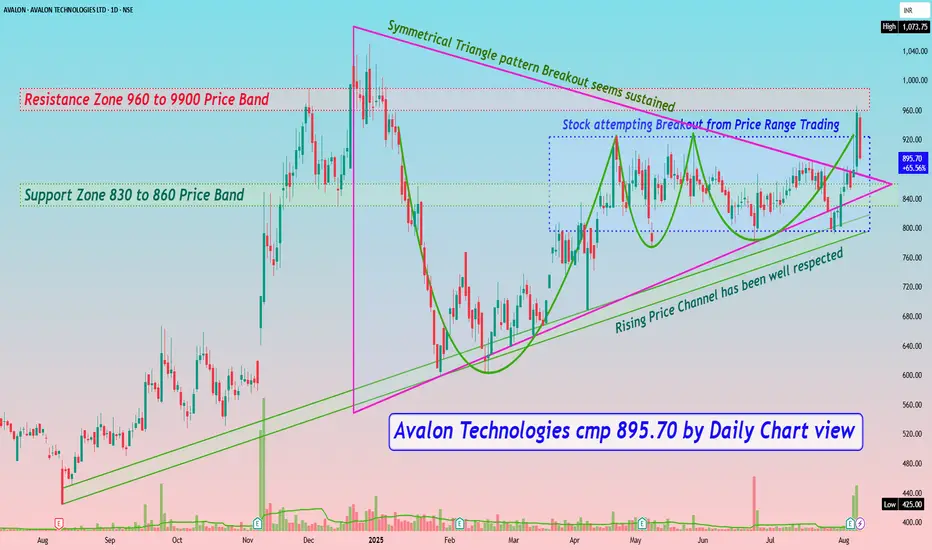
Avalon Technologies cmp 895.70 by Daily Chart viewAvalon Technologies cmp 895.70 by Daily Chart view
- Support Zone 830 to 860 Price Band
- Resistance Zone 960 to 9900 Price Band
- Rising Price Channel has been well respected
- Stock attempting Breakout from Price Range Trading
- Symmetrical Triangle pattern Breakout seems sustained
- Repeated Bullish Rounding Bottoms under Resistance Zone neckline
- Volumes spiked heavily at end of week and above average traded quantity
- Positively trending Technical Indicators BB, EMA, MACD, RSI,SAR, SuperTrend