Intraday Trading vs Swing TradingIntroduction
Brief overview of trading in financial markets.
Importance of choosing the right trading style for profitability and risk management.
Statement of purpose: Compare intraday trading and swing trading across multiple dimensions such as time horizon, risk, capital requirements, strategy, and psychology.
1. Understanding Intraday Trading
1.1 Definition
Buying and selling financial instruments within the same trading day.
Positions are squared off before the market closes.
1.2 Characteristics
Short-term focus (minutes to hours).
High trade frequency.
Requires constant market monitoring.
1.3 Tools & Techniques
Technical indicators: RSI, MACD, moving averages, Bollinger Bands.
Chart patterns: Flags, triangles, head & shoulders.
Level 2 data, real-time market depth.
1.4 Advantages
Potential for high profits in a single day.
No overnight risk exposure.
Quick capital turnover.
1.5 Disadvantages
High stress due to rapid decision-making.
Significant brokerage and transaction costs.
Requires advanced knowledge and quick reflexes.
2. Understanding Swing Trading
2.1 Definition
Holding positions for several days to weeks to capture medium-term price movements.
2.2 Characteristics
Medium-term focus.
Fewer trades but larger profit potential per trade.
Less time-intensive compared to intraday trading.
2.3 Tools & Techniques
Technical analysis: Trendlines, support/resistance, moving averages.
Fundamental analysis: Earnings reports, sector trends, macroeconomic indicators.
Swing patterns: Breakouts, pullbacks, reversals.
2.4 Advantages
Less stressful than intraday trading.
More time to analyze and make informed decisions.
Lower transaction costs due to fewer trades.
2.5 Disadvantages
Exposure to overnight and weekend risks.
Capital is tied up longer.
Requires patience and disciplined risk management.
3. Time Horizon and Trading Frequency
Intraday: Trades last minutes to hours; multiple trades daily.
Swing: Trades last days to weeks; limited trades but larger exposure.
Impact on lifestyle: Intraday requires active screen time; swing allows more flexibility.
4. Capital Requirements
Intraday: Leverage is often used; margin requirements are smaller but risk is higher.
Swing: Requires more capital per trade due to longer holding periods and lower leverage.
Risk of capital erosion: Intraday mistakes can wipe out a day’s gains; swing mistakes can impact several days of profit potential.
5. Risk and Reward Dynamics
Intraday: High volatility can yield high rewards but also steep losses.
Swing: Moderate volatility, potential for larger cumulative gains, but exposure to overnight gaps.
Risk management strategies: Stop-loss orders, position sizing, diversification.
6. Trading Psychology
Intraday:
Requires quick decision-making and mental resilience.
Emotional discipline is crucial; fear and greed can destroy profits quickly.
Swing:
Patience is essential to ride trends.
Ability to handle temporary drawdowns without panic-selling.
7. Strategy and Analysis
Intraday Trading Strategies:
Scalping: Quick small gains.
Momentum trading: Riding strong price trends within the day.
Swing Trading Strategies:
Trend-following: Entering trades along prevailing trends.
Reversal trading: Buying dips and selling rallies.
Technical vs fundamental analysis balance: Swing trading often incorporates both; intraday is heavily technical.
8. Costs and Tax Implications
Intraday:
Higher brokerage and STT due to frequent trades.
Short-term gains taxed differently depending on jurisdiction.
Swing:
Lower trading costs.
Gains may qualify for medium/long-term capital gains benefits.
9. Suitability for Different Traders
Intraday: Best for active, risk-tolerant, experienced traders with fast decision-making skills.
Swing: Suitable for part-time traders, working professionals, and those seeking less stressful trading.
10. Technology and Tools
Intraday: Real-time charts, high-speed internet, advanced trading platforms.
Swing: Standard charting tools, technical analysis software, news alerts.
Algorithmic trading: Both can benefit but intraday relies more heavily on automated systems.
11. Performance Metrics
Intraday:
Profit per trade is smaller but cumulative daily gains can be significant.
Key metrics: Win rate, risk-reward ratio, drawdown percentage.
Swing:
Profit per trade larger due to capturing trends.
Key metrics: Holding period returns, average gain/loss, volatility capture.
12. Case Studies
Example of successful intraday trades: High-volume stocks, news-based spikes.
Example of successful swing trades: Trend-following in indices or sectoral stocks.
Comparison of returns, drawdowns, and effort required.
13. Hybrid Approaches
Combining intraday scalping with swing trading to diversify income streams.
Portfolio allocation between short-term and medium-term trades.
Pros and cons of hybrid trading.
14. Choosing Your Style
Assess your risk tolerance, time availability, capital, and psychological comfort.
Test both styles using paper trading before committing real capital.
Flexibility and adaptation to changing market conditions.
15. Conclusion
Recap of key differences: time horizon, risk, rewards, strategies, tools.
Emphasis on personal suitability over “best style.”
Encouragement to practice disciplined trading, regardless of style.
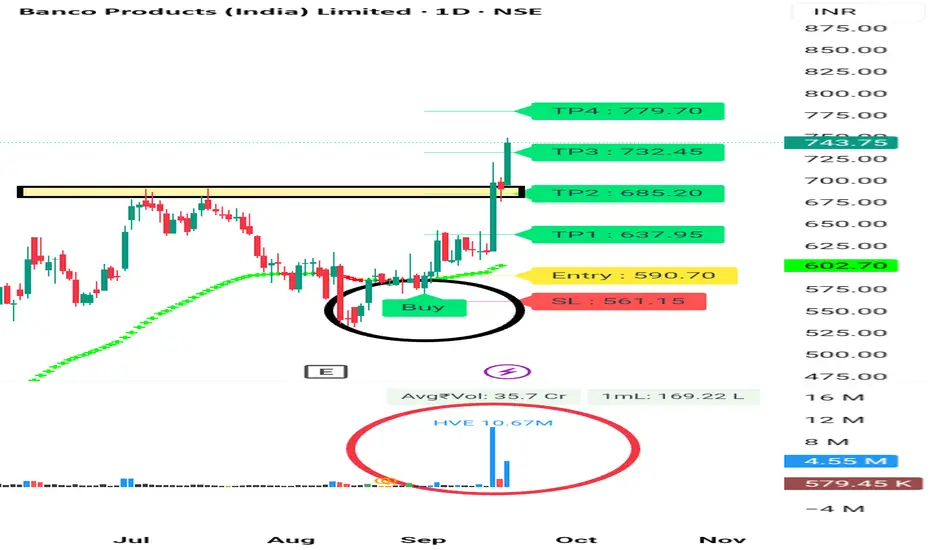
Swing-trade

Breakout Stock For Swing Trading Banco india is a very good stock in his secret. It's given breakout with high volume.
It's looking good for Swing trading tgt 5 -8%
SL 5% . then Trail SL.
It's given good breakout.
You can Visit my Tradingview Profile for more information.
Consult your financial advisor before making any position in stock market.
PFC STOCK BULLISH REVERSALPFC Stock price sideways from 2 months now see reversal and price trade above 50 EMA.
Price trade around 477 stop loss 455 and target 560.
Indicator RSI< MACD< STOCHASTIC also positive.
this is only educational purpose only.

A SWING \ LONG TERM STOCK - SBGLP NSE:SBGLP
❇️A good low risk setup in daily time frame above 130 makes a perfect entry.
❇️SL below recent swing low. ( 127)
❇️A very good weekly break out at weekly time frame.
❇️Expecting stock price to reach 200+ in up coming days.
❇️ Volume looks good.
❇️Every entry must have a stoploss partnered with it.
👉🏻 @thetradeforecast 🇮🇳

A BREAKOUT & RETESTED STOCK - NTPC NSE:NTPC
❇️A good low risk setup in daily time frame above 432 makes a perfect entry.
❇️SL below recent swing low. 420
❇️A very good weekly break out at weekly time frame.
❇️Expecting stock price to reach 445-450-460+ in up coming days.
❇️ Volume looks good.
❇️Every entry must have a stoploss partnered with it.
Disclaimer: not SEBI Registere and not responsible for your profits and your losses thank you 🌻
👉🏻 @thetradeforecast 🇮🇳

A breakout stock - #Precision Wires NSE:PRECWIRE
❇️A good low risk setup in daily time frame above 212 makes a perfect entry.
❇️SL 204 near breakout area.
❇️A very good weekly break out at weekly time frame.
❇️Expecting stock price to reach 220-230-245 in up coming days.
❇️ Volume looks decent..
❇️Every entry must have a stoploss partnered with it.
Disclaimer:- not SEBI Registere. I not responsible of your profits and your losses. Thank you 🌻
👉🏻 @thetradeforecast 🇮🇳

BIOCON LTD READY FOR A UPSWING (SWING TRADING SETUP)Since last weeks we have seen pharma sector is outperforming and this performance may continue.
As per price action biocon ltd
Has created a Cup but handle is still remaining. If this stock creates a handle which is highly possible then price can be bullish for few trading sessions.
Price should sustain above Trend line then it will be good.
For more confirmation wait for the price to come at resistance level and look for RSI above 70.
If fails and test previous support then this Overview will be considered as NULL.(Conditions not fulfilled)

A BREAKOUT WITH VOLUME - ADSLNSE:ADSL
❇️ Strong breakout on 4-2 hour chart
❇️ Stock can achive 250-280+ targets in upcoming days.
❇️ Nearby support 220-210.
❇️ Above 240 we can see a real move🔥
👉🏻 @thetradeforecast 🇮🇳

IOC Symmetrical Triangle Breakout | Swing Trade Hi trader
This is Indian oil corporation Triangle Breakout.
This is my favourite setup for positional trade.
Note - Only for Education Purpose.

#NationalaluminiumStrong Breakout., Gearing up for next levels.
Supply and demand Zones. Breaking the Supply the stock is moving towards the Supply

Short Term Swing Trade Idea | Buy Eimco Elecon (India) Limited Short Term Trading Advice by Goodluck Capital
Buy Eimco Elecon (India) Limited (NSE:EIMCOELECO)
Buy Range- 1710 - 1750
Target- 1970 - 2000
StopLoss- below 1610
Potential Return- 14-16%
Approx trade duration 14 - 16 days


Swing Trading Idea | Buy Apar Industries | Expected Gain 11% Short Term Trading Advice by Goodluck Capital
Buy Apar Industries (NSE:APARINDS)
Buy Range- 5200 - 5350
Target- 5850 - 6000
StopLoss- below 4975
Potential Return- 11-14%
Approx trade duration 12 - 14 days

the next big thing will be wiprobreakout of supply zone
support from 200 ema
buy at cmp and add on dip
sl is 397
two targets are marked

13 Sep ’23 Post Mortem on Nifty - Cautiously BullishNifty Analysis
Recap from yesterday: “I wish to just wait and watch for tomorrow and not get into an aggressive long position until Nifty50 has consolidated at the current levels. I wish to modify my stance to neutral from bullish. If we break the 19870 levels tomorrow — I wish to go short (bearish).” . I did not get into any new long position in Nifty, in fact I rolled up the PE to 19900 from 19800.
The rally momentum is not lost, its just that we had a blip yesterday. Seems like Moneycontrol got the reason for the huge cut on Midcaps and Small caps yesterday - Talk of basket selling by European financial services firm fuels meltdown in mid, small-caps
Nifty50 rallied 0.7% ~ 139pts vs Midcap +0.12% & SmallCap +1.02%. Has some money rotated and re-entered the large caps? The reason I did not go long today - The swing high of 20110 still not taken out. Meanwhile its still a win for the bulls as the final close is above 20000 levels.
On the 1hr chart Nifty50 is looking all the more positive and raring to go. I too wish to go long with downside protection via PUTS. The swings in options prices were crazy and the volume of put writing was intense suggesting more traders are betting on the bullish side. I expect the expiry to be above 19989 if we still have the bullish sentiment. I wish to stay 50% neutral and 50% bullish for tomorrow and would like to go 100% bullish once the swing high of 20110 is taken out.

BUY IRCTC IRCTC is now really good buying Point.
it has given a really nice break out. also having a good strength.
All levels are marked on chart.
follow long position on chart.

JPPOWER : 1:3TARGET STOCK Eventhough the stock is not following the rules of my trading (please check my previous swing ideas) can give a great return in short time with small stop loss.
ACCUMULATION PHASE IS GOING ON.

JSW ENERGY --SWING TRADE JSW ENERGY --DAILY CHART --SWING TRADE SETUP
1. JSW ENERGY Bullish technical indicators on Daily Chart setup
2. support form around 210 sub level after strong pullback towards 280 sub level, recently stock correct 245 sub level which is 50% around Fibonacci retrenchment from recent top 280.
3. support level 245 retest at cmp which is good entry level for swing - positional trade for target 260-280-300 stop loss bellow trendline mark in yellow at 218
4. Entry 245 level
5. stock trading above 24,35,200 HMA
6. CCI , ema AT center line , crossover from center line will be good upmove .
** THIS IDEA IS FOR EDUCATIONAL PURPOSE .. ** Trade at own Risk
HAPPY TRADING . !!

ITC Flag and Pole PatternITC is forming a flag and pole pattern, ITC has shown great growth during the hard time when the market has been acting up bearish. It is safe to say that ITC will manage to grow unhindered from the markets current sentiments thus making it a good for long trade.

IDFC FIRST --SWING TRADE --28/02/2023IDFC FIRST BANK --SWING TRADE --28/02/2023
1. stock seen lower channel breakout last hourly candle
2. support form around 54 level and move above 21, 44 HMA on hourly chart
3. BUY near 55 LEVEL target 56-57-58 ( 1-2) session stop loss bellow 53.25 level
4. bank nifty seen some pullback from oversold level
5. CCI , ema crossover seen .
** THIS IDEA IS EDUCATIONAL PURPOSE ..trade at own risk ..
HAPPY TRADING .!!

Head and shoulders pattern in niftyNifty made head and shoulders pattern on daily chart.If it breaks his neckline then good trade in down side.

JM Financial AnalysisHello Everyone, Today i am here again with a new stock named JM Financial at here you can see that there is a double bottom forming and then one more confirmation inverse head and shoulders and giving breakout of it and giving us a clear buy. Thank you, comment down so i can know on which stock you want to know about also if you get anything special pls follow us and like this post

Yes Found Another For You Hello Everyone, Today i am again with a new stock HDFC AMC as you can it has made a double bottom and now it is ready for breakout and to be buyed. When you go to daily chart you will find a inverse head and shoulders pattern which also gives us more possibility to buy. Thanks pls do follow us and like this post also tell us that are you interested in it or not.
We are not SEBI Registered so the total risk is yours we are here to aware you about charts
