SRF LTD: Price Compression at Key Resistance|Clean Breakout Play📌 Structure: Daily Timeframe
SRF has been consolidating inside a clean descending channel, printing lower highs while demand holds near the channel base.
Price is now pressing against well-tested channel resistance — a clear decision zone.
🔴 Key Reads
Descending resistance respected multiple times
Tight price compression near supply → volatility contraction
Buying interest visible near demand
Muted volume during consolidation → pre-expansion behaviour
This is structure-led, not momentum-driven.
🟢 Breakout Rules (Strict)
Trade triggers only if:
Strong green Marubozu / near-Marubozu
Daily close above descending resistance
Clear volume expansion
No close above resistance = no trade.
🎯 Trade Plan
Entry: Breakout close
SL: Low of breakout candle
Target 1: ₹3300, then trail
Management: Trail via higher lows / structure
Defined risk. Reward from range expansion, not prediction.
🧠 Why It Works
- Long consolidation builds energy
- Repeated rejections weaken supply
- Channel breakouts often expand fast
Clean price + volume = institutional participation
⚠️ Invalidation
Weak breakout
Low volume
Rejection wick with close back inside channel
→ No trade
📊 Final Word
SRF is coiled, not weak.
Patience first. Execution only on confirmation.
➡️ Let price prove strength. 👍 Appreciate if this helps.
⚠️ Disclaimer
This is a technical study for educational purposes only, based purely on price action and volume.
Not financial advice. Please manage risk as per your own trading plan.
🔔 Follow
If you like clean, no-indicator, price–volume based setups,👉 Follow for more structure-led trade ideas and chart studies.
💬 Your Turn
Have a stock you want analysed using pure price action & volume?
Drop the name in the comments — I’ll pick a few and share clean charts.
Swingsetup

Swing Trading Secrets1. The Secret of Trend Recognition
The biggest secret of profitable swing trading is identifying the dominant trend of the market. Most novices try to pick tops and bottoms, but professionals follow the path of least resistance. Trend recognition means:
Uptrend: Higher highs (HH) + higher lows (HL)
Downtrend: Lower highs (LH) + lower lows (LL)
Range: Price oscillates between support and resistance
Swing traders do not predict; they react. They align trades with the existing trend.
For example:
In an uptrend, they wait for pullbacks to key levels.
In a downtrend, they short the rallies.
In a range, they buy at support and sell at resistance.
Knowing the trend keeps traders on the right side of probability.
2. The Secret of Patience and Timing
Effective swing traders don’t enter randomly. They wait for specific conditions:
A. The market must be near a key level
Trendline touch
Moving average support (e.g., 20-EMA, 50-EMA)
Fibonacci retracement (38.2%, 50%, 61.8%)
Previous swing high/low
Volume clusters
B. Price must confirm the reversal or continuation
Patience allows the market to “show its hand” before entering.
The secret: wait for the candle close, not the candle forming.
Many traders lose because they enter too early. Timing matters more than direction.
3. The Secret of Multi-Timeframe Confluence
Professional swing traders use multiple timeframes:
Higher timeframe (HTF): 1-week or 1-day → Trend direction
Trading timeframe (TTF): 4-hour or 1-day → Entry zones
Lower timeframe (LTF): 1-hour or 15-min → Entry trigger refinement
This is called top-down analysis.
If the weekly chart shows an uptrend, the daily chart shows a pullback, and the 4-hour chart shows a bullish reversal pattern, the probability of success becomes extremely strong.
Multi-timeframe alignment is a powerful edge.
4. The Secret of High-Probability Patterns
Swing traders rely on chart patterns—not lots of patterns, just a handful of powerful ones that repeat reliably.
A. Continuation Patterns
Bull flag
Bear flag
Ascending triangle
Descending channel
These indicate that the trend is likely to continue.
B. Reversal Patterns
Double top / double bottom
Head and shoulders
Morning star / evening star
Hammer / shooting star
C. Breakout Patterns
Cup and handle
Range breakout
Consolidation breakout
Professional traders focus on clean patterns. If the pattern is messy, overlapping, or unclear, they move on.
5. The Secret of Volume Analysis
Price shows direction; volume shows conviction.
High-probability swing trades usually show:
High volume on breakouts
Low volume on pullbacks
High volume on reversal candles
Volume spikes at support/resistance
Volume acts like a lie detector. If a breakout happens on weak volume, it is often a trap.
Understanding volume helps traders avoid false signals.
6. The Secret of Risk Management
Most swing traders fail not because their strategy is bad but because their risk management is weak.
Professionals follow these golden rules:
Risk only 1–2% of capital per trade
Always place a stop-loss
Size positions based on volatility
Avoid overtrading
Never increase lot size after a loss
The greatest secret:
Protecting capital is more important than making profits.
A trader who avoids major losses can survive long enough to catch big winning swings.
7. The Secret of Support & Resistance Mastery
Swing traders obsess over support and resistance levels.
These levels act as price magnets and turning zones.
Key levels include:
Previous swing highs/lows
Daily, weekly, and monthly levels
Psychological numbers (100, 500, 1000)
Fibonacci retracement levels
Supply and demand zones
Swing traders wait for price reactions at these levels and only trade when confirmation appears.
8. The Secret of Using Indicators the Right Way
Professional swing traders use indicators as confirmation, not decision-making tools.
Popular indicator combinations:
A. Trend + Momentum
50-EMA or 200-EMA + RSI
20-EMA + MACD
B. Pullback Identification
Bollinger Bands
Stochastic RSI
C. Breakout Confirmation
Volume + MACD
RSI breakout
The secret:
Use indicators sparingly—2 or 3 maximum.
Clear charts produce clearer decisions.
9. The Secret of Trading Psychology
Swing trading rewards emotional control.
Professionals master:
A. Discipline
Follow the plan strictly.
B. Patience
Wait for the best setups.
C. Emotional Detachment
React to charts, not feelings.
D. Consistency
A few high-quality trades outperform dozens of random trades.
The less emotionally involved a trader is, the better they perform.
10. The Secret of Journaling Every Trade
This is one of the most underrated secrets.
A trade journal includes:
Entry and exit
Stop loss
Chart screenshots
Reason for trade
Mistakes
Market context
Journaling forces self-reflection and dramatically improves discipline and performance.
11. The Secret of Avoiding News-Based Noise
Swing traders avoid making decisions during:
Major economic announcements
Earnings reports
Policy changes
High volatility events
News can create unpredictable spikes that damage swing positions.
Professionals stay defensive during such periods.
12. The Secret of Letting Winners Run
One of the greatest swing trading secrets is knowing when not to exit early.
Successful traders:
Trail their stop-loss
Add positions in trend continuation
Hold until target zones are met
Small losses and big wins create long-term profitability.
Conclusion
Swing trading appears simple but demands mastery of multiple elements—trend recognition, timing, patience, volume interpretation, chart patterns, risk management, and psychology. The real secrets lie not in magical indicators but in disciplined execution and consistent behavior. When traders combine technical analysis with emotional control, they unlock the ability to capture market swings with confidence and accuracy.

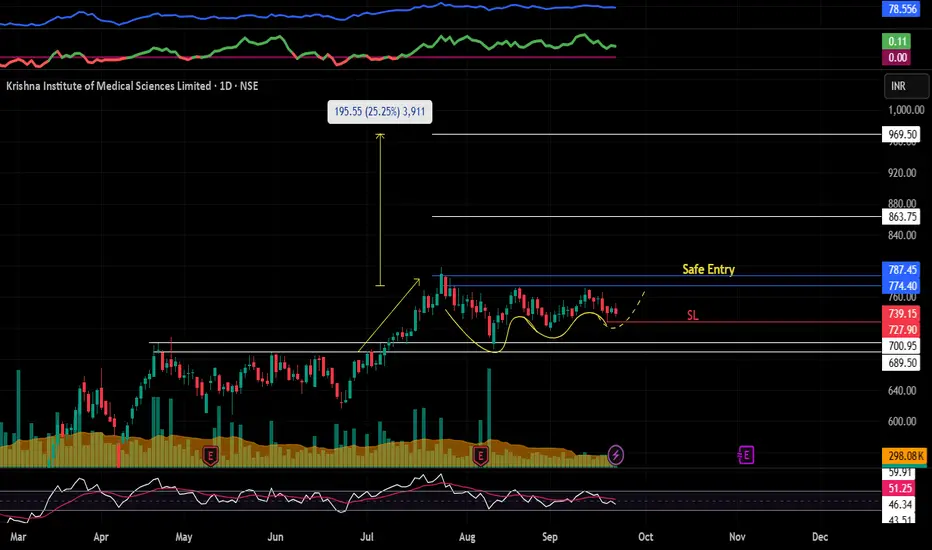
KIMS : Devloping VCP pattern structure#KIMS #vcppattern #vcpbreakout #swingtrading #momentumtrading
KIMS : Swing Trade / Short term
>> Trending Stock
>> VCP pattern developing
>> Volumes Picking up
>> Low Risk High Reward Trade
Swing Traders can lock profit at 10% and keep Trailing
Please Boost, comment and follow us for more Learnings.
Disc : Charts shared are for learning purpose only, not a Trade recommendation. Do your own research and consult your financial advisor before taking any position.
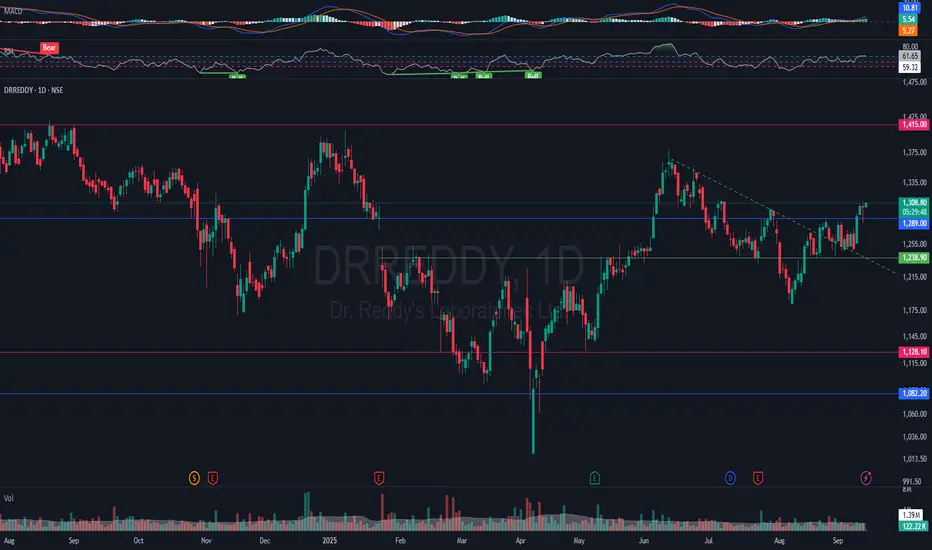
NSE:DRREDDY - Medium Term Swing Trade Opprotunity💹 Weekly Charts::
Price is consolidating around ₹1,300 after a bounce from the ₹1,150–1,180 zone (strong support zone).
Major resistance levels:
₹1,350–1,360 (R1 zone & trendline resistance)
₹1,415 (swing high and R2 zone)
Weekly RSI ~60, showing improving momentum but not yet overbought.
MACD histogram turning positive → suggests early signs of bullish momentum.
📊 Daily Charts::
Price recently broke above ₹1,244–1,250 zone, now retesting near ₹1,300–1,307 (R1 pivot resistance).
Next resistance: ₹1,350–1,360, followed by ₹1,410–1,415.
RSI ~65, bullish but near overbought → breakout confirmation is key.
ADX improving, +DI > -DI → trend strengthening.
Volume is moderate but picking up on green candles.
📈 Upside Potential::
If price sustains above ₹1,310, it can rally towards:
₹1,350–1,360 (short-term target)
₹1,415 (swing high)
Breakout above ₹1,415 on strong volume → opens potential towards ₹1,505–1,520 (weekly R2 & psychological round level).
📉 Downside / Risk Levels::
Strong support: ₹1,245–1,250 (previous breakout zone).
Deeper support: ₹1,180–1,200 (weekly support + P pivot).
If price breaks below ₹1,180, bearish momentum may resume towards ₹1,100.
✅ Conclusion
Worth initiating a long only if it sustains above ₹1,310 with good volume.
Upside potential: ~8–15% (₹1,360 to ₹1,415, and possibly ₹1,500).
Stop-loss: Below ₹1,245 on a closing basis (or tighter at ₹1,275 if risk needs to be managed).
This is a medium-term swing trade opportunity.
🛄 Disclaimer: This idea is posted solely for educational and learning purposes only and must not be construed as advice to buy or sell. Please consult your investment advisor before making any financial decision. Investments are subject to market risks.
Paradeep HIGH MOMENTUM STOCKParadeep is in consolidation phase with low volume . its a high momentum stock . it may give breakout in coming days . so keep tracking it. ADD it in ur watchlist

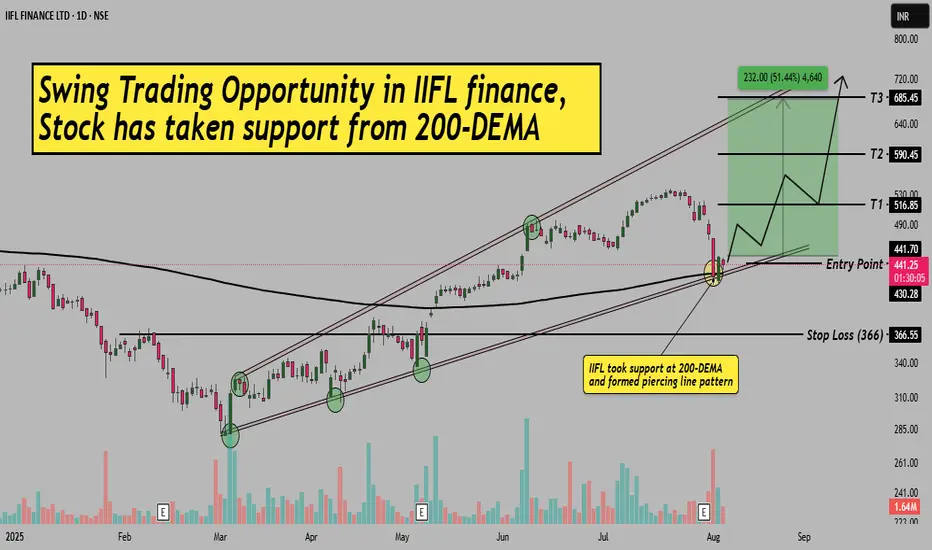
IIFL Finance–Swing Setup from 200-DEMA Support & Piercing Line!Hello Everyone, I hope you all are doing well in life and in trading!
Today I’ve brought a fresh swing trading opportunity in IIFL Finance , where the stock has taken support from the 200-EMA and is formed a bullish Piercing Line pattern.
After a strong uptrend, the stock corrected and has now taken trendline support (from channel base) along with the 200-day EMA confluence, a high-probability reversal zone. A clear bullish candle indicates a potential bounce from here.
The best part? The stock still offers a great risk-reward with defined entry, stop-loss, and 3 possible targets. Please refer to the chart for full trade setup details.
This setup is purely based on price action, moving average confluence, and support zone behavior.
If you are a swing or positional trader, this setup is worth keeping on your radar!
If you found this helpful, don’t forget to LIKE & FOLLOW for more such clean technical ideas.
Disclaimer: This idea is for educational purposes only. Always do your own research before taking trades.
APTUS Swing Trade (20% upside)Simple swing trade setup based on institutional buying footprint.
No indicators, no silly chart patterns.
Pure buyer/seller psychology and trend based setup.
Risk Management for setups like these:
This is a high probability setup. The only thing to take care of is the position sizing in case the overall market ( Nifty ) is bearish for some weeks. Decrease position and increase SL size to maintain your Risk. Have patience.
Message me for more such setups and learning insights and to know how to find such setups and properly ride the complete trend fors trades like these.
Risk Reward for these setups are very good so you have to manage the risk before the next up-trend move kicks in. Part of the game.
Any question or want to have any convo over stock market ? Do message. Happy to help and connect with fellow traders.
Thanks.
Gaurav

JINDALSTEL : pattern breakout#JINDALSTEL #patterntrading #chartpatternbreakout #swingtrading
JINDALSTEL : Swing Trading
>> Breakout soon
>> Inverse Head & Shoulder pattern
>> Good Strength & Volumes Buildup
>> Trending setup
Swing Traders can lock profits at 10% and keep Trailing
Pls boost, Comment & Follow for more Analysis
Disc : Charts shared are for Learning purpose and not a Trade recommendation. Pls consult your Financial Advisor or a SEBI Registered Advisor before taking position in it

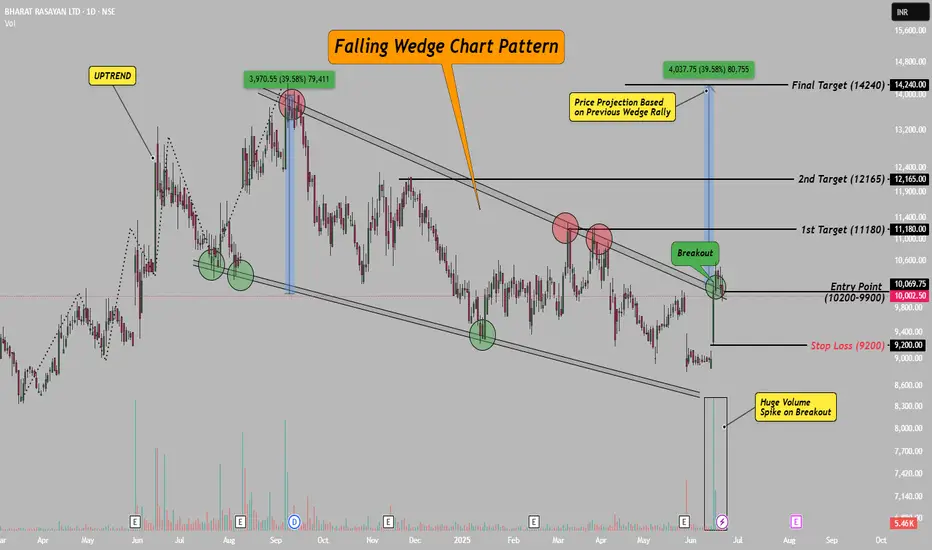
Bharat Rasayan–Falling Wedge Breakout with 39% Upside Potential!Hello Everyone, i hope you all will be doing good in your life and your trading as well! Today i have brought a post which is on Bharat Rasayan – a classic case of a falling wedge breakout.
After staying in a falling wedge pattern for nearly 10 months, the stock has finally broken out with a strong bullish candle and a clear volume spike. This breakout zone (9900–10200) also aligns with the downtrend line, making it even more valid.
The best part? This has participated in rally yet, means there is a lot remain in this stock, please check chart above for entry, stop loss and targets.
This setup is based on price action, chart structure, and previous pattern behavior. If you’re a swing or positional trader, this one’s worth watching!
If you liked this idea, don’t forget to LIKE & FOLLOW for more clean, technical setups.
Disclaimer: This idea is for educational purposes only. Do your own research before taking any trade.
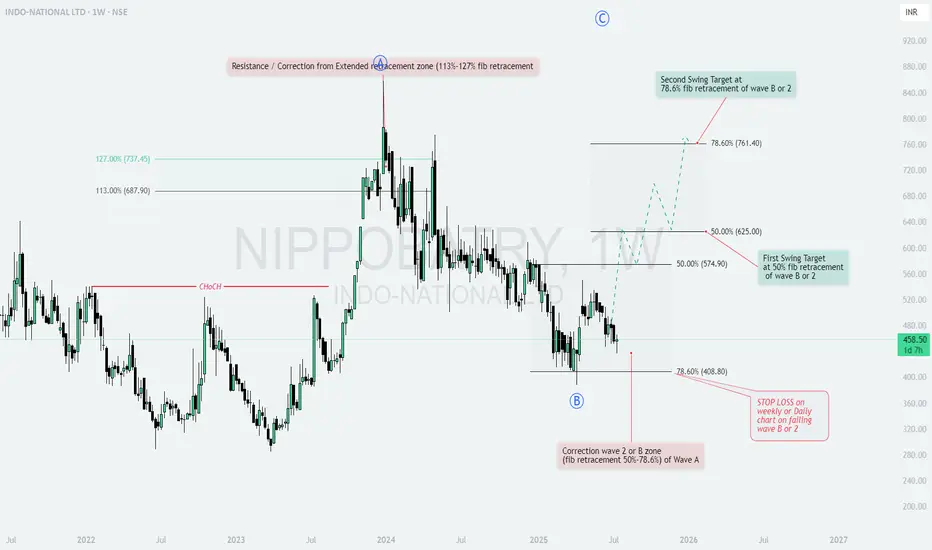
NIPPONIND : is correction over on Wave 2 or B?INDO-NATIONAL LTD (NSE: NIPPONIND) 🚀
Weekly Chart Analysis – Potential Swing Opportunity!
1. Structure & Setup
The stock has completed a major correction in the zone of 50%-78.6% Fibonacci retracement of Wave A (408.80–458.50).
Wave B or 2 seems to be in place, setting up for a potential bullish move.
Previous resistance and correction occurred from the extended retracement zone (113%-127% fib).
2. Key Levels & Targets
First Swing Target: 50% fib retracement of Wave B or 2 at ₹574.90–625.00 🥇
Second Swing Target: 78.6% fib retracement of Wave B or 2 at ₹761.40 🥈
Support: 78.6% fib retracement of Wave A at ₹408.80
3. Risk Management
STOP LOSS: On weekly or daily close below the correction zone (failing Wave B or 2), i.e., below ₹408.80 🚨
4. Observations & Strategy
1️⃣ Chances of a bullish reversal are high from the current zone, supported by fib retracement confluence.
2️⃣ Watch for a breakout above ₹500 for confirmation of momentum.
3️⃣ Risk/Reward is favorable for positional swing traders.
Summary:
A strong setup for a multi-month swing! Monitor price action near support and trail your stop as the move unfolds. 📈
Like & Follow for more setups! 👍✨
#NIPPONIND #SwingTrade #TechnicalAnalysis #Fibonacci #TradingView #Stocks #NSE
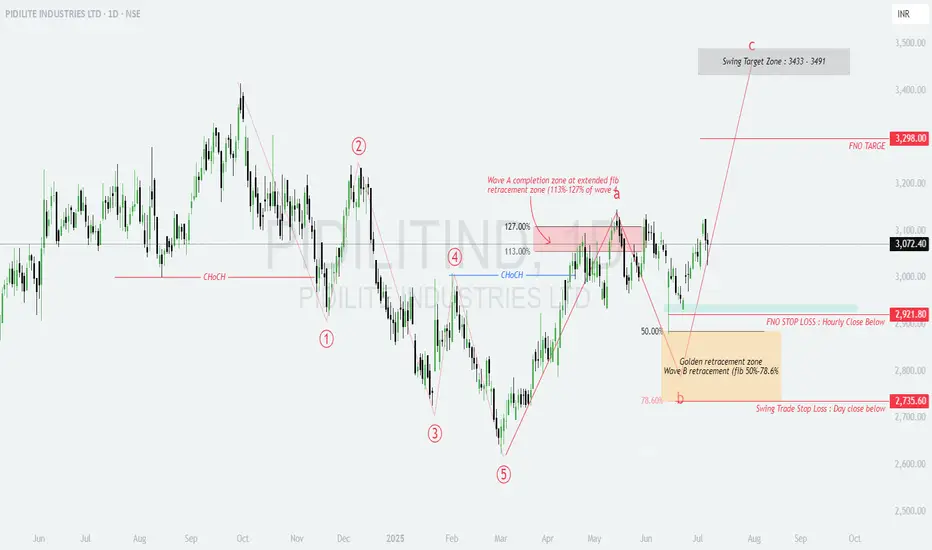
Hidden in Plain Sight – This PIDILITE Setup Screams Opportunity!📊 PIDILITE – Post 5-Wave Fall, ABC Recovery In Progress
Golden Fib confluence + strong structure = high-confidence swing setup
Wave structure aligns with ideal retracements; Wave C potential unfolding with swing targets ahead.
🧩 Elliott Wave Breakdown:
Complete 5-wave decline from swing highs → Wave 5 bottom confirmed
Wave A completed at extended fib zone (113%–127% of wave a)
Wave B retraced to Golden Zone: 50%–78.6% of Wave A
Wave C now progressing toward swing target zone
🔍 Technical Confluences:
Wave A Completion: ₹3130–₹3180 (113–127% extension)
Wave B Golden Zone: ₹2735–₹2921
Strong bullish rejection and follow-through from Wave B lows
CHoCH break confirms trend reversal from Wave 5 low
🎯 Target Zone for Wave C:
Primary Swing Target: ₹3433–₹3491
FNO Upside Level: ₹3298
🛑 Stop-Loss Levels:
Intraday SL: Hourly close below ₹2921.80
Positional SL: Day close below ₹2735.60
📈 Setup Summary:
Clear ABC corrective recovery in play
Ideal Fib alignment at both Wave A and B
Structure favors low-risk, high-reward long opportunity
Entry near ₹3070–3080 offers excellent positioning
A technically sound swing setup with defined structure and reward zones – great candidate for Wave C riders.
#Pidilite #ElliottWave #SwingSetup #WaveTheory #Nifty200 #TradingViewIndia
BRITANNIA INDUSTRIES LTD. – TECHNICAL INSIGHT________________________________________________________________________________
📊 BRITANNIA INDUSTRIES LTD. – TECHNICAL INSIGHT
📆 Date: July 8, 2025 | 🕒 Daily Chart
📍 Symbol: NSE: BRITANNIA
💡 Educational Breakdown – For Study & Learning Only
________________________________________________________________________________
🔹 Price Action Overview:
Britannia closed at ₹5,884.00, up by +1.95%, forming an “Above the Stomach” bullish continuation pattern just below a key resistance zone.
________________________________________________________________________________
🔴 Top Range (Resistance): ₹5,899.50
📉 Bear Strength: 53
The price has approached a previous supply zone where sellers have shown resistance. Watch this level closely for either a breakout or rejection.
________________________________________________________________________________
🟢 Bottom Range (Support): ₹4,506
📈 Bull Strength: 77
This zone acted as a strong demand base in the past, initiating a rally with a sharp volume spike.
________________________________________________________________________________
🔍 Pattern Focus: Above the Stomach
A bullish candle has opened above the midpoint of the previous red candle, suggesting buyer strength. This often signals momentum continuation, especially near breakout levels.
________________________________________________________________________________
🎯 What to Watch For:
✅ Breakout Confirmation Zone:
If price closes decisively above ₹5,900 with volume expansion, it may indicate strength and fresh upside continuation.
________________________________________________________________________________
🚫 Failure Zone:
If price faces rejection near ₹5,900–₹5,920 and forms a bearish engulfing or strong upper wick, short-term profit booking could occur.
________________________________________________________________________________
📌 Risk Management Tip:
Traders typically look for entry above breakout candle high with a stop below recent swing low or candle low. Volume confirmation is essential before considering directional bias.
________________________________________________________________________________
🔍 Contextual Takeaway:
This is a textbook example of price consolidating just below a resistance after a strong trend and forming a bullish candle setup. A breakout or failure here can define the next leg of the move.
________________________________________________________________________________
📚 Stay objective, wait for confirmation, and let the price lead.
________________________________________________________________________________
Entry Above ₹5,905–₹5,920 (on breakout)
Stop Loss ₹5,765
Risk Reward 1:1 | 1:2 +
________________________________________________________________________________
⚠️ Disclaimer:
This analysis is for educational purposes only.
STWP is not a SEBI-registered advisor.
No buy/sell recommendations are made.
Please consult your financial advisor before trading.
STWP is not responsible for trading decisions based on this post.
________________________________________________________________________________
What’s your view on BRITANNIA ? Comment below ⬇️
🔁 Share this if you're tracking the stock
✅ Follow STWP for clean Price Action + Candlestick patterns
🚀 Be Self-Reliant | Trade with Patience | Learn with Logic
________________________________________________________________________________

Kriti Industries Long📢 Kriti Industries – Bullish Alert
Kriti Industries has delivered a decisive breakout from a well-defined consolidation range, backed by rising volume and strong price structure—indicating the start of a fresh uptrend.
🔍 Price Action & Volume Signals:
✅ Tight consolidation resolved with a strong bullish candle—clear sign of accumulation.
✅ Volume expansion on breakout day shows participation by smart money.
✅ Forming a higher high–higher low structure, indicating trend reversal.
✅ No supply pressure at breakout zone—suggests strength and buyer dominance.
✅ Clean breakout above previous swing high confirms shift in momentum.

BDL | Long | Swing Setup | Wave AnalysisBDL is either in Wave C of abc
or Wave 3 of 1-5 as shown in chart
both cases suggest a bullish up-move towards target one in case of wave C and towards target 2 in case of wave 3.
SL would be 1090- 1130 zone. If looks weak in this zone we will exit.
Increasing volume suggests a good momentum long setup.
Just my 0.02$

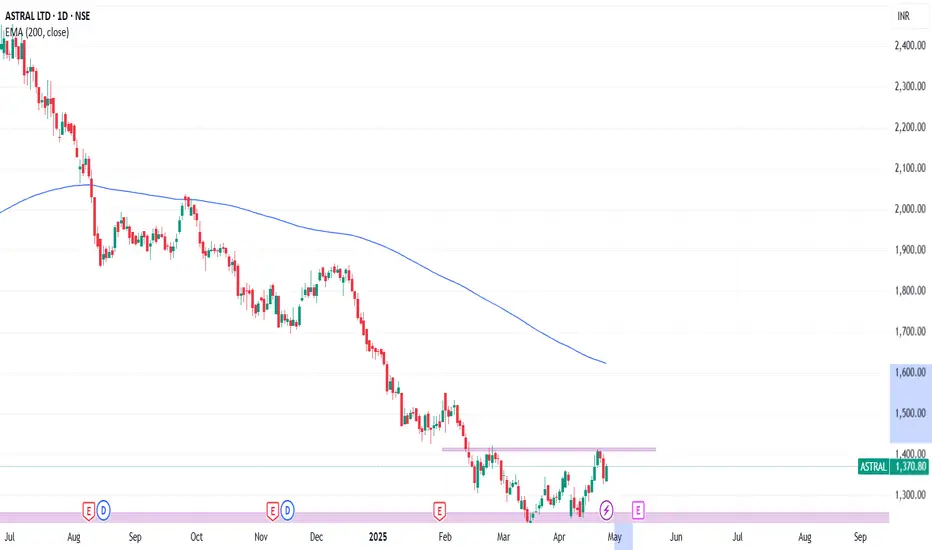
SWING IDEA for ASTRAL LTD for upto 10% to 50% in coming days. As the weekly and daily TF were in down trend but it seems like bottom has been formed with the confirmation of double bottom on weekly TF and can be traded either after breakout or another confirmation of the triple bottom confirmation at the trend lines.
#HAPPYTRADING # SWINGTRADING #SWINGIDEAS
this is pure technical analysis.
Waaree Energies | Bullish SetupWaaree Energies is Either in 4th of C wave or 1/A of Reversal Wave.
In both cases price is expected to move up.
Not a buy/sell recommendation. Just an opinion or personal view based on knowledge of Elliot wave analysis. I do not guarantee and profits/returns.

POWER GRID SWING TRADEPOWER GRID Swing Trade
Hi This Flip Zone we can see buying from this level 328.5 i taken entry
Towards 1st Target - 345 2nd Target - 363
Seller will come if breaks 322 level the its fail accrdoing to SMC
Note - Only for Education purpose . Do your own research.

2 Amazing swing trading ideas for 11 Dec 2024 MarketsI daily make educational content videos for swing / positional trading

Swing Current Price: The stock is trading at ₹4,469.65, up ₹235.50 (5.56%) for the day, indicating strong bullish momentum.
Trendline Breakout:
The stock has broken out of a downward-sloping trendline (orange line), suggesting a reversal of the recent downtrend.
Support Levels:
Strong support exists at ₹3,879.00 (blue horizontal line), which has held multiple times during previous pullbacks.
Targets:
1st Target: ₹4,914.70 (green horizontal line), representing the next resistance zone.
2nd Target: ₹5,559.40 (black horizontal line), a higher resistance level and potential target.
Volume Analysis
The breakout is supported by increasing volume, which strengthens the case for bullish continuation.
Conclusion
Bullish View: The breakout from the trendline with strong volume indicates that the stock might move toward its 1st target of ₹4,914.70 and potentially to ₹5,559.40 if momentum continues.
Bearish Risk: A failure to sustain above the breakout level could lead to a retest of the ₹3,879.00 support.
This chart suggests a bullish trend with clear targets for traders to watch.

Swing The orange line represents a descending trendline connecting the highs of previous price points. When the price breaks above this line, it indicates that selling pressure may be weakening, and buyers are gaining control.

EXIDEIND swing trade IdeaEXIDEIND is an uptrend stock. It broke trendline with good volumes.
Can take a swing trade with a target of recent high.
Stoploss is given for safe trader and aggresive trader.
Positions to be taken with proper risk management only.
Note : No idea about its Fundamentals and should always consider market breadth while taking swing trades.

IIFLSEC : Momentum Stock#IIFLSEC #tws #FVG #breakout #trendingstock
IIFLSEC : Swing Trade
>> TWS & FVG Visible
>> Bounce back from FVG
>> Trending setup
>> Good Strength & Volumes
>> Low PE Stock
Swing Traders can lock profit at 10% & keep Trailing
Please give a Boost or comment if u r Liking the analysis & Learning from it. Keep showing ur Love by following
Disclaimer : This is not a Trade Recommendations & Charts/ stocks Mentioned are for Learning/Educational Purpose. Do your Own Analysis before Taking positions.

Bullish Swing Trading Setup in HAVELLS INDIA LTD
Today Havells performed well after breaking it's major resistance of 15 minutes.
My expectation is bullish for few trading sessions but only after a retracement.
If Price retrace then I will have bullish overview for a swing, so it's better find bullish opportunity for upswing. If price sustain above previous resistance which can act as a support.
This is just a overview, I am not recommending to buy or sell. This information is just for educational purposes, remember I am not SEBI REGISTERED
