STWP Analysis | ICICI Bank Showing Classic Breakout Behavior________________________________________
💼 ICICI BANK (NSE: ICICIBANK) | CMP ₹1436.60 (+1.36%)
Sector: Banking & Financial Services | Date: 19 Oct 2025
________________________________________
📊 Chart Summary
ICICI Bank closed strong at ₹1436.60, gaining +1.36% from its previous close of ₹1417.30.
Price made a high of ₹1439.60 — exactly around the Fibonacci resistance zone of ₹1439.85.
Volumes surged to 1.76x the average, with 1.70 crore shares traded against an average of 1.35 crore — indicating strong participation and renewed interest.
________________________________________
🟡 Technical Indicators Summary (Yellow Label Insight)
The chart highlights Bullish Momentum supported by a Strong Bullish Candle, indicating renewed buying interest.
A clear RSI breakout (68.36) confirms strengthening momentum, while the Bollinger Band breakout signals expanding volatility — often a precursor to a sharp directional move.
MACD at 8.33, CCI at 203.06, and Stochastic at 96.91 collectively point to short-term strength, while VWAP at 1427.77 serves as immediate support.
This confluence of volume + structure + volatility aligns perfectly for a potential breakout continuation.
________________________________________
📈 Price Action & Key Levels
The stock has been moving within a base range of ₹1342.6 – ₹1500, and has now approached the upper resistance band.
Immediate Resistance: 1447 / 1458 / 1476
Immediate Support: 1418 / 1400 / 1390
VWAP: 1427.77
A sustained close above 1439.60–1440 can confirm a bullish breakout, with upside potential toward 1466.30 → 1500 zone.
________________________________________
🧭 STWP Trade Analysis
Bias: Bullish
Breakout Level: Above 1439.60
Intraday Support: 1428
Swing Support: 1384
Intermediate Support: 1342
Momentum: Moderate
Trend: Bullish
Risk: Low
Volume: High
📌 Observation: The candle structure suggests a “volume-backed breakout” that may see short-term profit-booking near 1447 but remains structurally bullish if above VWAP.
________________________________________
🧾 Quick View: Q2 FY26 Results Snapshot
ICICI Bank reported a 5% YoY rise in PAT to ₹12,359 crore, supported by a 7.4% rise in Net Interest Income (₹21,529 crore) and improved asset quality.
Lower provisions and healthy loan growth kept the bottom line stable, while core operating profit rose 6.5% YoY.
With a clean balance sheet and improving credit metrics, the results complement the ongoing bullish technical setup — reinforcing confidence in trend continuation.
________________________________________
🧩 Final Outlook
ICICI Bank exhibits bullish momentum with low-risk positioning.
The current move represents a technical + fundamental confluence breakout, supported by strong volumes and improving financial health.
Traders may watch for price action near 1439–1447 zone for confirmation and potential swing continuation toward ₹1500 in the coming sessions.
________________________________________
🧠 Learning Note (Educational Purpose)
This setup perfectly demonstrates how volume expansion + momentum oscillator alignment + earnings strength often precedes meaningful breakouts in large-cap banking stocks.
Always track VWAP & RSI stability post-breakout — they often determine whether the move sustains or fades.
________________________________________
⚠️ Disclosure & Disclaimer (SEBI-Compliant)
This content is created solely for educational and informational purposes to help readers understand technical analysis and market structure.
It does not constitute investment advice, research recommendation, or a solicitation to buy or sell any security.
The author is not a SEBI-registered investment adviser or research analyst.
All charts, patterns, and levels are based on personal study and historical data available from public sources such as TradingView and NSE India.
Position Status: No active position in ICICIBANK at the time of publication.
Trading and investing involve risk. Market movements can be unpredictable, and losses may exceed invested capital.
Readers are strongly advised to consult a SEBI-registered investment adviser before making any trading or investment decisions.
By engaging with this post, you acknowledge that you take full responsibility for your own trades, decisions, and outcomes.
________________________________________
💬 Found this useful?
🔼 Boost this post to support structured learning content.
✍️ Share your thoughts, questions, or observations — let’s grow together!
🔁 Share with learners and traders to promote responsible market education.
👉 “If you liked this breakdown, follow for more disciplined, educational trade setups.”
🚀 Stay Calm. Stay Clean. Trade With Patience.
Trade Smart | Learn Zones | Be Self-Reliant 📊
Swingtrade

M&M Breaks Out with Volume Support | Structure Meets Momentum________________________________________
🚙 MAHINDRA & MAHINDRA LTD (NSE: M&M) | CMP ₹3,647.20 (+2.43%)
Sector: Auto | Date: 19 Oct 2025
________________________________________
🔹 Price Action:
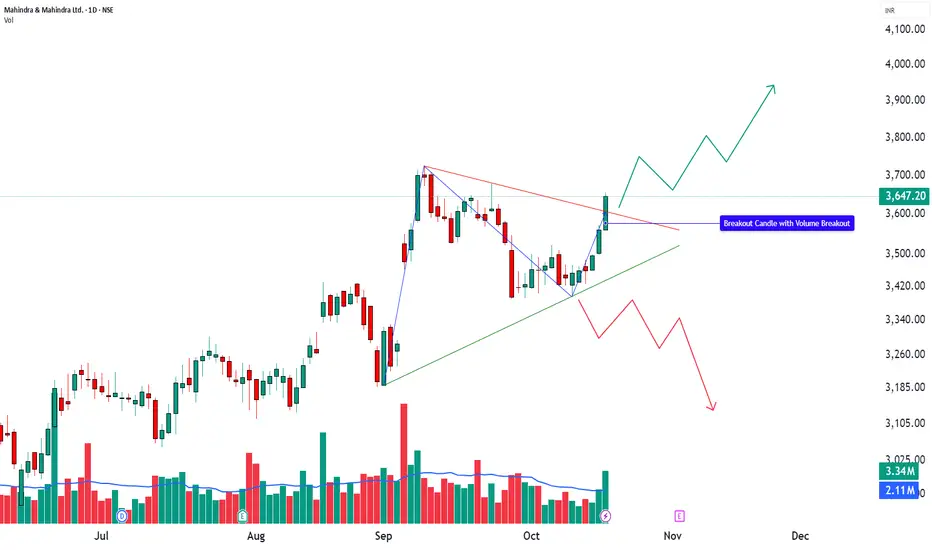
M&M posted a strong bullish candle, closing near day’s high at ₹3,647.20 with gains of +2.43%.
Volume surged to 3.34M shares, nearly 2.2× the 20-day average volume (2.10M) — a clear sign of institutional and HNI participation.
The stock confirmed a bullish breakout above ₹3,656, marking a shift from a phase of consolidation to one of expansion.
________________________________________
🔹 Technical Analysis:
Momentum indicators are clearly aligned in favour of the bulls, confirming strength across multiple parameters. RSI (65.55) has broken above its midline, signalling momentum expansion, while MACD (9) shows a positive crossover that reinforces directional conviction. CCI (129.03) reflects sustained trend acceleration, and though Stochastic (96.65) remains in overbought territory, it supports ongoing breakout momentum. The VWAP at ₹3,629.84 acts as an immediate dynamic support, maintaining short-term control with buyers. Additionally, a Bollinger Band breakout accompanied by a BBSqueeze-Off indicates expanding volatility — often a precursor to a strong continuation phase when combined with rising volume and structural breakout confirmation.
________________________________________
🔹 Chart Analysis:
M&M broke out from a symmetrical triangle structure, ending a multi-week consolidation phase.
The breakout candle formed with a wide body and heavy volume, closing near the high — a typical sign of breakout conviction.
Price structure shows higher lows and rising volume, confirming trend continuation rather than exhaustion.
________________________________________
🔹 Key Levels:
Resistance: 3,682 / 3,717 / 3,778
Support: 3,586 / 3,525 / 3,490
VWAP: 3,629.84
A short-term pullback toward VWAP or ₹3,586 could act as a healthy retest before continuation.
Holding above ₹3,525 will keep the structure intact, maintaining bullish control.
________________________________________
🔹 STWP Trade Analysis:
Bias: Bullish
Breakout Level: ₹3,656
Intraday Support: ₹3,619
Swing Support: ₹3,456
Intermediate Support: ₹3,421
Momentum: Strong
Trend: Bullish
Risk: Low
Volume: High
📌 Observation: The breakout candle supported by rising volume and MACD confirmation signals a trend continuation setup with clearly defined risk zones.
________________________________________
🔹 HNI Trade Setup:
Fresh HNI accumulation seen around ₹3,647–₹3,656, supported at ₹3,501, and additional buying interest visible near ₹3,639 with support at ₹3,475.
This structure indicates layered accumulation, suggesting that larger players are positioning within the consolidation rather than chasing price above resistance.
________________________________________
🔹 Final Outlook:
Momentum: Strong | Trend: Bullish | Risk: Low | Volume: High
M&M’s structure indicates a breakout-driven continuation phase backed by volume and indicator alignment.
As long as price holds above ₹3,525, the trend bias remains bullish, with scope for upside toward ₹3,717–₹3,778 in the near term.
A dip toward VWAP or EMA supports would represent healthy price normalization, not weakness.
________________________________________
🔹 Learning Note (Educational Purpose):
This setup showcases how volume + structure + indicator confluence confirms a genuine breakout.
It also demonstrates how smart money accumulates during compression, not after expansion — a crucial lesson for breakout traders.
M&M provides a textbook example of how post-consolidation breakouts evolve into expansion phases.
________________________________________
🔹 STWP Mentor Note:
“Momentum isn’t about chasing; it’s about recognizing conviction early.
M&M’s breakout is a fine example of structure, participation, and patience working in perfect rhythm — where price doesn’t just move, it evolves with purpose.”
________________________________________
───────────────────────────────────────────────
⚠️ **DISCLOSURE & DISCLAIMER (SEBI-Compliant)**
───────────────────────────────────────────────
📘 **Purpose:**
This content is created **solely for educational and informational purposes** to help readers understand market structure, price action, and technical analysis.
It does **not constitute investment advice**, research recommendation, or a solicitation to buy or sell any security.
👤 **Author Disclosure:**
The author is **not a SEBI-registered investment adviser or research analyst.**
All chart studies, price levels, and observations are based on publicly available data (e.g., **NSE India**, **TradingView**) and are presented purely for **learning illustration**.
📊 **Position Status:**
No active position in * * at the time of publication.
“The author may sometimes trade in the securities discussed, but such trades are independent and shared here only for educational understanding.”
⚠️ **Risk Disclosure:**
Trading and investing involve financial risk. Market movements can be unpredictable, and losses may exceed invested capital.
Readers are strongly advised to consult a **SEBI-registered investment adviser** before making any trading or investment decisions.
🧠 **Responsibility Clause:**
By engaging with this post, you acknowledge that you are **solely responsible for your own trading or investment decisions**, and that this content is intended only for **market education and awareness**.
───────────────────────────────────────────────
💬 **Did You Find This Useful?**
If this analysis helped you understand price structure or market psychology better:
🔼 **Boost** to support transparent & structured financial education.
✍️ **Comment** your insights, observations, or questions — let’s learn together.
🔁 **Share** this post with learners and aspiring traders who value discipline.
📚 **Follow @STWP** for more structured, educational breakdowns on stocks & setups.
🚀 *Stay Calm. Stay Clean. Trade With Patience.*
💡 *Trade Smart | Learn Zones | Be Self-Reliant.*
───────────────────────────────────────────────
Nifty respects key support - Bulls are back?Market Context :
Global equities are showing mixed movement but Indian markets showed good recovery after RBI's announcement.
Chart Analysis :
Nifty respected key support level of 24600 and bounced back. If the indicated swing is safe we can see more upside momentum. 25000 can be a deciding levels for upside confirmation and will act as good support once broken.
Personally chart looks good for a W shaped recovery. If bullish scenario plays out and 24600 level is safe we can probably see nifty trading at 25300/25400.
Key Levels :
Support : 24580/24620-650 zone
Resistance : 25000/25090/25180/25300
Conclusion:
Nifty50 bounced from key support. Clean move with good volumes can open room for recovery upto 25400 being 24600 as a major support.
Disclaimer:
I am not SEBI registered. This analysis is for educational purposes only and not investment advice. Please do your own research before trading or investing.

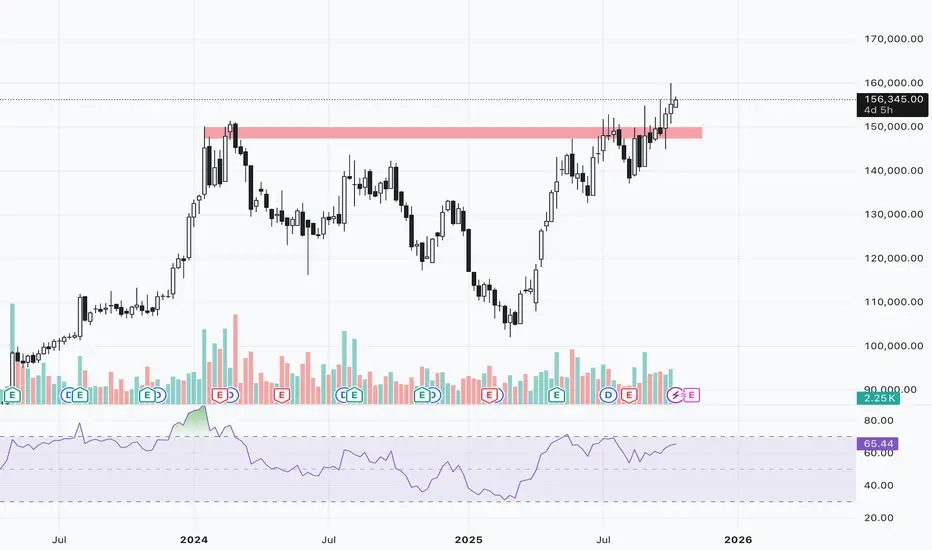
MRF Breakout Swing CandidateChart Analysis :
The stock has broken out above the all time high resistance and major psychological level of 150000 and is sustaining above the zone. A long position can be considered around 156500 zone.
Key Levels :
Entry : 156350-156500
Targets : 160000/163170
Stop-Loss : 152500 below day tf close
Disclaimer:
I am not SEBI registered. This analysis is for educational purposes only and not investment advice. Please do your own research before trading or investing.
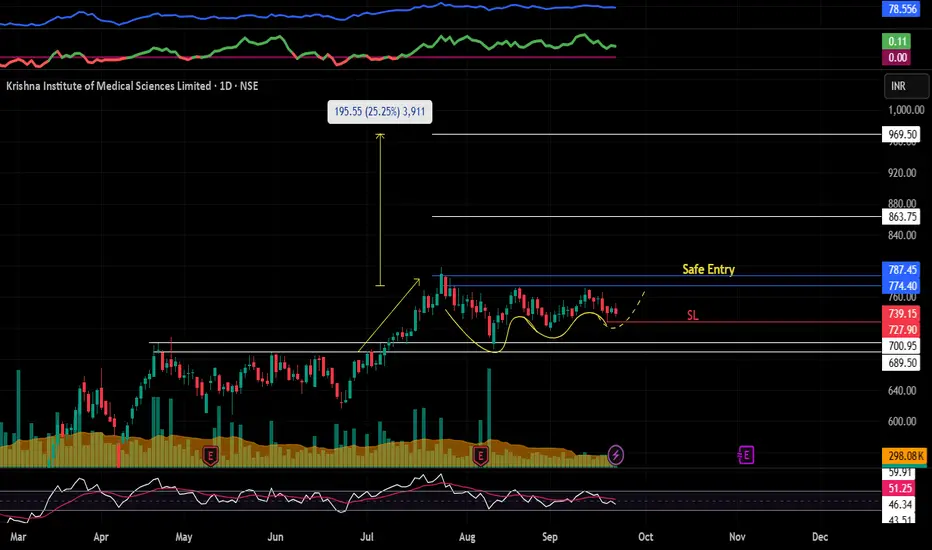
KIMS : Devloping VCP pattern structure#KIMS #vcppattern #vcpbreakout #swingtrading #momentumtrading
KIMS : Swing Trade / Short term
>> Trending Stock
>> VCP pattern developing
>> Volumes Picking up
>> Low Risk High Reward Trade
Swing Traders can lock profit at 10% and keep Trailing
Please Boost, comment and follow us for more Learnings.
Disc : Charts shared are for learning purpose only, not a Trade recommendation. Do your own research and consult your financial advisor before taking any position.
Agri Infra Ltd (AGIIL) : Breakout soon Stock#AGIIL #breakoutstock #swingtrade #trendingstock #momentumstock
AGIIL : Swing trade
>> Breakout candidate
>> Trending setup stock
>> Good Volumes & strength in stock
>> Low Risk high Reward setup
Swing Traders can lock profit at 10% and keep Trailing
Please Boost, comment and follow us for more Learnings.
Disc : Charts shared are for learning purpose only, not a Trade recommendation. Do your own research and consult your financial advisor before taking any position.

CENTURYPLY : Swing Pick#CENTURYPLY #swingtrade #swingtrading #trendingstock
CENTURYPLY : Swing trade
>> Breakout Soon
>> Trending Stock
>> Good Strength & Volumes
>> Low Risk Setup
Swing Traders can lock profit at 10% and keep Trailing
Please Boost, comment and follow us for more Learnings.
Disc : Charts shared are for learning purpose only, not a Trade recommendation. Do your own research and consult your financial advisor before taking any position.

Krilosbros | Positional tradeKrilosbros after respecting daily Order Block is consolidating and making HLs and positive orderflow. From CPM Krilosbros can easily give a 20% move,
Key Levels:
Entry: One can make entry at CMP(2050)
SL: Ideal stop loss for this entry would be 1947 levels
Targets: 1st target would be 2475 i.e 20% and 2690 ie 30%.
Note: Consult your financial advisor before making any position in any assets.
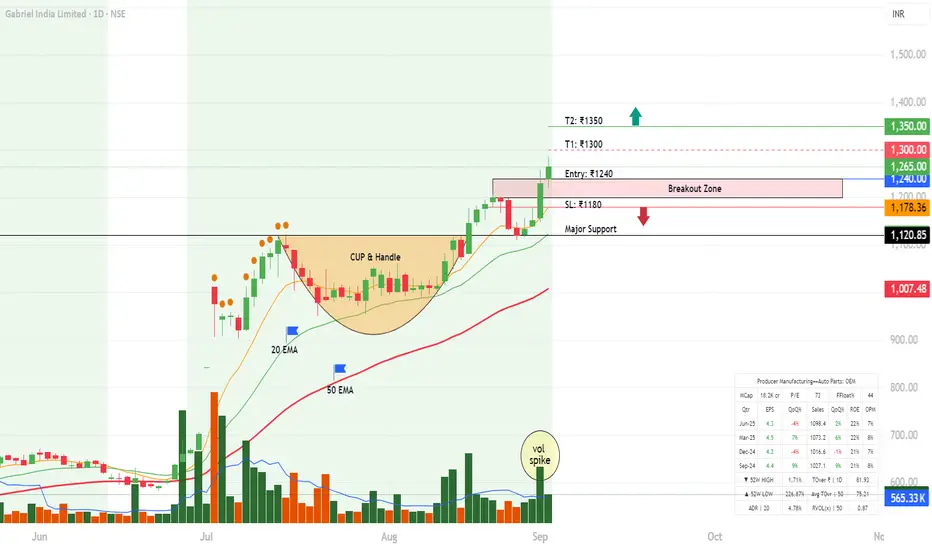
Gabriel India Ltd | Textbook Cup & Handle Breakout | Swing TradeGabriel India has formed a classic Cup & Handle pattern on the daily timeframe and given a decisive breakout above ₹1200 with strong volumes.
This indicates institutional accumulation and signals the start of a potential bullish leg.
Technical Analysis
Pattern: Cup & Handle → bullish continuation
Breakout Zone: ₹1200–1240 (now acting as strong support)
Current Price: ₹1265 (close as of 02 Sep 2025)
Volume: Noticeable spike, validating breakout strength
EMA Setup: Price trending above 20EMA (₹1178) & 50EMA (₹1123) → trend intact
Fundamental Key Area
Sector: Auto Ancillary (OEM supplier – suspension systems)
Market Cap: ~₹18,200 Cr (Mid-cap)
P/E: ~73 → premium valuation, market pricing in growth
Recent EPS: ₹4.3 (Jun-25) → steady growth
Sales Growth: +22% YoY (Jun-25) → consistent performance
Operating Margin: ~8% → stable margins for auto sector
Trade Plan
Entry Zone: ₹1240–1265 (CMP or on dips)
Stop-Loss: ₹1180 (below handle support & 20EMA)
Targets:-
T1: ₹1300 (Partial booking) (expected timeline 1-2 weeks)
T2: ₹1350 (Extended move) (expected timeline 2-3 weeks)
RR ≈ 1:1.8 → Favourable setup
Note: This analysis is shared purely for educational and informational purposes based on chart patterns and publicly available data. It should not be considered as investment advice. Please do your own research or consult a financial advisor before making trading decisions.
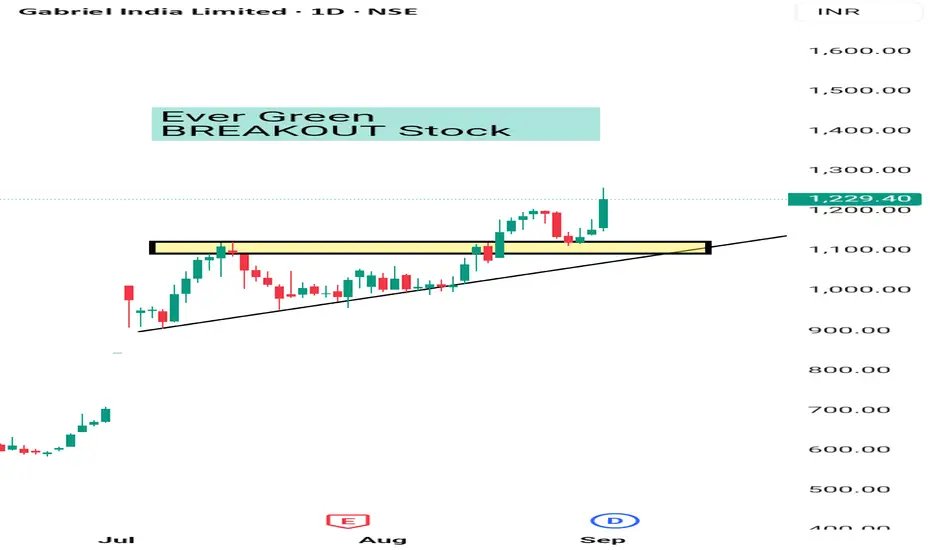
GABRIEL INDIA BULLISH CHART Gabriel India is a Strong Fundamental Company in Auto Component Sector . It's Technically also Breakout. It's a Uptrend Stock And moving Up with Sector and on basis of Gst Cut . Good bet for swing trading as well as long term . In swing trading u can expect 5 -6% move and in long term 20-30% move in next 6 months . No buy sell Reccomendation just for educational purposes only.
Always consult your financial advisor before making any position in stock market.
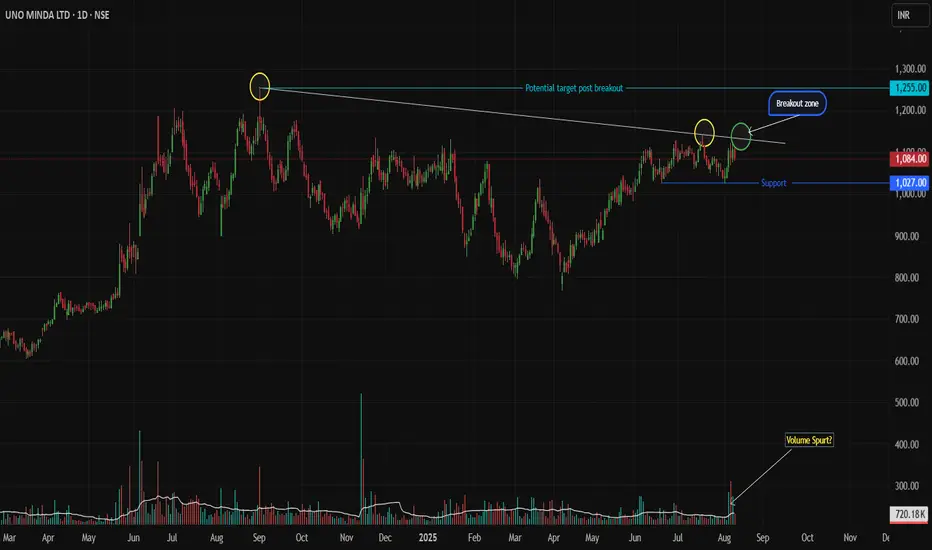
Uno Minda: Triple Trendline Test - Breakout or Pullback Setup Uno Minda Price Action Setup
(Daily Timeframe | Pure Price Action + Volume)
Key Structure
Resistance Trendline: Tested twice (02-Sep-2024 & 17-Jul-2025). Price now approaches it for the 3rd attempt.
Support Zone: Strong base at 1027 (recent swing low).
Long-Term Trend: Bullish (higher highs/lows).
Trade Scenarios
SCENARIO 1 : Trendline Breakout
Trigger:
Daily breakout candle closes above the resistance trendline.
Candle must be strong bullish (full-bodied green) with volume > 20-day average.
Entry: On confirmation of breakout (next candle open/close above breakout candle’s high).
Stop Loss: Low of the breakout candle.
Targets:
First: 1255 (take partial profits).
Trail balance with trailing SL (e.g., below recent swing lows).
SCENARIO 2 : Pullback to Support
Trigger:
Price retests 1027 support, followed by a strong bullish reversal candle (e.g., Bullish Engulfing/Hammer) with rising volume.
Entry: After reversal candle closes (confirmation).
Stop Loss: Below the low of the reversal candle.
Targets:
First: 1130 (take partial profits).
Trail balance aggressively.
Risk Management
Position Size: Risk ≤ 1% capital per trade.
Avoid chasing: Enter only on confirmed triggers.
Invalidation: Exit if price closes below SL levels.
Disclaimer
This idea is educational only. Not financial advice. Trading carries high risk. Past performance doesn’t guarantee future results. Always test strategies in a demo account. Consult a financial advisor before trading.
Boost 👍 if helpful! Comment below for other stocks you want analyzed.
Keep it price-driven. Trade safe! 💡
Breakout or Support? How to Decode a Stock’s True BehaviorIn this video I will show a Smarter Way to Read Charts, Breakout vs Support — The Fine Line Every Trader Must Know .
Disclaimer: This video is for educational purposes only and is based on historical charts. It is not financial advice. Please consult a registered advisor before making any trading decisions.

Psychology & Risk Management in Trading 1. Introduction
Trading is often thought of as a purely numbers-driven game — charts, technical indicators, fundamental analysis, and economic data. But in reality, the true battlefield is inside your head. Two traders can have access to the exact same market data, yet end up with completely different results. The difference lies in psychology and risk management.
Psychology determines how you make decisions under pressure.
Risk management determines whether you survive long enough to benefit from good decisions.
Think of trading as a three-legged stool:
Strategy – Your technical/fundamental system for entering and exiting trades.
Psychology – Your ability to stick to the plan under real conditions.
Risk Management – Your safeguard against catastrophic loss.
If one leg is missing, the stool collapses. A profitable strategy without psychological discipline becomes useless. A strong mindset without proper risk controls eventually faces ruin. And perfect risk management without skill or discipline simply results in slow losses.
Our goal here is to align mindset with money management for long-term success.
2. Understanding Trading Psychology
2.1. Why Psychology Matters More Than You Think
When you’re trading, money is not just numbers — it represents:
Security (fear of losing it)
Freedom (desire to win more)
Ego (feeling smart or dumb based on market outcomes)
This emotional attachment creates mental biases that cloud judgment. Unlike a chessboard, the market is an uncertain game — the same move can lead to a win or loss depending on external forces beyond your control.
The primary enemy is not “the market,” but you:
Closing winning trades too early out of fear.
Holding onto losing trades hoping they’ll recover.
Overtrading to “make back” losses.
Avoiding valid setups after a losing streak.
2.2. The Main Psychological Biases in Trading
1. Loss Aversion
Humans hate losing more than they like winning. Research shows losing $100 feels twice as bad as gaining $100 feels good.
In trading, this causes:
Refusing to take stop losses.
Adding to losing positions to “average down.”
2. Overconfidence Bias
After a streak of wins, traders often overestimate their skill.
Example: Turning a $1,000 account into $2,000 in a week might lead to doubling trade size without a valid reason.
3. Confirmation Bias
Seeking only information that supports your existing view. If you’re bullish on gold, you might only read bullish news and ignore bearish signals.
4. Recency Bias
Giving too much weight to recent events. A trader who just experienced a big rally might expect it to continue, ignoring long-term resistance levels.
5. Fear of Missing Out (FOMO)
Jumping into trades without proper analysis because you see the market moving.
6. Revenge Trading
Trying to “get back” at the market after a loss by taking impulsive trades.
2.3. Emotional States and Their Effects
Fear – Leads to hesitation, missed opportunities, and premature exits.
Greed – Leads to over-leveraging and chasing setups.
Hope – Keeps traders in losing trades far longer than necessary.
Regret – Causes paralysis, stopping you from entering new opportunities.
Euphoria – False sense of invincibility, leading to reckless trades.
3. Mastering the Trader’s Mindset
3.1. Accepting Uncertainty
Markets are probabilistic, not certain. The best trade setups still lose sometimes. The key is to think in terms of probabilities, not certainties.
Mental shift:
Bad trade ≠ losing trade.
Good trade ≠ winning trade.
A “good trade” is one where you followed your plan and managed risk — regardless of the outcome.
3.2. Developing Discipline
Discipline means doing what your trading plan says every time, even when you feel like doing otherwise.
Practical ways to build discipline:
Pre-market checklist (entry/exit rules, risk per trade, market conditions).
Post-trade review to identify emotional decisions.
Simulated trading to practice following rules without monetary pressure.
3.3. Managing Emotional Cycles
Traders often go through repeated emotional phases:
Excitement – New strategy, first wins.
Euphoria – Overconfidence and overtrading.
Fear/Panic – Sharp drawdown after reckless trades.
Desperation – Trying to recover losses quickly.
Resignation – Stepping back, reevaluating.
Rebuilding – Adopting better discipline.
Your goal is to flatten the cycle, reducing extreme highs and lows.
4. Risk Management: The Survival Mechanism
4.1. The Goal of Risk Management
Trading is not about avoiding losses — losses are inevitable. The aim is to control the size of your losses so they don’t destroy your capital or confidence.
4.2. The Three Pillars of Risk Management
1. Position Sizing
Determine how much capital to risk per trade. Common rules:
Risk only 1–2% of total capital on any single trade.
Example: If you have ₹1,00,000 and risk 1% per trade, your max loss is ₹1,000.
2. Stop Losses
Predetermined exit points to limit losses.
Hard stops – Fixed at a price level.
Trailing stops – Move with the trade to lock in profits.
3. Risk-Reward Ratio
A measure of potential reward vs. risk.
Example:
Risk: ₹500
Potential Reward: ₹1,500
R:R = 1:3 (good)
4.3. The Power of Capital Preservation
Here’s why big losses are dangerous:
Lose 10% → Need 11% gain to recover.
Lose 50% → Need 100% gain to recover.
The bigger the loss, the harder the comeback. Capital preservation should be your #1 priority.
4.4. Avoiding Overleveraging
Leverage magnifies both gains and losses. Many traders blow accounts not because their strategy was bad, but because they used excessive leverage.
5. Integrating Psychology with Risk Management
5.1. The Feedback Loop
Poor psychology → Poor risk decisions → Bigger losses → Worse psychology.
You must break the loop by locking in good risk rules before trading.
5.2. The Risk Management Mindset
Treat each trade as just one of thousands you’ll make.
Focus on execution quality, not daily P/L.
Celebrate following your plan, not just winning.
5.3. Journaling
A trading journal should include:
Entry/exit points and reasons.
Risk per trade.
Emotional state before/during/after.
Lessons learned.
Over time, patterns emerge that reveal weaknesses in both mindset and risk control.
6. Practical Tips for Building Psychological Strength
Meditation & Mindfulness – Keeps emotions in check.
Physical Health – A healthy body supports a calm mind.
Sleep – Fatigue increases impulsive decisions.
Routine – Structured trading hours reduce stress.
Detach from P/L – Judge performance over months, not days.
7. Case Studies: When Psychology Meets Risk
Case Study 1 – The Overconfident Scalper
Wins 10 trades in a row, doubles position size.
One loss wipes out previous gains.
Lesson: Stick to fixed risk % per trade regardless of winning streaks.
Case Study 2 – The Hopeful Investor
Holds losing position for months.
Avoids taking stop loss because “it’ll recover.”
Lesson: Hope is not a strategy; use predefined exits.
8. Conclusion
Trading success is 20% strategy and 80% mindset + risk control. The market will always test your patience, discipline, and emotional control. By mastering your psychology and implementing rock-solid risk management, you give yourself the best chance not just to make money — but to stay in the game long enough to grow it.

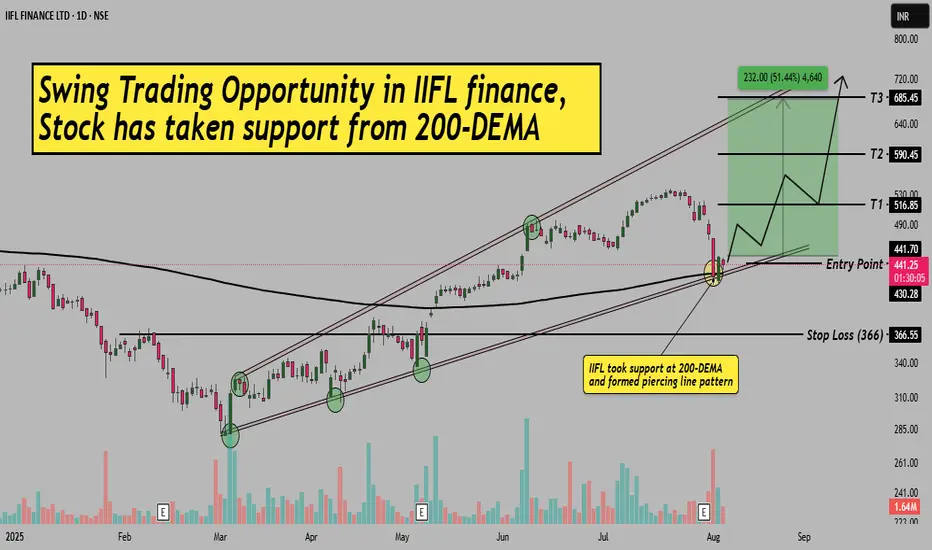
IIFL Finance–Swing Setup from 200-DEMA Support & Piercing Line!Hello Everyone, I hope you all are doing well in life and in trading!
Today I’ve brought a fresh swing trading opportunity in IIFL Finance , where the stock has taken support from the 200-EMA and is formed a bullish Piercing Line pattern.
After a strong uptrend, the stock corrected and has now taken trendline support (from channel base) along with the 200-day EMA confluence, a high-probability reversal zone. A clear bullish candle indicates a potential bounce from here.
The best part? The stock still offers a great risk-reward with defined entry, stop-loss, and 3 possible targets. Please refer to the chart for full trade setup details.
This setup is purely based on price action, moving average confluence, and support zone behavior.
If you are a swing or positional trader, this setup is worth keeping on your radar!
If you found this helpful, don’t forget to LIKE & FOLLOW for more such clean technical ideas.
Disclaimer: This idea is for educational purposes only. Always do your own research before taking trades.
APTUS Swing Trade (20% upside)Simple swing trade setup based on institutional buying footprint.
No indicators, no silly chart patterns.
Pure buyer/seller psychology and trend based setup.
Risk Management for setups like these:
This is a high probability setup. The only thing to take care of is the position sizing in case the overall market ( Nifty ) is bearish for some weeks. Decrease position and increase SL size to maintain your Risk. Have patience.
Message me for more such setups and learning insights and to know how to find such setups and properly ride the complete trend fors trades like these.
Risk Reward for these setups are very good so you have to manage the risk before the next up-trend move kicks in. Part of the game.
Any question or want to have any convo over stock market ? Do message. Happy to help and connect with fellow traders.
Thanks.
Gaurav

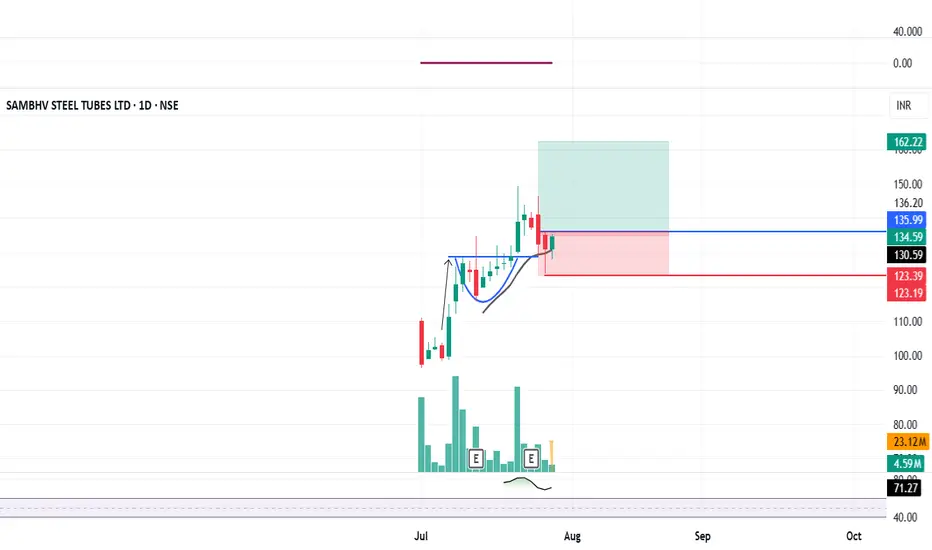
SAMBHV: IPO Base Breakout + Retest done#SAMBHV #ipostock #breakoutstock #trendingstock #swingtrading
SAMBHV : Swing Trading
>> Breakout & Retest done
>> Trending stock
>> Good Strength & Volumes
>> Low Risk High Reward Trade
Swing Traders can lock profits at 10% & Keep Trailing
Pls Comment , Boost and Follow for more such Analysis
Disc : Charts shared are for Learning Purpose and not a Trade recommendation, Consult your Financial advisor or a SEBI Registered Advisor before taking position in it.
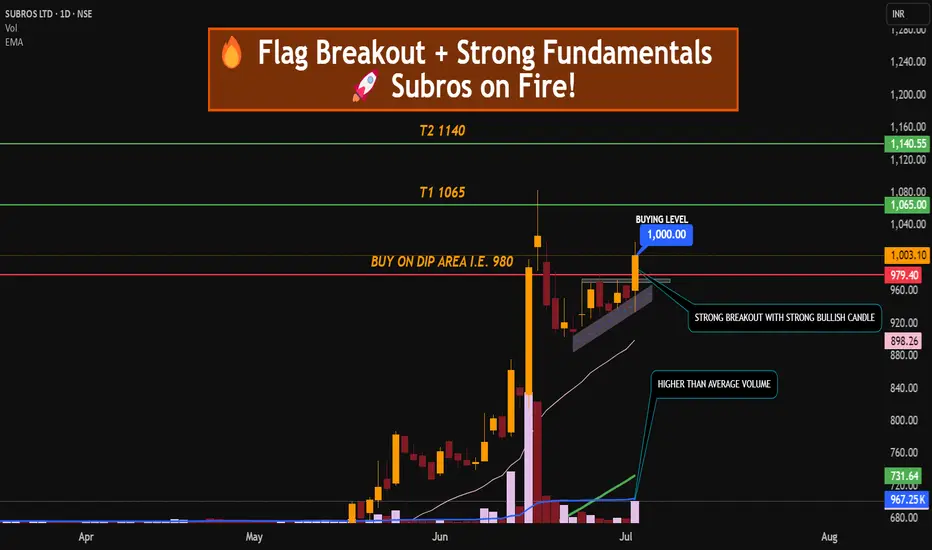
FLAG BREAKOUT + STRONG FUNDAMENTAL = AUTO STOCK ON THE MOVE SUBROS ON FIRE
Subros Ltd has formed and broken out of a bullish flag pattern on the daily chart, supported by strong volume, indicating continuation of its upward trend.
🔍 Technical Analysis:
Pattern: Bullish flag breakout
Breakout Confirmation: Strong bullish candle above consolidation (flag zone) with volume
Strong uptrend, supported by both EMA 20 and EMA 50
Support Zone: ₹950–₹960 (previous flag top)
Volume Spike: Confirms bullish momentum on breakout
QUIK FUNDAMENTAL KEYS WHICH CONFIRM ITS BULLISHNESS.
📈 Price Strength: Strong momentum with recent 52-week high
💰 ROCE: ~17.3% (efficient capital usage)
🏦 ROE: ~12.5% (shareholder return strength)
📉 Debt to Equity: ~0.2 (low debt = financially stable)
📊 Net Sales Growth: ~20% YoY (consistent top-line growth)
🔧 Sector: Auto Ancillary – strong demand recovery cycle
💡 Trade Rationale:
Subros is technically strong with a clean flag breakout and volume confirmation. Fundamentals support this move, with consistent revenue growth, efficient capital usage, and a low-debt structure.
TRADE PLAN :
Entry: Around ₹1000 (CMP) or on dip near ₹960–₹970 (retest)
Stop Loss: ₹940 (below consolidation)
Target 1: ₹1065
Target 2: ₹1120–₹1140
Risk-Reward: ~1:2.5+
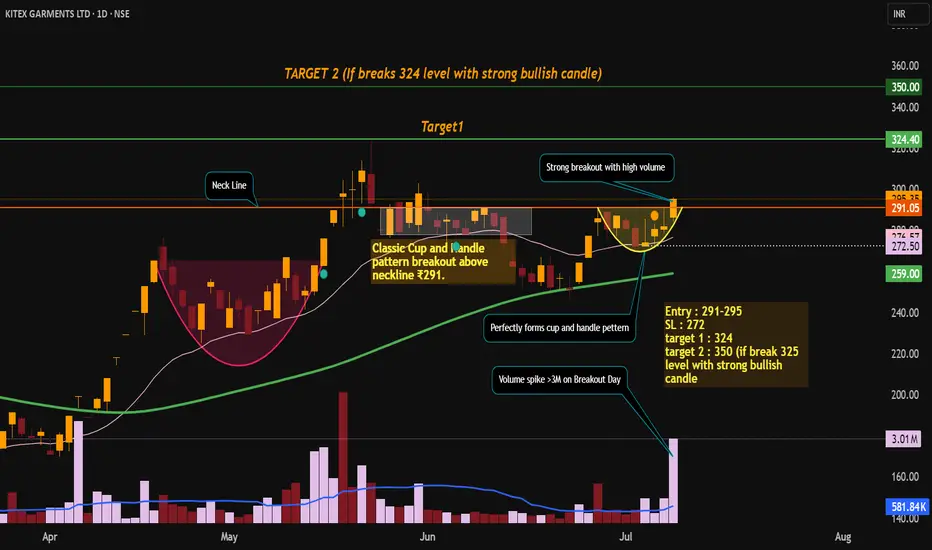
KITEX GARMENTS LTD – SWING TRADE PLANKITEX GARMENTS has delivered a volume-backed breakout from a bullish cup & handle pattern. The technicals are aligned with improving fundamentals, making this a high-probability swing trade setup.
✅ Cup & Handle Breakout 💥
📈 Entry: ₹291–₹295 | 🎯 Target: ₹324 / ₹350 | 🔐 SL: ₹272
🧠 Strong volume + solid fundamentals
Technical Analysis
Classic Cup and Handle pattern breakout above neckline ₹291.
Strong bullish close at ₹295.35 with high volume (3.01M vs avg 580K).
Price above 20(276) & 50 (259) EMA which confirms confirms bullish trend. Both the EMAs slopping upward which shows positive trend structure.
price can take support near ₹274–₹276 (handle + 20 EMA).
Resistance ₹324 (Target) (swing high), ₹350 (measured move target).
Volume spike confirms real breakout, not a fake breakout.
Demand zone breakout with institutional interest.
FUNDAMENTAL KEYS WHICH SUPPORT STOCK FOR BULLISH TREND.
KITEX is financially sound with low debt, stable returns, and improving growth. Fundamentals support bullish technical setup. High promoter confidence (>60%). Consistently company's sales growth is improving Q-o-Q.
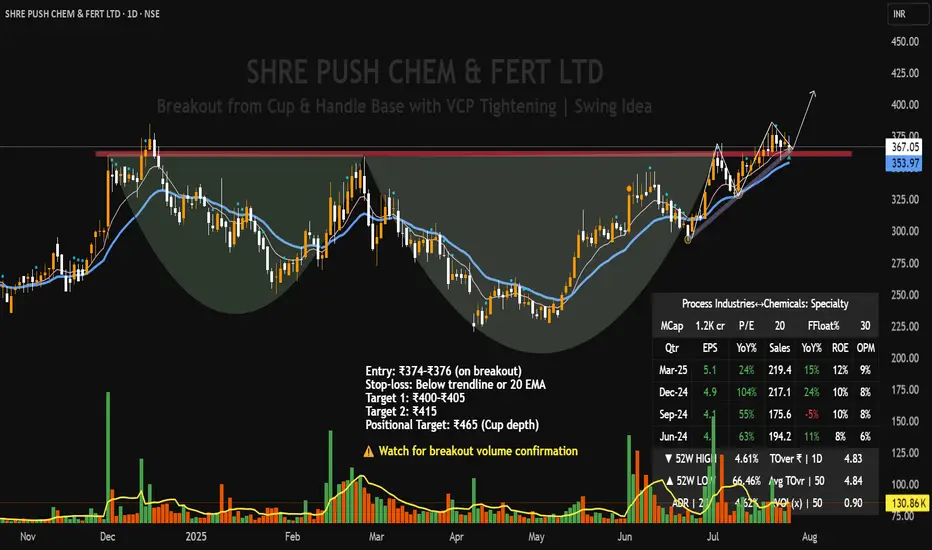
SHREE PUSHKAR CHEMICALS – Cup & Handle + VCP Breakout Setup |Technical Structure:
SHREE PUSHKAR CHEMICALS is forming a high-quality breakout setup on the daily chart, combining both a Cup & Handle pattern and a Volatility Contraction Pattern (VCP) within the handle zone.
Cup & Handle base formation extending from Nov 2023 to Jul 2025
Mini VCP within handle, showing tight range contraction, signaling institutional accumulation.
Ascending trendline support holding firm, along with the 9 EMA.
Volume contraction during each pullback
A confirmed breakout above ₹378 with volume can trigger a strong upside continuation.
Volume has steadily contracted across the handle, especially during pullbacks
Current price is tightening just under the breakout zone — ideal for a low-risk entry
A decisive breakout on volume >150K will act as a confirmation trigger.
Fundamentals
Market Cap : ₹1,200 Cr (Small-cap room for growth)
P/E Ratio: ~20x Reasonable for specialty chemicals
EPS Growth: 24% YoY Consistent profit improvement
Revenue Growth: 15% YoY Stable.
ROE: ~12% Healthy return metrics
Operating Margin: ~9% Sustainable profitability
This setup reflects strong technical discipline with a clean, low-risk structure. Ideal for swing traders looking for breakouts backed by volume and volatility contraction. Watch closely for confirmation with volume.
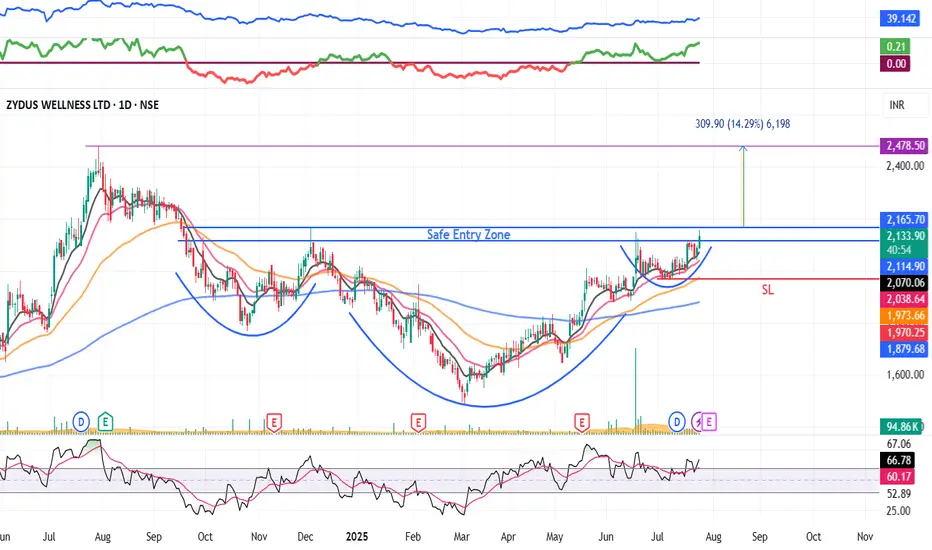
ZYDUSWELL : Inverse Head & Shoulder chart pattern#ZYDUSWELL #patterntrading #chartpattern #breakouttrading #inverseheadandshoulder #trendingstock
ZYDUSWELL : Swing Trade
>> Breakout candidate
>> Inverse Head & shoulder pattern
>> Trending stock
>> Good Strength & Volume
Swing Traders can lock profit at 10% and keep trailing
Pls comment, Boost & follow for more such Analysis
Disc : Charts shared are for Learning purpose and not a Trade recommendation. Consult a SEBI Registered advisor before taking position in it
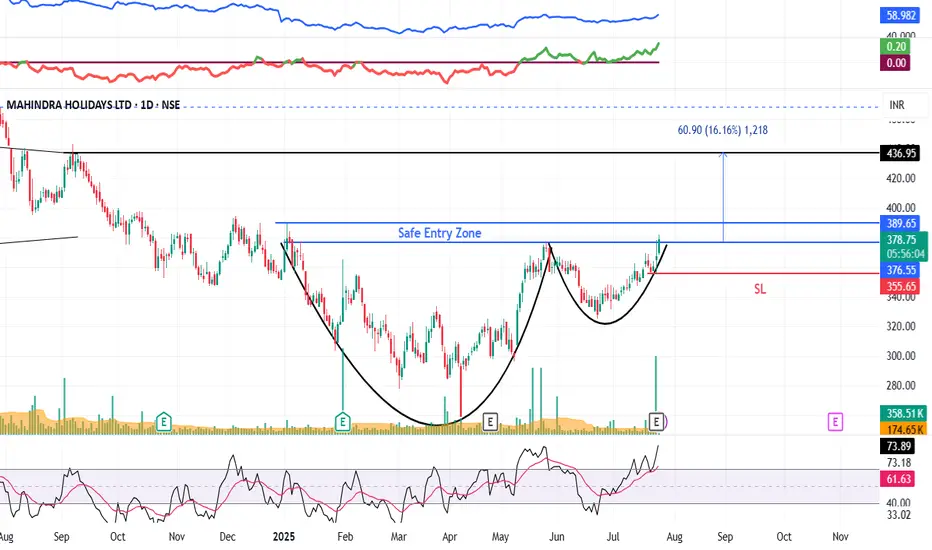
MHRIL : Swing Trade#MHRIL #patterntrading #chartpattern #cupandhandlepattern #swingtrading #trendingstock
MHRIL : Swing Trade
>> cup & Handle chart pattern
>> Breakout soon
>> Trending Setup
>> Stock in Momentum
>> Good Strength & Volumes
Swing Traders can lock profit at 10% & keep trailing
Pls boost, comment & Follow for more Learnings
Disc : Charts shared are for Learning purpose and not a Trade recommendation. Consult your financial advisor or a SEBI Registered Advisor before taking position in it.
MTAR Technologies: The hidden giant behind space & clean Energy NSE:MTARTECH
🏢 Company Overview:
MTAR Technologies Ltd is a precision engineering company catering to high-value, mission-critical sectors such as:
Clean Energy (Hydrogen, Nuclear, etc.)
Space & Defence
Aerospace
They manufacture critical components like fuel cells, nuclear reactor parts, aerospace engines, and satellite launch system parts.
📈 Fundamental Analysis:
✅ Key Financials (FY24-25 Estimates):
Market Cap : ₹6,500+ Cr
Revenue (FY24) : ₹650 Cr+
EBITDA Margin : ~28-30%
PAT Margin : ~15%
ROE / ROCE : 15-18% / 20%+
Debt to Equity : 0.1 (Very low)
P/E Ratio : ~45x (Premium)
🧩 Strengths:
Strong order book from ISRO, DRDO, BHEL, and international clean energy players like Bloom Energy.
Technological moat in nuclear & space-grade precision engineering.
Low debt, high return ratios—financials are robust.
Entering Hydrogen & Fuel Cell space—a big long-term catalyst.
⚠️ Risks:
Dependency on a few clients (Bloom Energy being a major one).
Volatility in clean energy adoption pace.
High valuation – priced for growth.
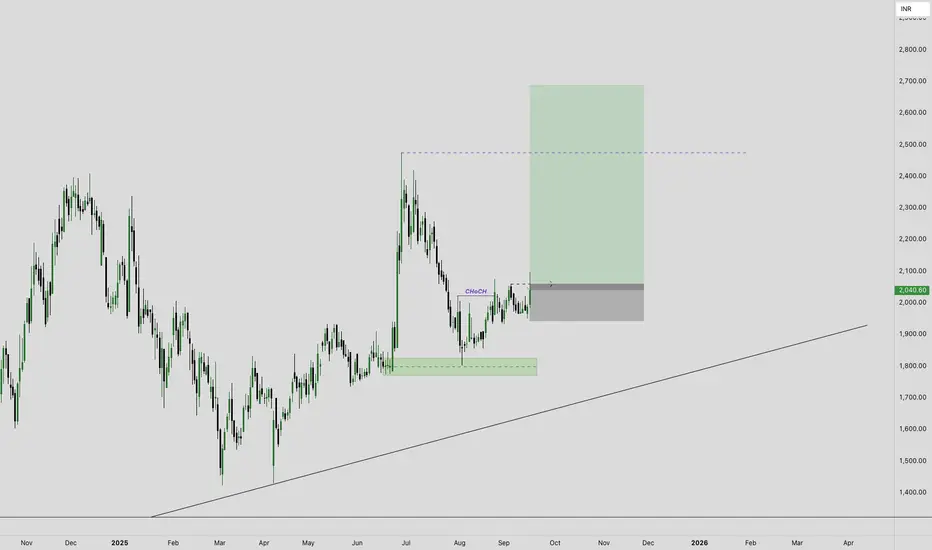
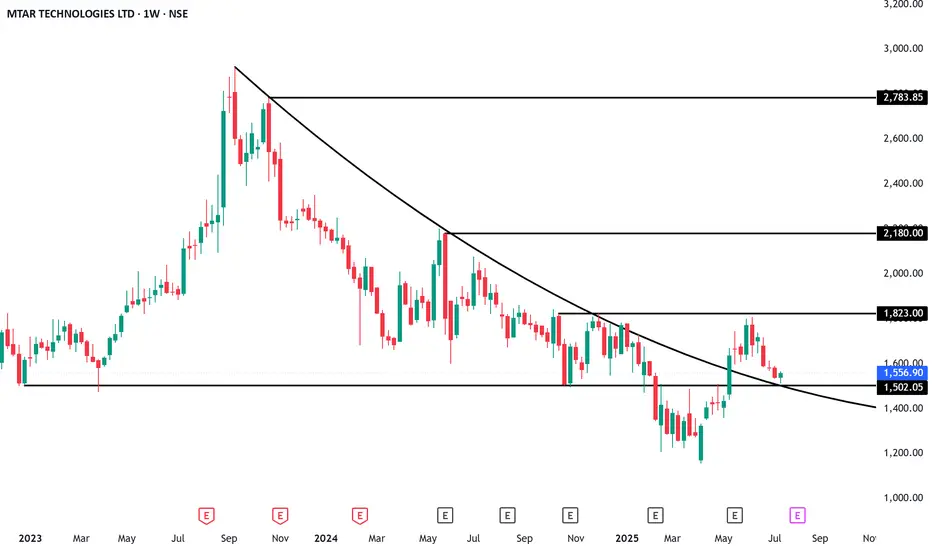
📊 Technical Analysis (As of July 2025):
🧾 Price Action Summary:
CMP: ₹2,050 (Example)
52-Week Range: ₹1,250 – ₹2,150
Trend: Bullish continuation from March 2025
Support Zone: ₹1,860 – ₹1,950
Resistance: ₹2,150 (all-time high breakout zone)
🔍 Indicators:
200 EMA: ₹1,620 (Stock trading well above 200 EMA)
MACD: Bullish crossover on daily chart
RSI: ~67—momentum strong but near overbought zone
Volume: Rising steadily with price—confirms strength
📉 Short-Term View:
Healthy consolidation expected around ₹2,000–₹2,150
A breakout above ₹2,150 could lead to ₹2,400–₹2,600 zone
🚀 Future Growth Prospects:
🔬 1. Clean Energy Boom:
Supplying parts to Bloom Energy (US-based Fuel Cell firm).
India’s green hydrogen policy and PLI schemes can benefit MTAR.
🛰️ 2. Space & Defense:
Increasing budgets in defense, ISRO’s new missions, and India’s entry into private space programs can drive long-term orders.
💹 3. Export Potential:
MTAR is entering global markets for nuclear and aerospace precision components.
USD-denominated revenues provide a hedge and higher margins.
🌱 4. Capex & Expansion:
New manufacturing facility in Adibatla, Telangana.
Capex being done to triple capacity in the coming 3–5 years.
📝 Conclusion:
Parameter Verdict
Fundamentals 🔵 Strong (Clean Balance Sheet, Healthy Margins)
Technicals 🟢 Bullish (But Near Resistance)
Valuation 🟡 Slightly Overvalued (but justified by growth)
Long-Term View ✅ Positive – Multiyear structural story
Short-Term View 🔄 Wait for consolidation or breakout above ₹2,150
⚠️ Disclaimer:
This analysis is for educational and informational purposes only.
We are not SEBI-registered analysts or advisors.
This is our personal view based on available data and market trends.
Please consult your SEBI-registered investment advisor before making any investment or trading decisions.
You are solely responsible for any financial decisions you make based on this content.
========================
Trade Secrets By Pratik
========================
Tools
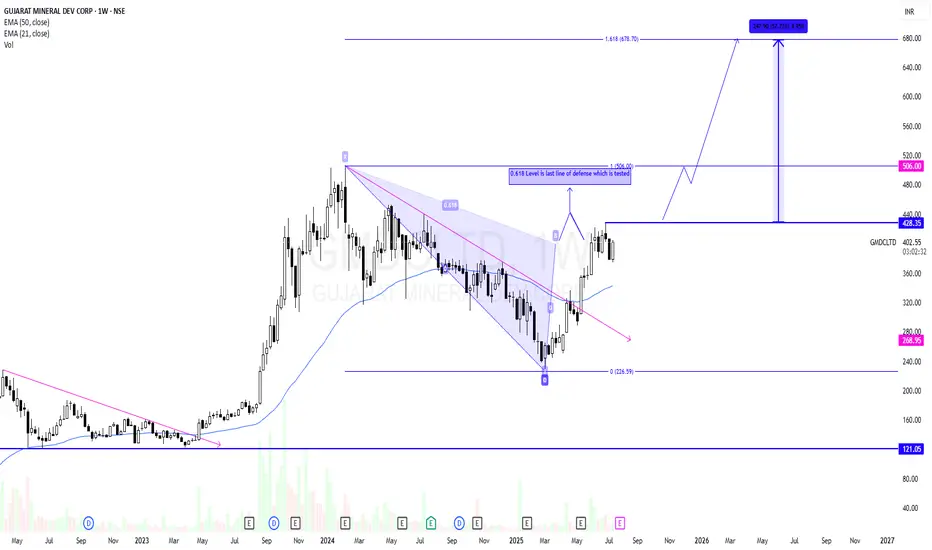
GMDCLTD - Potential Swing CandidateGMDCLTD has recently ended its correction phase and reversed. It has retraced till 0.618 level and has got a small rejection. 0.618 is last line of defence for sellers in many cases. Above 0.618 level a strong momentum likely to come.
Risk will be previous swing low after breakout.
As per price structure 430 is the last swing high. Breakout will start a strong momentum towards ATH and above that it is likely to test 678 as per Fib extension.
So put an alert to track this for your learning.
Learning Part :-
A rise in price then a correction in a channel formation is good to buy on breakout.
I am Not SEBI Registered
This is my personal analysis for my personal trading. Kindly consult your financial advisor before taking any actions based on this.