#ASTRAZEN - Potential All Time High BreakOut / Feb'25📊 Script: ASTRAZEN
Key highlights: 💡⚡
📈 Stock is in a Stage 2 Up Trend
📈 VCP under formation in DTF
📈 Wait for more consolidation
📈 BO with volume spike, then only enter
📈 MACD can give a Bounce
📈 RS Line is making 52WH
📈 EMA Rule in place
📈 Price consolidated for 73Days
📈 One can go for Swing Trade
⚠️ Over All Market condition is bad, Practice paper trading
🟢 If you have any questions regarding the setup, please feel free to leave your inquiries in the comments, and I will respond promptly.
BUY ONLY ABOVE 7955 DCB
⏱️ C.M.P 📑💰- 7498
🟢 Target 🎯🏆 – NA%
⚠️ Stoploss ☠️🚫 – NA%
⚠️ Important: Always Exit the trade before any Event.
⚠️ Important: Always maintain your Risk & Reward Ratio.
✅#Boost, #Like & #Follow to never miss a new idea! ✅
Disclaimer: I am not SEBI Registered Advisor. My posts are purely for training and educational purposes.
Eat🍜 Sleep😴 TradingView📈 Repeat 🔁
Happy learning with MMT. Cheers!🥂
Swingtrade

Axis Bank : Swing Trade Pick#axisbank #swingtrade #momentumtrade #trendingstock
Axis Bank : Swing Trade
>> Low PE Stock
>> Banking Sector Theme, most likely to perform
>> Trending stock
>> Low Risk Trade
Swing Traders can lock profit at 10% and keep Trailing
Please Boost, comment and follow us for more Learnings.
Note : Markets are still Tricky and can go either ways so don't be over aggressive while choosing & planning your Trades, Calculate your Position sizing as per the Risk Reward you se and most importantly don't go all in
Disc : Charts shared are for learning purpose only, not a Trade recommendation. Do your own research and consult your financial advisor before taking any position.

CreditAccess Grameen: A Turnaround in Sight Short Term Trading Advice by Goodluck Capital
Buy CreditAccess Grameen
Buy Range- 990 - 1030
Target- 1200 - 1250
StopLoss- below 845
Upside Potential- 20% -25%
Approx trade duration 20 - 25 days
◉ Technical Analysis
● After a substantial decline, the stock is now showing signs of recovery, bouncing back from its trendline support.
● Additionally, the increasing trading volume is reinforcing the likelihood of a turnaround, indicating a potential reversal in the stock's fortunes.
◉ Fundamental Rationale
The Reserve Bank of India's (RBI) recent liquidity infusion of over ₹1.5 lakh crore is expected to boost economic growth and create a favorable environment for microfinance institutions (MFIs) like CreditAccess Grameen. Here are the key benefits:
● Improved Liquidity for Lending: The injection will help MFIs meet their short-term funding requirements, reducing their reliance on expensive sources of funding.
● Potential Interest Rate Cuts: Lower interest rates will enable CreditAccess Grameen to access cheaper capital, making loans more affordable for low-income customers.
● Boost to Rural Economy: Budget 2025's focus on rural development through increased government spending will enhance the repayment capacity of borrowers, reducing credit risks for MFIs. This will create a favorable environment for CreditAccess Grameen to operate and expand their services.

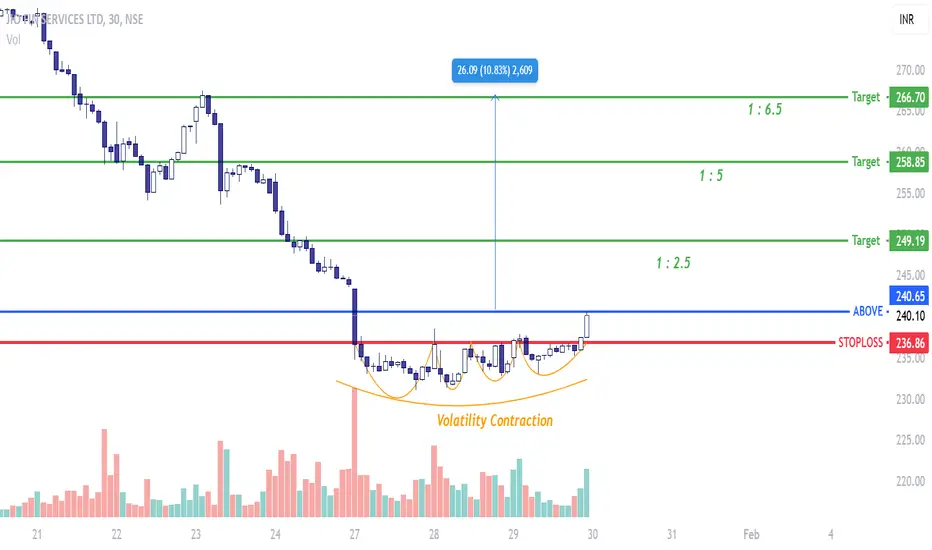
JIO FIN SERVICES - Swing ContenderOn the larger scheme of this this stock has been beaten down and the trajectory is deep negative. However, in the very short term the stock can correct its trajectory and as a trader one can make use of these opportunities.
A volatility contraction has happened forming a base on shorter timeframe. Expecting this stock to perform well over the next 2 days.
BANDHAN BANK - DOUBLE BOTTOM IN FORMATIONSymbol - BANDHAN BANK
CMP - 151.12
Incorporated in 2014, Bandhan Bank is a commercial bank focused on serving underbanked and underpenetrated markets in India. The company has a PAN-India presence and offers a wide range of banking products & services and asset & liability products and services designed for micro banking and general banking.
A double bottom pattern is currently in formation, and the price is undergoing a consolidation phase. At this juncture, the key level of focus is 154, which represents the breakout zone for this consolidation (Buy Trigger). If the price successfully sustains above this level, a potential upward move towards 168 can be anticipated. Therefore, I intend to initiate long position in Futures at the buy trigger level. Additionally, I plan to add more position around 150 level and will hold long position with a stop loss at 144. The target for this trade is 168, which implies an expected upside of approximately 8.40% from the entry point.
Disclaimer - Do not consider this as a buy/sell recommendation. I'm sharing my analysis & my trading position. You can track it for educational purposes. Thanks!

My Swing Trade in GHCLWhat do they do at GHCL?
Chemicals: Produces Soda Ash (used in detergents, glass, and ceramics) and Sodium Bicarbonate.
Textiles: Produces cotton yarn and home textile products.
Consumer Products: Manufactures and sells edible and industrial salt under the brands i-FLO and Sapan.
Sustainability & CSR: Focuses on agriculture, health, and education. Committed to environmental sustainability and green manufacturing processes.
You guys can see the levels on, my chart.

PRAKASH - Wonderful swing trading setupThe price has been consolidating since October 2023, with the ₹148 level establishing itself as a strong support zone. All previous reversals from this support, highlighted with green arrows, indicate its significance. Last week, the price formed a bullish engulfing pattern on the weekly timeframe, confirming buying momentum. This setup presents an excellent swing trading opportunity, with a stop-loss below ₹145 on a weekly closing basis and a target of ₹230 or a move toward the yellow trendline.

ICICIGI - Trend Reversal ? ICICI Lombard General Insurance Company Ltd is a leading private sector general insurance company in India.
Technical Analysis:
Weekly: Bullish Harami
Daily Time Frame: Hammer formed on 3rd Jan, volume slightly up
Publishing 2-Hour Chart, as Overall market trend is negative/downtrend. Observe the chart for trendline breakout. On weekly, it's near the 0.65 level, which is crucial. Entry points are mentioned in the chart.
Please share your view.

MAN INFRA: potential upside move<Man infra has successfully given breakout of two good chart patterns.
<Flag and pole which is clearly visible.
<Triangle pattern which can be seen if we draw a line from top red candle to the <breakout candle respecting all the wicks.
<We are learning this trade respecting the flag pattern.
<The stock has given upside breakout with good volume indicating bulls hold.
<The risk reward ratio for the trade is 1:5.

flag pattern breakout Pitti Engineering has broke the flag pattern. This trade is little risky because the candle next to breakout candle has shown resistance to bulls and also the volume is very high but since it is Doji candle there is indecisiveness. To swing high in this trade entry could be made tomorrow or we can wait for this week's closing. Breakout candle has good volume.

will flag wave high???Ashapura minechem successfully gave breakout of flag and pole pattern and has retested and bounced back from the breakout level. Buyers in the stock seems interested and is technically expected to reach price lvl of 781 with the risk reward ratio of 1:5.

USD/JPY 15-Minute Chart AnalysisKey Observations:
1. Trendline Break:
- The price broke the ascending trendline, indicating a potential shift in momentum.
2. Support Zone:
- The price is hovering around a key support area (156.500–156.650). If this zone fails, we could see further downside movement.
3. Bearish Setup:
- A bearish view can be taken with the stop-loss around 156.900 to 156.940 and the target near 154.03.
- This gives a favorable risk-to-reward ratio if the setup plays out.
---
Trading Scenarios:
1. Bearish Continuation:
- If the price breaks below 156.500, it could confirm the bearish move towards 154.03.
- Watch for bearish momentum and volume to support the move.
2. Rejection and Reversal:
- If the support zone holds, the price might retest the resistance near 156.940 or higher, invalidating the bearish setup.
---
Patience is key here; wait for clear confirmation of the breakout or rejection.
Disclaimer:
This analysis is for informational purposes only and does not constitute financial advice. Trading involves substantial risk, and past performance is not indicative of future results. Always conduct your own research and consult a financial advisor before making investment decisions. Trade responsibly. Happy Trading

PFC Positional Short trade SetupNegative crossover with volume supported move. Sell Positional ~ 451, With Stop ~ 468, For Target ~ 410. Time Frame - (5 To 8 Day's)

Lupin Breakout: A New Highs Journey Begins!Hello everyone, i hope you all will be doing good in your life and your trading as well. Today i have a Lupin stock which has caught the market's attention with a powerful breakout from its resistance zone. Backed by increasing volume and bullish momentum, this pharmaceutical giant is showing signs of a potential rally. Let's dive into the chart to explore the opportunities.
1. Chart Overview
The chart appears to be for LUPIN LTD on a daily timeframe (1D).
The key focus is on price action with clearly defined support and resistance zones.
Indicators used include the RSI (Relative Strength Index) at the bottom of the chart.
The price is currently trading at ₹2,311.35, up by +3.75% for the day.
2. Key Levels Highlighted
Support Zone (Grey Band)
The support zone is marked around the ₹2,000–₹2,100 level, acting as a base where buyers consistently step in.
The price bounced off this zone multiple times, confirming its strength.
Resistance Zone (Grey Band)
The resistance zone is marked around ₹2,300–₹2,350, where sellers have historically prevented price from moving higher.
The recent breakout indicates strong bullish momentum.
Stop Loss (₹2,222)
A stop loss is suggested at ₹2,222, slightly below the resistance zone.
This is to manage risk in case the breakout fails and the price reverses.
Targets
1st Target: ₹2,490 : This is a realistic level based on previous price action and the measured move.
2nd Target: ₹2,678: This is a more optimistic target if the price continues its uptrend.
3. Price Action
Breakout: The price has broken above the resistance zone with strong bullish momentum, as seen by the large green candle and increased volume. This breakout suggests a potential continuation of the uptrend.
4. Volume Analysis
Volume Surge: There is a noticeable increase in volume during the breakout, indicating strong buying interest. Volume confirmation is a good sign that the breakout is genuine.
5. RSI Analysis
Current RSI: 71.94
The RSI is above 70, indicating an overbought condition. While this signals strong momentum, it may also suggest caution as a short-term pullback is possible.
Previous Bearish Divergences: Marked in red, showing past instances where the RSI was high but price reversed.
Bullish Confirmation: Marked in green, showing that RSI and price are aligned with the current uptrend.
6. What Does This Mean?
The breakout above resistance indicates a potential shift in market sentiment, favoring buyers.
The targets suggest significant upside potential, but the RSI warns of possible short-term profit booking.
7. Possible Outcomes
Bullish Scenario:
If the price holds above the resistance zone and sustains higher levels, it could move towards the 1st and 2nd targets.
Bearish Scenario:
If the price closes below ₹2,222 (stop loss), it may revisit the support zone around ₹2,000–₹2,100.
8. Suggested Actions
Entry: On sustained breakout above ₹2,311 (current level).
Stop Loss: Strictly at ₹2,222 to minimize losses.
Profit Booking: Gradual booking at ₹2,490 and ₹2,678.
Lupin has broken out of its resistance zone with strong momentum, signaling a potential uptrend. With solid fundamentals and technical confirmation, the stock looks poised for higher levels. Keep an eye on the targets and manage your risk with the defined stop-loss. Happy Trading!
Disclaimer:- Please always do your own analysis or consult with your financial advisor before taking any kind of trades.
Dear traders, If you like my work then do not forget to hit like and follow me, and guy's let me know what do you think about this idea in comment box, i would be love to reply all of you guy's.
Thankyou.

Kotak Bank Positional Buy Trade Setup!Kotak bank successfully hold their ~ 50, 200 day moving average and close above resistance zone ~ 1813. Buy positional with stop ~ 1800, for target ~ 1950. (Time frame 5 to 6 day's)

GOKUL REFOILS : Trending stock#GOKUL #swingtrade #breakout #momentumtrading #trendingstock
GOKUL REFOILS : Swing Pick
>> Volume Dry setup
>> Trending setup
>> Momentum Building up
>> Good Strength
>> Low Risk High Reward Trade
Swing Traders can lock profit at 10 % and keep trailing
Pls give this Trade Idea a Boost, Comment and Follow us for more Learning
Disclaimer : Charts shared are for Study purpose, not a Trade recommendation. Consult your Financial advisor and do your own analysis before taking position in this stock.

Concord Biotech : Swing Trade#CONCORDBIO #swingtrade #breakout #momentumtrading #trendingstock
Concord Biotech : Volume Dry Setup
>> Trending Setup on Daily & Weekly
>> Breakout Soon & Momentum Building up
>> Good strength in Stock
>> Good Risk Reward
Swing Traders can lock profit at 10% & Keep trailing
Pls Boost, Comment & Follow for more Learning
Disc : Charts shared 4 study purpose only not a Trade Recommendation. Consult your financial advisor and do your own analysis before taking position in it.

EQUITAS BANK : Base Breakout Soon#EQUITASBNK #breakout #basebreakout #momentumtrading
EQUITAS BANK : Swing Trading
>> Base Breakout soon
>> Momentum Building up
>> Good Strength & Volume Rising
>> once breakout, Price can spike quickly towards 200 EMA (Blue Line). 200 EMA will act as a magnet for price.
Swing Traders can lock profit at 10% and keep trailing.
Pls Boost, comment & follow us if u like this Trade Idea.
Disc : Charts shared are for Learning purpose & not a Trade Recommendation. Consult your Financial Advisor and do your own analysis before taking position in it.

GAIL: Pullback swing trade📊 Analysis :
Price trying to structure shift from Down trend to uptrend. Taking support on 21EMA with hammer candle. looking good for bullish move.
📈 Trading Plan :
Entry: Buy above 205.75 (wait for a breakout above candle at least 15-30 min with strong volume confirmation).
Target 1: 222
Target 2: 233 and so on...
Stop-Loss: 199 (Weekly closing basis)
Will update further price direction once price starts moving in bullish direction.

This Railway stock has given Neckline breakout of W patternHello everyone, i hope you all will be doing good in your life and your trading as well. Today i have brought a Railways stock which has given a breakout of W pattern. Stock name is Texmaco Rail & Engineering Ltd and it is an engineering infrastructure co. & part of the Adventz Group, The co. is involved in the business of manufacturing Rolling stock, hydro-mechanical equipment, steel castings & construction of Rail EPC, bridges, and other steel structures.
Stock is giving best discounted entry at these levels. As it has given successfully falling resistance trendline Breakout and formed double bottom kind of pattern and now price has given breakout of neckline as well, Good thing is that stock is trading above to neckline breakout. Company has got some order also worth it 140+ cr. All these parameters suggesting stock should give some positive momentum in near term. I have written all the levels on chart please go through. Overall stock is good for trading in short term and investing in long term, choice is yours.
Fundamental Ratio
Market Cap
₹ 9,155 Cr.
Current Price
₹ 229
High / Low
₹ 297 / 142
Stock P/E
44.1
Book Value
₹ 67.1
Dividend Yield
0.22 %
ROCE
10.6 %
ROE
5.71 %
Face Value
₹ 1.00
Industry PE
44.9
Debt
₹ 938 Cr.
EPS
₹ 5.25
Promoter holding
48.1 %
Intrinsic Value
₹ 62.7
Pledged percentage
0.00 %
EVEBITDA
21.2
Change in Prom Hold
0.00 %
Profit Var 5Yrs
8.85 %
Sales growth 5Years
13.5 %
Return over 5years
49.0 %
Debt to equity
0.35
Net profit
₹ 209 Cr.
ROE 5Yr
3.67 %
Profit growth
204 %
Earnings yield
4.32 %
PEG Ratio
4.98
Disclaimer:- Please always do your own analysis or consult with your financial advisor before taking any kind of trades.
Dear traders, If you like my work then do not forget to hit like and follow me, and guy's let me know what do you think about this idea in comment box, i would be love to reply all of you guy's.
Thankyou.

Premier Explosives : High Potential Trade#PREMEXPLN #breakout #swingtrade #momentumtrade
PREMEXPLN : Short Term (1-3 Months)
>> Piotrowski Score : 9
>> High PE Stock (can be Little Risky)
>> Good Strength & Volumes
>> Breakout Soon
>> Good Risk Reward Trade
Swing Traders can lock profit at 10% & keep trailing
Pls give a Boost & Follow us for more if u like the Analysis.
Disc : Charts shared for purely for Learning purpose, Do your own research & Consult your Financial Advisor before taking position in it.
Do add to your watchlist and observe

Hammer Candlestick Pattern on support zone in Bajaj FinanceHello Everyone, i hope you all will be doing good in your life and your trading as well. Today i have brought a short term swing Trading Idea in Bajaj finance. Stock have formed hammer candlestick pattern on perfect support zone, Bajaj finance stock is trading inside the triangle pattern and chances are very high that we can see this towards upper resistance of triangle pattern which i plotted on chart above. Overall i feel stock should rise from here and no double over the period if we can see most awaited breakout in Bajaj Finance.
Technically stock is looking good for swing trade, and also if anybody wants to think for long term can take entry as chances are high that this time after spending some time we will see finally breakout in it. Please follow strictly stop loss which i mention above on chart, it will save you if something goes against to our analysis.
Disclaimer:- Please always do your own analysis or consult with your financial advisor before taking any kind of trades.
Dear traders, If you like my work then do not forget to hit like and follow me, and guy's let me know what do you think about this idea in comment box, i would be love to reply all of you guy's.
Thankyou.

Swing Trade Idea in Murugappa Group stock | 30% upside possible.Hello Everyone, i hope you all will be doing good in your life and your trading as well. Today i have brought a stock name is Cholamandalam investment and finance ltd, which is belong from Murugappa Group, a prominent Chennai-based conglomerate founded in 1900. It is one of the premier diversified non-banking finance companies in India, engaged in providing vehicle finance, home loans and Loan against property.
Stock has almost taken support from important support zone, i feel this should fly now towards 1500+ levels within 1-3 months timeframe. I have positive view in banking and non banking finance company atleast for near term, chart is really looking good from here, so there is higher probability that we are gonna to see good momentum in it. For short term i have written all the levels on chart you can follow. Stock is really good for long term as well and it is giving good entry levels as well on discounted price. So if anybody wants to decide and go for long term investing can go from here...
Fundamentals:-
Market Cap
₹ 1,01,590 Cr.
Current Price
₹ 1,208
High / Low
₹ 1,652 / 1,011
Stock P/E
26.4
Book Value
₹ 255
Dividend Yield
0.17 %
ROCE
10.4 %
ROE
20.2 %
Face Value
₹ 2.00
Industry PE
23.1
Debt
₹ 1,57,943 Cr.
EPS
₹ 45.9
Promoter holding
50.2 %
Intrinsic Value
₹ 700
Pledged percentage
0.00 %
EVEBITDA
15.4
Change in Prom Hold
-0.09 %
Profit Var 5Yrs
23.4 %
Sales growth 5Years
21.9 %
Return over 5years
31.2 %
Debt to equity
7.38
Net profit
₹ 3,852 Cr.
ROE 5Yr
19.0 %
Profit growth
27.4 %
Earnings yield
6.40 %
PEG Ratio
1.13
Pros:-
Company is expected to give good quarter
Company has delivered good profit growth of 23.4% CAGR over last 5 years
Disclaimer:- Please always do your own analysis or consult with your financial advisor before taking any kind of trades.
Dear traders, If you like my work then do not forget to hit like and follow me, and guy's let me know what do you think about this idea in comment box, i would be love to reply all of you guy's.
Thankyou.
