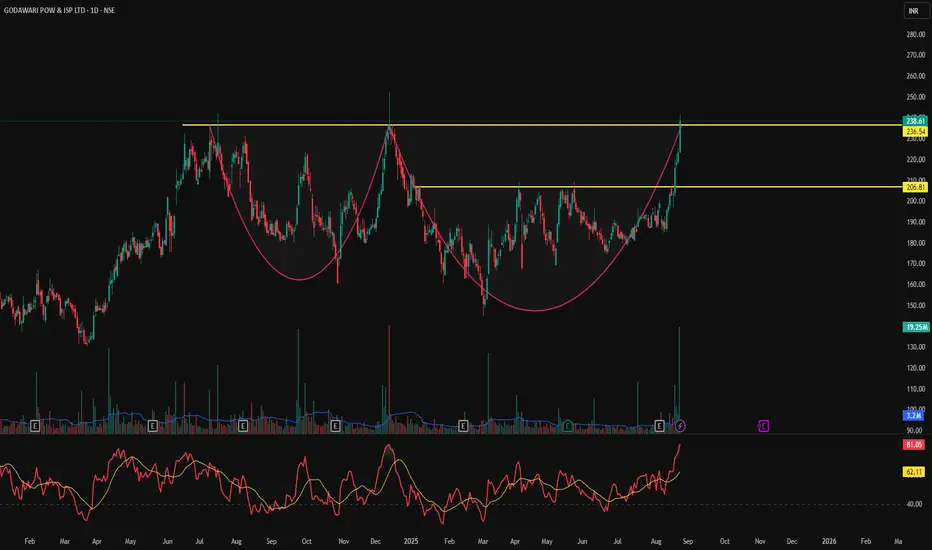
GPIL - Cup & Handle Breakout | Daily Chart📊 GPIL – Cup & Handle Breakout with Explosive Volume | RSI > 80
📅 Chart Date: August 24, 2025
📍 CMP: ₹238.61 (+6.91%)
📈 Symbol: NSE:GPIL | 1D Timeframe
🔍 Technical Analysis
☕ Cup & Handle Breakout
A multi-month Cup & Handle pattern has been completed.
Price gave a strong breakout above the neckline zone ₹206.81.
Next supply zone is around ₹236–₹240, which is being tested.
💥 Volume Confirmation
Relative Volume (RVol): 842% 🔥
Today’s volume 19.25M vs avg 3.2M — heavy institutional buying.
📈 RSI (14, close): 81.05
Stock is in the overbought zone, indicating strong momentum.
Short-term pullback possible, but trend remains bullish above breakout.
📌 Key Levels
Breakout Zone (Support): ₹206.81
Immediate Resistance: ₹236–₹240
Next Target Levels: ₹260 / ₹280
Stoploss for Swing Traders: ₹200
Entry on Retest: ₹210–₹215
Stoploss: ₹200
Targets: ₹260 / ₹280
⚠️ Disclaimer: This is an educational chart setup and not trading advice. Please conduct your own research and risk management.
📣 Follow @PriceAction_Pulse for more such clean breakouts and chart pattern analysis!
🔁 Drop a comment if GPIL is on your radar for the next breakout rally 📈
Swingtrading
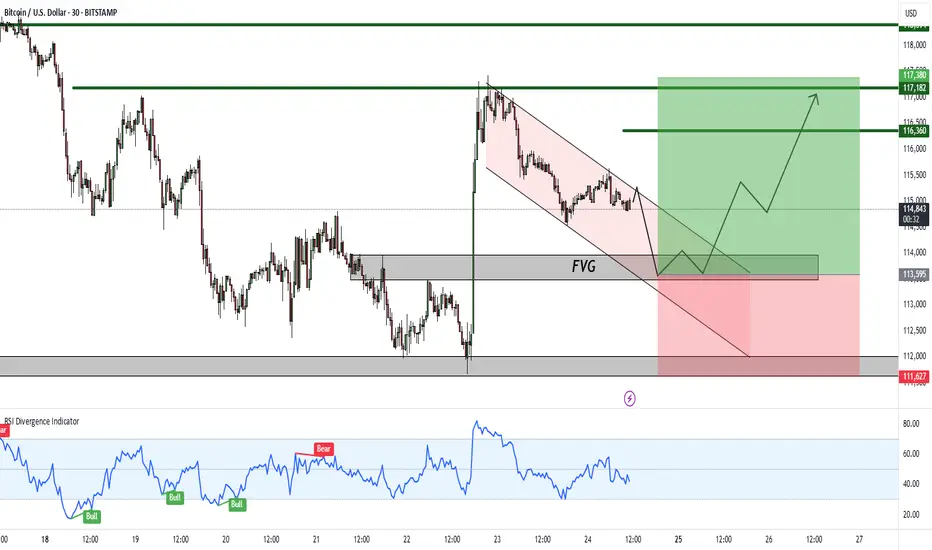
Bitcoin – Bullish Setup Forming After FVG Retest!Hello Traders!
Bitcoin is currently showing signs of forming a bullish setup after rejecting lower levels. The price has created a clean FVG (Fair Value Gap) zone and is moving within a falling channel, suggesting a possible accumulation before the next leg up.
Key Observations:
FVG Support: Price is likely to retest the FVG zone before a strong upward move.
Falling Channel: The structure indicates potential breakout to the upside.
RSI Divergence: Momentum indicators are showing signs of strength, supporting a bullish reversal case.
Targets: The upside targets are marked at 116,360 – 117,380 – 118,394 levels.
Invalidation: A breakdown below 111,627 would negate this bullish setup.
Rahul’s Tip:
Always wait for confirmation around the FVG zone. Entering too early may expose you to false breakouts. Risk management is crucial, especially in volatile assets like Bitcoin.
Disclaimer:
This analysis is for educational purposes only and not financial advice. Please do your own research before making any trading decisions.
Best Stocks to Watch for 3rd Week of Aug / Swing Trading
In this video, I breakdown the weekly timeframe market analysis and share potential swing trade setups for the 3rd week of August. 📊
🔎 What you’ll learn:
Weekly market outlook & key levels
Stocks showing strong patterns & volume action
Watchlist stocks for possible breakouts
Swing trading opportunities using technical analysis
📌 Make sure to keep these stocks on your Watchlist this week!
✅ Like, Share & Subscribe for more trading insights.
📢 Follow me for real-time setups & updates.
⚠️ Disclaimer: I am not a SEBI registered advisor. All content shared here is purely for educational and training purposes only. Please do your own research or consult with your financial advisor before investing.

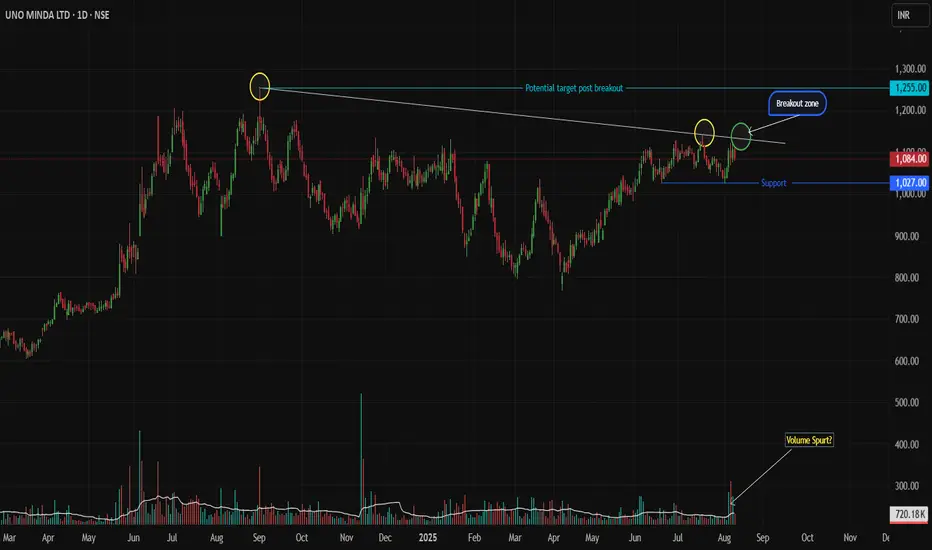
Uno Minda: Triple Trendline Test - Breakout or Pullback Setup Uno Minda Price Action Setup
(Daily Timeframe | Pure Price Action + Volume)
Key Structure
Resistance Trendline: Tested twice (02-Sep-2024 & 17-Jul-2025). Price now approaches it for the 3rd attempt.
Support Zone: Strong base at 1027 (recent swing low).
Long-Term Trend: Bullish (higher highs/lows).
Trade Scenarios
SCENARIO 1 : Trendline Breakout
Trigger:
Daily breakout candle closes above the resistance trendline.
Candle must be strong bullish (full-bodied green) with volume > 20-day average.
Entry: On confirmation of breakout (next candle open/close above breakout candle’s high).
Stop Loss: Low of the breakout candle.
Targets:
First: 1255 (take partial profits).
Trail balance with trailing SL (e.g., below recent swing lows).
SCENARIO 2 : Pullback to Support
Trigger:
Price retests 1027 support, followed by a strong bullish reversal candle (e.g., Bullish Engulfing/Hammer) with rising volume.
Entry: After reversal candle closes (confirmation).
Stop Loss: Below the low of the reversal candle.
Targets:
First: 1130 (take partial profits).
Trail balance aggressively.
Risk Management
Position Size: Risk ≤ 1% capital per trade.
Avoid chasing: Enter only on confirmed triggers.
Invalidation: Exit if price closes below SL levels.
Disclaimer
This idea is educational only. Not financial advice. Trading carries high risk. Past performance doesn’t guarantee future results. Always test strategies in a demo account. Consult a financial advisor before trading.
Boost 👍 if helpful! Comment below for other stocks you want analyzed.
Keep it price-driven. Trade safe! 💡
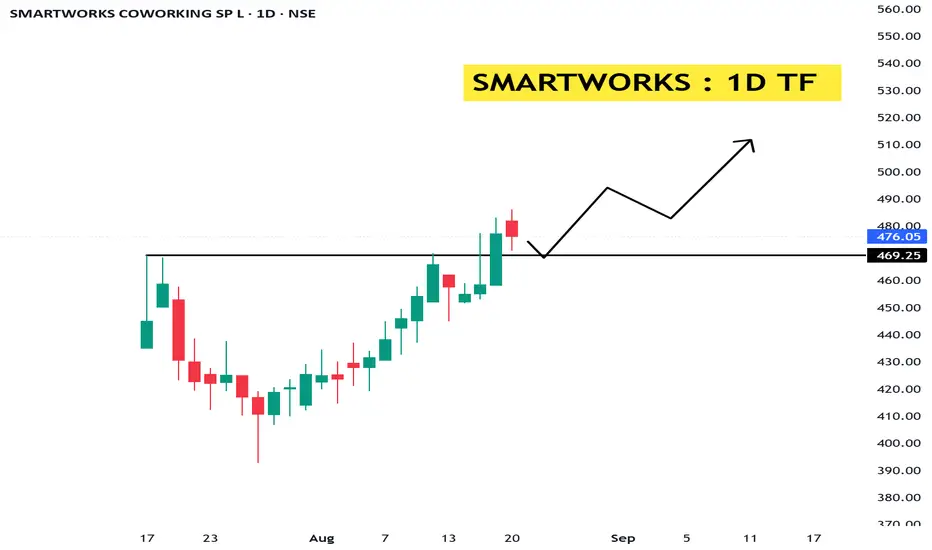
Smartworks: From IPO Buzz to Breakout ZoneNSE:SMARTWORKS
📊 Technical Analysis (Daily & Weekly Chart)
Trend: After listing in Aug 2025 around ₹407, the stock corrected to ~₹393 and then staged a strong rally towards ₹480. Currently consolidating near recent highs.
Current Price: ₹476.05
Resistance Levels:
₹480–₹490 (immediate supply zone)
₹520–₹550 (next major resistance)
Support Levels:
₹460 (short-term support)
₹420 (major support / breakout retest zone)
Chart Structure: Stock is forming a short-term bullish structure with higher highs and higher lows since early Aug. A weekly close above ₹490 may trigger continuation rally.
View: Sustaining above ₹490 can open upside towards ₹520–₹550; failure to cross may lead to pullback towards ₹460–₹420 support zone.
🏭 Fundamental Analysis
Business Model: Smartworks is India’s leading managed office space provider, offering flexible workspaces to corporates. Operates on a “space-as-a-service” model—leasing large commercial spaces, customizing, and sub-leasing to enterprises.
Growth Drivers:
Rising demand for flexible office spaces post-pandemic.
Corporate shift towards asset-light models.
Strong tailwinds from India’s IT, startup, and service sector growth.
Expansion across Tier-1 & Tier-2 cities.
Financials (FY25 & Q1 FY26): (approximate)
Revenue FY25: ~₹1,374 Cr (38.9% CAGR over 2 years).
EBITDA FY25: ~₹172 Cr (117% CAGR).
Net Loss FY25: ~₹63 Cr (loss narrowing).
Q1 FY26: Revenue ~₹379 Cr; Net Loss ~₹4 Cr (showing progress toward breakeven).
Market Cap: ~₹5,200 Cr.
Strengths:
Fastest-growing flexible office provider in India.
Strong corporate client base (enterprise-focused, not just startups).
Expanding in sync with India’s office demand cycle.
High revenue growth with improving operating margins.
Risks:
Still loss-making; breakeven depends on occupancy/utilization.
Highly competitive industry (WeWork, Awfis, IndiQube).
Lease liability-heavy model exposes risk during demand slowdowns.
Valuation expensive (P/B ~9x, negative P/E).
🎯 Conclusion
Technical View: Stock near crucial resistance ₹480–₹490. Breakout with volume can take it towards ₹520–₹550. Support at ₹460 / ₹420.
Fundamental View: Strong revenue growth and improving margins; leadership in flexible workspace model. IPO proceeds support expansion & debt reduction. Profitability is the key monitorable.
👉 Investor Stance:
Investors: Can accumulate gradually for long-term play on India’s office demand & corporate workspace outsourcing trend. Needs patience till profitability.
⚠️ Disclaimer:
This analysis is for educational and informational purposes only.
We are not SEBI-registered analysts or advisors.
This is our personal view based on available data and market trends.
Please consult your SEBI-registered investment advisor before making any investment or trading decisions.
You are solely responsible for any financial decisions you make based on this content.
========================
Trade Secrets By Pratik
========================
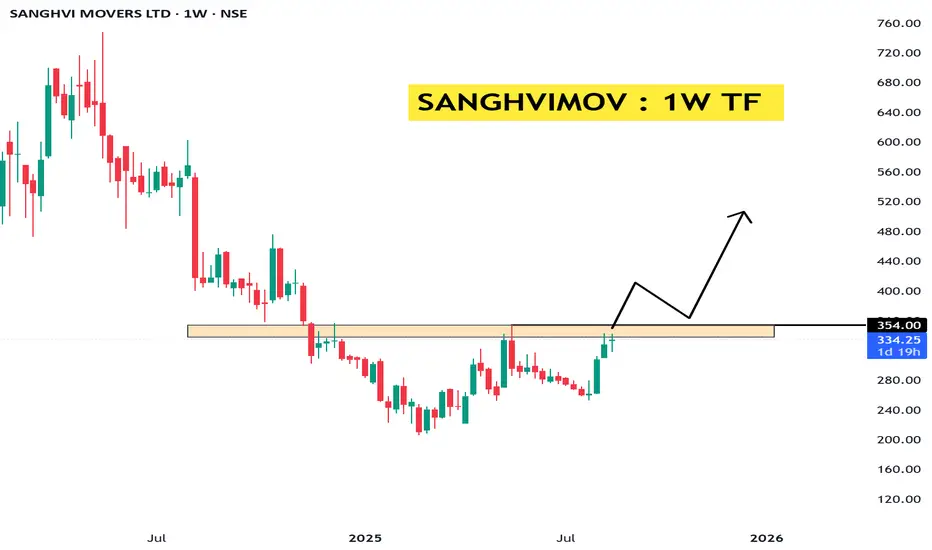
SHANGVIMOV : Heavy Lifter of India’s Infra GrowthNSE:SANGHVIMOV
📊 Technical Analysis (Weekly Chart)
Trend: After a steep fall from ~₹800 (2024 highs) to ~₹200 (2025 lows), the stock has been consolidating and is now attempting to break out of resistance near ₹350–₹360.
Current Price: ₹334.25
Resistance Levels:
₹350–₹360 (immediate supply zone, highlighted in your chart)
₹420–₹450 (next major resistance)
Support Levels:
₹300 (short-term support)
₹250 (major support, bottom zone)
Chart Structure: Formation of a rounding base; breakout above ₹360 on weekly closing can trigger momentum rally.
View: If price sustains above ₹360, potential upside towards ₹420–₹450; failure to break may lead to retest of ₹300.
🏭 Fundamental Analysis
Business Model: Sanghvi Movers Ltd is India’s largest crane rental company and among the top 10 globally. Provides heavy-lift, engineered transport & installation services, especially to wind energy, power, steel, cement, refinery, and infrastructure projects.
Growth Drivers:
Renewable energy push (especially wind and solar projects requiring heavy cranes).
Infrastructure growth under government’s capex focus.
Demand from steel, cement, oil & gas projects.
Financials (Latest FY24/25) (approximate):
Revenue: ~₹650–700 Cr.
Net Profit: ~₹120–130 Cr (steady growth).
Debt levels moderate; improved operating margins due to higher utilization of crane fleet.
Strengths:
Market leader with strong fleet of high-capacity cranes.
Asset-heavy model creates strong entry barriers.
Benefits from India’s renewable & infra capex cycle.
Risks:
Cyclical industry – earnings depend on capex cycles.
High capital expenditure (maintenance, fleet expansion).
Order inflow variability.
🎯 Conclusion
Technical View: Stock is at a crucial resistance zone (₹350–₹360). A breakout with volume could take it to ₹420–₹450. Support at ₹300.
Fundamental View: Strong long-term player in crane rental, directly benefiting from infra & renewable boom. Earnings visibility is improving with higher crane utilization.
👉 Investor Stance:
Investors: Long-term accumulation is possible; positioned well in the infra/renewable growth cycle, though cyclicality risk exists.
⚠️ Disclaimer:
This analysis is for educational and informational purposes only.
We are not SEBI-registered analysts or advisors.
This is our personal view based on available data and market trends.
Please consult your SEBI-registered investment advisor before making any investment or trading decisions.
You are solely responsible for any financial decisions you make based on this content.
========================
Trade Secrets By Pratik
========================
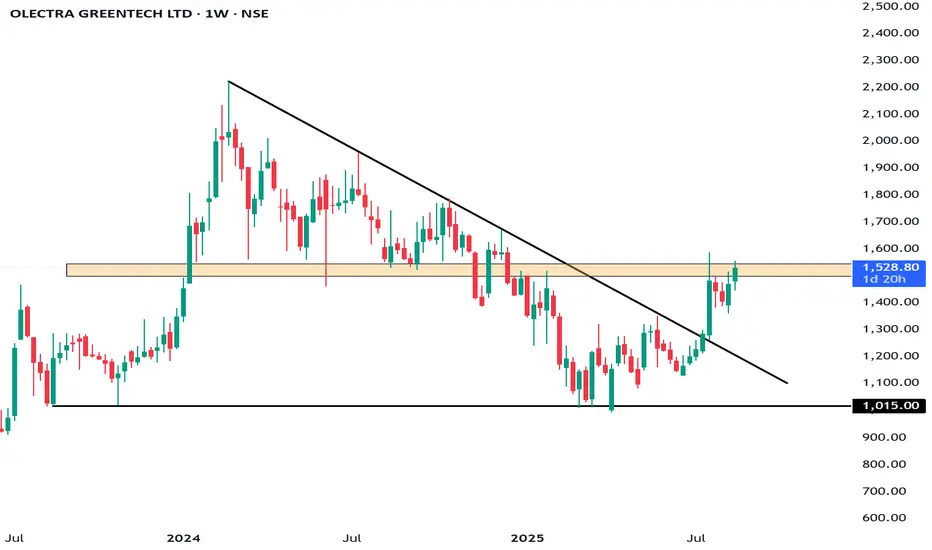
Olectra Greentech – The Silent EV Multibagger in MakingNSE:OLECTRA
📊 Technical Analysis (Weekly Chart)
Trend: The stock had a steep fall from ~₹1,800 (2024 highs) to ~₹1,000 (2025 lows). It has since formed a rounded bottom and is showing signs of reversal.
Current Price: ₹1,528.80
Resistance Levels:
₹1,600 (immediate resistance)
₹1,800 (major breakout level)
Support Levels:
₹1,400 (nearby support)
₹1,200 (major support, recent bottom area)
Indicators:
Momentum improving with strong green candles and higher lows.
Weekly structure suggests accumulation and potential trend reversal.
View: If stock sustains above ₹1,600, it can retest ₹1,800–₹2,000 in medium term.
🏭 Fundamental Analysis
Business Model: Olectra Greentech is India’s largest electric bus manufacturer, part of MEIL (Megha Engineering). It also works on tippers, EV trucks, and composite insulators.
Growth Drivers:
Government’s push for EV adoption in public transport (FAME-II scheme).
High demand for electric buses from state transport corporations.
Strong backing from parent MEIL ensures execution capacity.
Financials (Latest FY24/25) (approximate):
Revenue: ~₹1,300–1,400 Cr (growing rapidly with order wins).
Profit: Still moderate due to high R&D and capex.
Order Book: Over ₹12,000+ Cr, ensuring visibility for next 3–4 years.
Strengths:
Market leader in EV bus space.
Rising government contracts.
First-mover advantage.
Risks:
Execution delays (delivery timelines).
Intense competition from Tata Motors, Ashok Leyland.
Margin pressure due to high input and battery costs.
🎯 Conclusion
Technical View: Bullish reversal forming. Sustaining above ₹1,600 can lead to ₹1,800–₹2,000. Strong support at ₹1,200.
Fundamental View: Strong long-term growth story in India’s EV transition, backed by large order book and government support. Near-term volatility possible, but structurally a good EV play.
👉 Investor Stance:
Investors: Accumulate gradually for 3–5 years; could be a multibagger if execution sustains.
⚠️ Disclaimer:
This analysis is for educational and informational purposes only.
We are not SEBI-registered analysts or advisors.
This is our personal view based on available data and market trends.
Please consult your SEBI-registered investment advisor before making any investment or trading decisions.
You are solely responsible for any financial decisions you make based on this content.
========================
Trade Secrets By Pratik
========================
How to read market TOPS like a pro : Double & Triple TopsIn this video I will breakdown about the concepts of Double and triple tops, they aren’t just reversal signals — they’re blueprints of future price action. Here’s how to read market tops like a pro and anticipate what comes next.

VEDANTA Swing Trade with 1:3 RR (Long)Sellers failed to take price below the demand zone and a clear Change of Character (market structure shift) happened that shows buyers have taken control of the price of Vedanta.
So if Nifty and Metal sector are not bearish in coming sessions, then it is high probability that Vedanta will touch Rs 475.
Don't use hard SL. Manage position sizing as it is a high probability setup.
Connect with me if you have any questions. I am happy to help.
ChoCh - Change of Character
Sw or Sweep - Liquidity Sweep
BoS - Break of Structure

INFY Bullish Setup** IF you like my observation, please boost and follow for more content."
Ticker: INFY
Time Frame: 1-Hour
Trade Type: Bullish
Entry Point: 1486.20
Target Price (TP): 1589.15
Stop Loss (SL): 1417.45
Risk-to-Reward Ratio (RRR): 1:1.5
Trade Setup and Rationale:
Market Context:
INFY has been showing signs of recovery, breaking out of a corrective phase. The price is currently positioned for a potential uptrend, supported by a significant bullish pattern forming on the chart.
Entry Point (1486.20):
The price has recently tested a support zone and is now showing signs of a strong reversal. The entry point is set just above this level, ensuring a confirmation of the bullish trend before committing to the trade.
Target Price (1589.15):
The target is set at a key resistance level where price is expected to face potential selling pressure. This level aligns with previous highs and is a reasonable place to lock in profits while riding the trend.
Stop Loss (1417.45):
The stop loss is placed just below the recent swing low, ensuring that the trade has a controlled risk. This placement minimizes the risk of getting stopped out in case of minor fluctuations while keeping the risk-to-reward ratio favorable.
Trade Logic:
The trade is supported by a bullish breakout pattern with increasing volume. After a period of consolidation, price action is showing signs of upward momentum, making this a high-probability trade setup.
The risk-to-reward ratio of 1:1.5 offers a balanced risk for the potential reward, providing a good trading opportunity with a well-placed stop loss.
Volume Confirmation:
Volume is showing a steady increase as the price starts moving upward, indicating that market participants are supporting the bullish move.
Trend Confirmation:
The trend is confirmed by the price breaking above previous resistance, and the bullish setup aligns with the market structure.

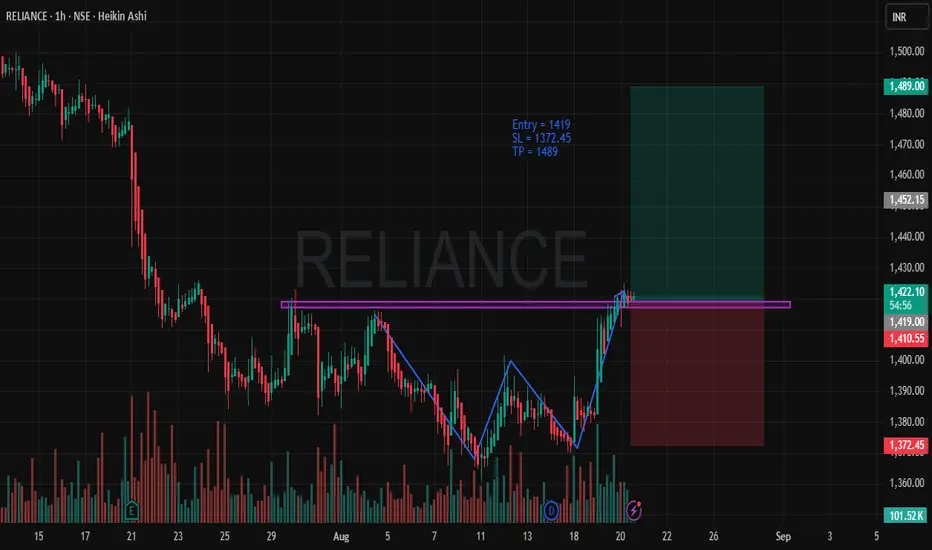
RELIANCE - Bullish SetupTimeframe: 1-Hour
Trade Type: Long Position
Entry Price: 1419
Stop Loss (SL): 1372.45
Take Profit (TP): 1489
Risk-to-Reward (RRR): 1:3.53
Trade Rationale
Bullish Trend Setup: The price action is showing a clear bullish momentum as RELIANCE has recently broken through a significant resistance level (indicated by the purple line). This breakout is a strong signal of potential upward movement.
Chart Pattern: The price forms a classic double bottom pattern (highlighted on the chart), which signifies a reversal from a downtrend to an uptrend. The pattern is confirmed with strong volume, showing the increased participation of buyers.
Entry Point: We are entering this position at 1419, right after the price breaks the resistance and starts moving upwards. This breakout marks the start of the potential rally.
Stop Loss: The SL is placed at 1372.45, just below the recent swing low, ensuring a safe exit if the market decides to reverse.
Take Profit: The TP is placed at 1489, a logical price target that accounts for a solid risk-to-reward ratio of 1:3.53. This is a reasonable expectation based on recent price action and volatility.
Volume Confirmation: Strong volume is observed, confirming the strength of the move. Typically, breakouts accompanied by high volume are more likely to continue in the breakout direction, supporting the bullish scenario.
Market Conditions: The broader market conditions appear favorable for long positions, with sentiment and technical indicators showing bullish signs across the broader market.
Risk Management
A tight Stop Loss ensures that we minimize risk in case of market retracement, while the Take Profit target allows us to ride the trend and maximize the potential return on this trade.
The Risk-to-Reward Ratio is set at 1:3.53, which aligns with sound risk management principles, allowing for substantial profits even with a lower win rate.
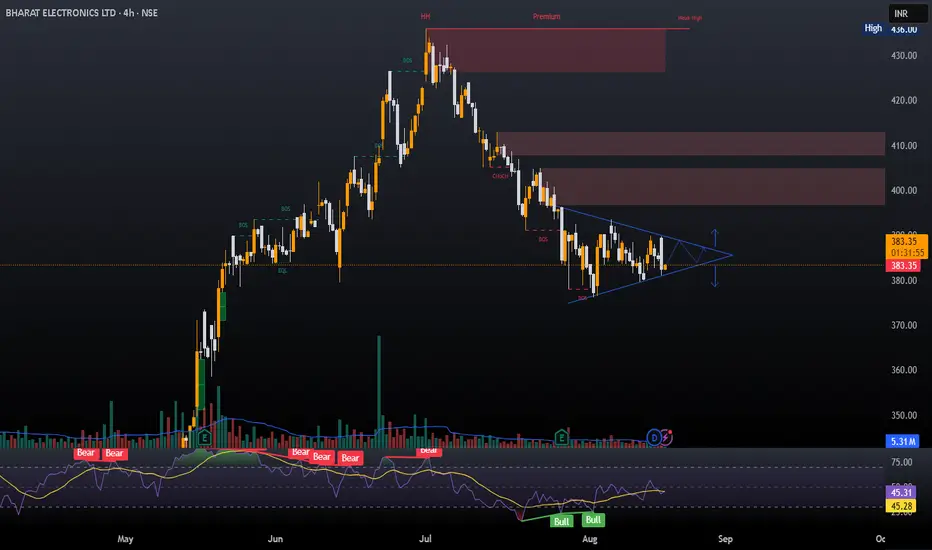
BEL Triangle PatternA long position can be taken in BEL if it breaks out this triangle pattern.
Entry- 383 - 381
Stop Loss- 377
Target- 390, 395, 400
Reason- After a good consolidation BEL has made a triangle pattern. A breakout from the pattern can give a good move.
Disclaimer- This is just for educational purpose. Please take advice before making any decision.
Jai Shree Ram.
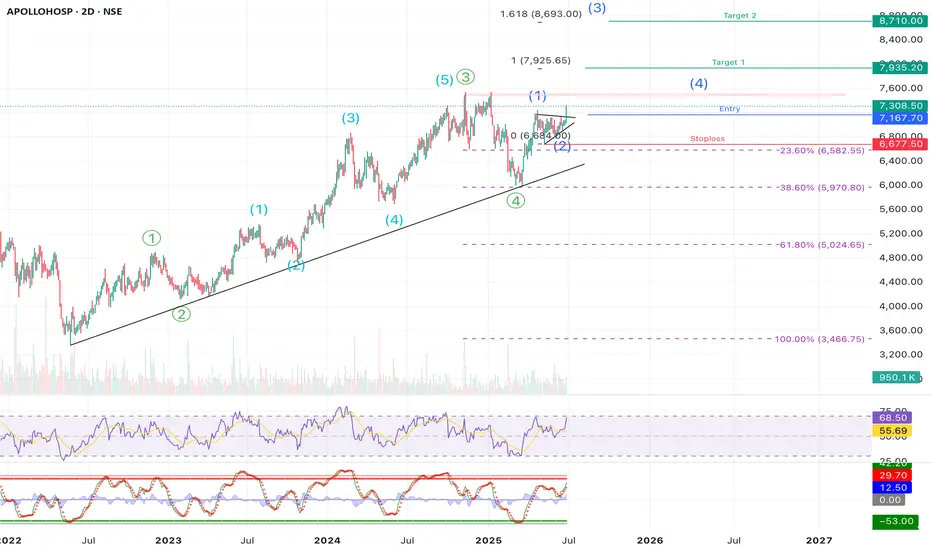
APOLLOHOSP | Swing | Breakout APOLLO HOSPITAL – Elliott Wave Structure + Breakout Opportunity Ahead
Apollo Hospitals is showing a textbook Elliott Wave formation, and we might just be at the beginning of a fresh impulsive rally. If you’re a swing trader or positional investor, this setup is worth keeping a close eye on.
⸻
🧩 Elliott Wave Count Analysis
• The stock is in a larger degree 5-wave move (marked in green). Within that 1-4 completed and wave 5 in progress.
• Within that, we can also see a new 5-wave impulsive structure developing (in blue), and it seems like we just completed Wave (2) of this new leg.
• This means — Wave (3) could be starting now, which is usually the strongest and fastest wave.
⸻
📈 Trade Setup
• Entry Zone: Around ₹7,165–₹7,215
• Stoploss: ₹6,677 (just below recent swing low and invalidation of the current wave count, Around 7-8% )
• Target 1: ₹7,925 (around 10%+ )
• Target 2: ₹8,710 (around 25%)
• Extended Target (Wave 3 Fibonacci Extension): ₹9,167
The targets are based on Fibonacci extension levels from Wave (1) to Wave (2), which typically project the length of Wave (3).
⸻
🔍 Supporting Technicals
✅ Trendline Support
• Price has been respecting a long-term rising trendline since early 2022 — a strong sign of continued bullish momentum.
✅ RSI & Stochastics Turning Up
• RSI is rising but not overbought — suggesting more room for upside.
• Stochastic oscillator is also showing a bullish crossover, confirming early momentum for the next wave up.
⸻
⚠️ Risk Management Note
If price drops below ₹6,677 and breaks the trendline, that would invalidate this Elliott wave count. It’s wise to exit or reduce exposure in that case. This is key to avoid being caught in a deeper corrective phase.
⸻
📝 Summary:
Apollo Hospitals appears to be starting a fresh Wave (3) after completing a healthy correction. With a clean Elliott Wave structure, trendline support, and supportive indicators, the setup looks strong. Risk is clearly defined and the reward potential is high — a good case for a swing position.
⸻
💬 Are you tracking this Wave 3 setup too? Let’s hear your thoughts in the comments below!
Disclaimer:
This analysis is shared for educational and informational purposes only. It is not investment advice or a recommendation. Please consult a SEBI-registered financial advisor before making any investment decisions. The author is not responsible for any losses arising from trading or investing based on this analysis.
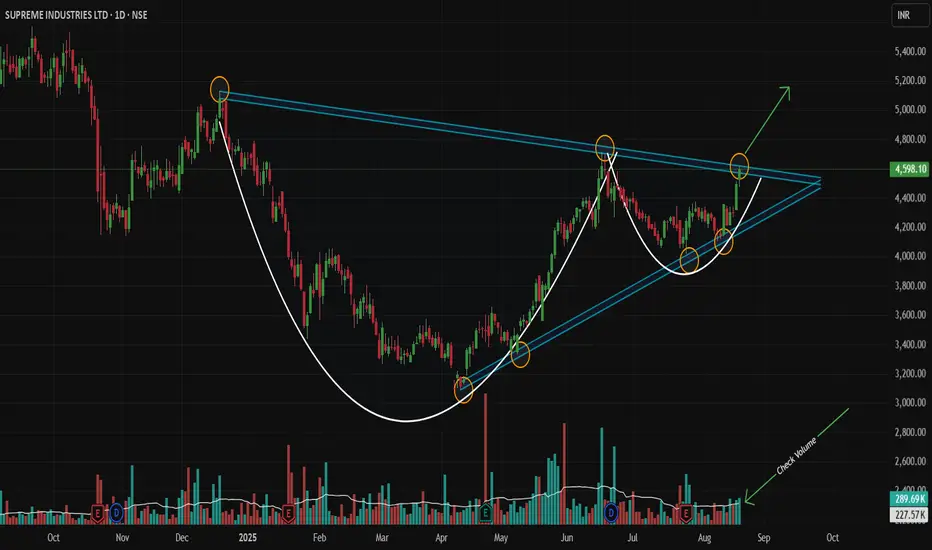
Nested Bullish Patterns Signal Major Breakout!Script: NSE:SUPREMEIND | Timeframe: Daily | Analysis Type: Technical (Pure Price Action) | Patterns: Symmetrical Triangle + Cup & Handle
Idea Summary 💡
A powerful, nested pattern setup is concluding on the daily chart! A large Symmetrical Triangle contains a secondary Cup and Handle (Bullish) pattern. This rare confluence signals strong accumulation and suggests an imminent, powerful upside breakout is likely!
Chart Pattern Logic 🔍
Primary Pattern (Symmetrical Triangle): Characterized by descending resistance (highs: Dec-18-2024, Jun-17-2025) and ascending support (lows: Apr-9-2025, May-9-2025, Jul-24-2025).
Secondary Pattern (Cup & Handle): Formed entirely within the triangle, adding a potent layer of bullish confirmation.
Confluence: This pattern-within-a-pattern setup significantly amplifies the potential for a strong upward resolution.
Trade Thesis 📈
Price is coiling at the triangle's apex under immense pressure. A decisive break above the upper trendline could ignite the next major bullish impulse phase.
Trade Setup ⚡
Direction: LONG 🟢
Entry Trigger: WAIT for a strong Marubozu green candle 🕯️ to close above the triangle's trendline on high volume (min. 1.5x average).
Stop Loss: Below the low of the breakout candle. 🛑
Profit Targets: 4700 🎯 | 4800 🎯 | 5125 🎯
Long-Term Target: 6000+ (Extended Target Based on Pattern Confluence & Momentum) 🚀
Risk Management: Trail stops aggressively after Target 1.
Got another stock you want me to break down? 📊
Drop the ticker in the comments below! If you found this idea useful, like and follow for more pure price action analysis.
Disclaimer: This post/information is solely for educational purposes and should not be construed as a recommendation or financial advice. Trading carries a risk of loss. Please conduct your own research or consult a financial advisor before making any investment decisions. The author and TradingView are not liable for any financial losses incurred based on this content.
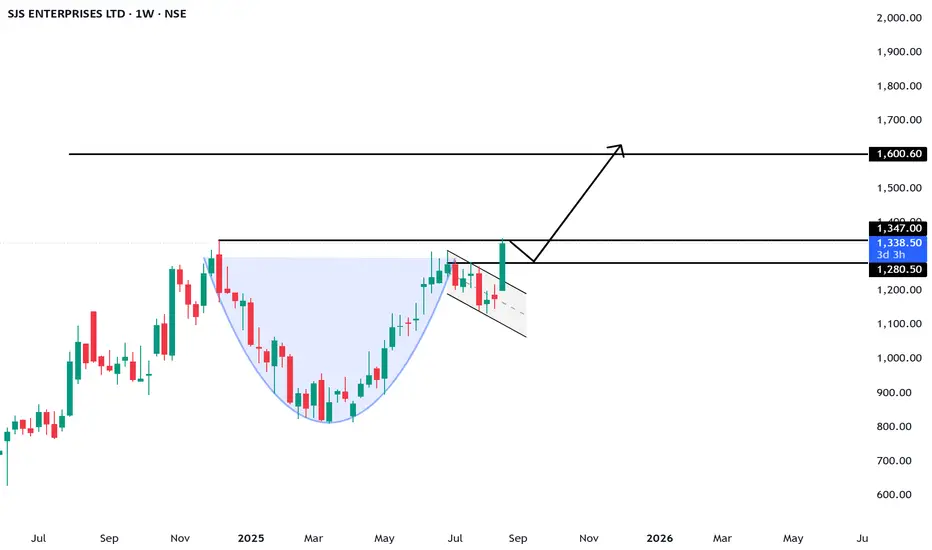
SJS Enterprises: The Silent Multi-bagger in the Making ??NSE:SJS
📌 SJS Enterprises Ltd. – Detailed Analysis Report
1. Company Overview
Leading decorative aesthetics solutions provider (decals, overlays, 3D appliqués, badges, domes).
Serves automotive, consumer appliances, and healthcare sectors.
Manufacturing in Bengaluru & Pune with exports to Europe, North America, Latin America, and ASEAN.
Strong OEM relationships and quality certifications.
2. Financial Performance
Revenue Growth: ₹370 Cr (FY22) → ₹760 Cr (FY25), CAGR ~26%.
Net Profit: ₹55 Cr (FY22) → ₹119 Cr (FY25), CAGR ~29%.
Margins: Stable ~15–16%.
Return Ratios: ROE ~18%, ROCE ~17%.
Debt Levels: Virtually debt-free.
3. Valuation Snapshot
Current Price: ~₹1,330.
P/E ~30x, P/B 5.5x → slightly expensive vs. fair value (₹950–1,000).
Analysts remain bullish with targets between ₹1,400–1,700.
4. Technical View
The stock recently broke out near ₹1,350 with strong momentum (+43% in last 6 months).
Support zone: ₹1,150–1,200.
Resistance: ₹1,350–1,400; breakout above could lead to ₹1,500+.
5. SWOT & Growth Prospects
Strengths: Diversified portfolio, strong financials, global reach, debt-free balance sheet.
Weakness: Expensive valuation, low dividend yield.
Opportunities: EV adoption, growth in appliances & healthcare aesthetics, acquisitions boosting scale.
Threats: Auto sector cyclicality, raw material cost pressures.
6. 3-Year Price Projection
Bull Case: ₹2,500–2,800 (23–27% CAGR) – if high growth and premium valuation sustain.
Base Case: ₹1,950–2,100 (13–16% CAGR) – steady growth with fair valuation.
Bear Case: ₹1,400–1,500 (1–4% CAGR) – slower growth and valuation compression.
7. Conclusion
SJS Enterprises is a high-quality, growth-oriented company with strong fundamentals, global presence, and minimal debt. Valuations are stretched, but long-term demand from EVs, appliances, and healthcare supports growth.
Long-term investors: Can hold for potential multibagger returns.
New investors: Best to enter on dips near ₹1,200–1,250.
Traders: Momentum above ₹1,400 can drive near-term rally toward ₹1,500+.
⚠️ Disclaimer:
This analysis is for educational and informational purposes only.
We are not SEBI-registered analysts or advisors.
This is our personal view based on available data and market trends.
Please consult your SEBI-registered investment advisor before making any investment or trading decisions.
You are solely responsible for any financial decisions you make based on this content.
========================
Trade Secrets By Pratik
========================
ELGIEQUIP (ELGI EQUIPMENTS)ELGIEUIP has re-tested the breakout and looking good, moving above 20-50ema.
Keep an eye on it.
✅ If you like my analysis, please follow me as a token of appreciation :)
in.tradingview.com/u/SatpalS/
📌 For learning and educational purposes only, not a recommendation. Please consult your financial advisor before investing.

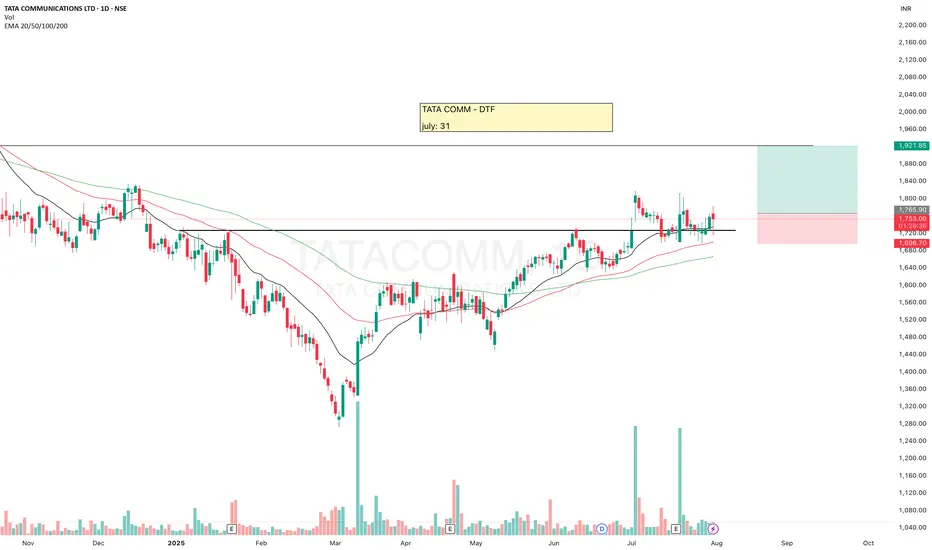
TATACOMMTATACOMM gave breakout after making HH-HL formation
Re-tested and now there is probability of an upside move. SL is must.
✅ If you like my analysis, please follow me here as a token of appreciation :)
in.tradingview.com/u/SatpalS/
📌 For learning and educational purposes only, not a recommendation. Please consult your financial advisor before investing.
Breakout or Support? How to Decode a Stock’s True BehaviorIn this video I will show a Smarter Way to Read Charts, Breakout vs Support — The Fine Line Every Trader Must Know .
Disclaimer: This video is for educational purposes only and is based on historical charts. It is not financial advice. Please consult a registered advisor before making any trading decisions.

Gold Plan 18/08 – Captain VincentBackground
For the past two days, Gold has repeatedly tested the 3332 – 3334 zone and slipped down to 3323, showing that buyers at this level are losing strength.
The broader trend still leans bullish, but the market is heavily influenced by geopolitics and news events:
📰 US–Russia preparing for a new round of Ukraine talks (15 Aug, Alaska).
🌐 Trump’s tariff stance remains unclear, adding volatility to Gold.
💵 Fed is likely to cut 25bps in September, keeping Gold in “defensive but ready to break out” mode.
➡ With this backdrop, today’s plan requires flexibility: Buy with trend, Sell scalp at key resistances.
1. Buy Scalp – Quick Boarding 🚤
Entry: 3324 – 3326
SL: 3320
TP: 3328 → 3332 → 3336 → 33xx
Note: Only suitable for quick scalps, avoid holding longer.
2. Main Buy Zone – Safe Harbor ⚓
Entry: 3313 – 3311
SL: 3304
TP: 3314 → 3319 → 3325 → 3330
Meaning: This is the main launchpad for buyers if price corrects deeper.
3. Sell Scalp Zone – Storm Breaker 🌊
Entry: 3366 – 3377
SL: 3383
TP: 3362 → 3355 → 33xx
Meaning: Short-term resistance, ideal for quick reaction sells.
4. Main Sell Zone – Watchtower ⛩
Entry: 3396 – 3394
SL: 3402
TP: 3390 → 3385 → 3380 → 33xx
Meaning: Strong resistance zone, highly likely to trigger a bearish reaction.
If broken, Gold may extend further into 34xx.
Today’s Scenarios
If price dips to 3324 – 3326 → Quick Buy Scalp.
If price drops deeper → Prefer to Buy at Safe Harbor (3313 – 3311).
If price rises to 3366 – 3377 → Short-term Sell Scalp.
If price tests 3396 – 3394 → Stronger Sell, this is the main resistance.
Captain’s Note:
"The Gold ship still sails North ⚓ today, but each time it hits Storm Breaker 🌊 or Watchtower ⛩, the sails will drop for a quick strike before retreating. Waves from Trump–Putin headlines and the Fed’s next move may stir up rough seas. Remember, mates: better to miss one trade than let the waves sink the ship." 🏴☠️

POLICYBZR (PB FINTECH LTD.)POLICYBZR gave BO of an old resistance, then re-tested and now seems to be getting ready.
It made VCP pattern. Making Hammer candles, decent volume, above 20-50ema, crossing the resistance again, there is probability of an upside move.
Keep eyes on it 👀
If you like my analysis, please follow me as a token of appreciation :)
in.tradingview.com/u/SatpalS/
For learning and educational purposes only, not trading advice. Please consult your financial advisor before investing.

M&M Short term Swing trade with 1:3.5 RRIf Nifty holds its current level of 24,600 and is not bearish for next two-three trading sessions then
there are high chances that this setup will work and buyers will take control in M&M.
It is a supply & demand + Trend + Liquidity Trap based setup.
The setup looks good but the only concern is the overall market sentiment so take your risk accordingly.
Good Risk to Reward for first Target is 1:3.5
Let me know if you have any questions or doubts.
Happy to help!
Gaurav.

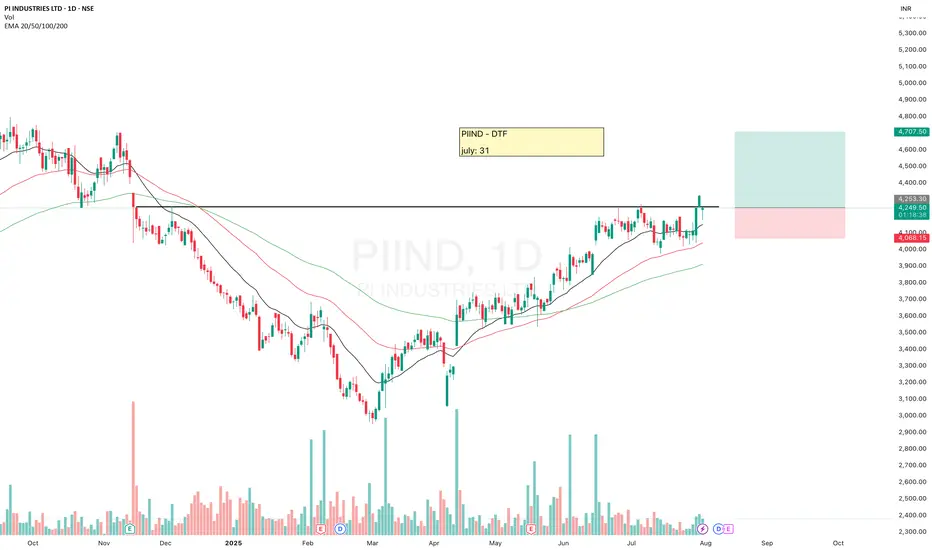
PIINDPIIND is looking good.
It has made HH-HL formation, moving above 20ema and breakout from here may give a good upside move. Keep eyes on it.
✅ If you like my analysis, please follow me here as a token of appreciation :)
in.tradingview.com/u/SatpalS/
📌 For learning and educational purposes only, not a recommendation. Please consult your financial advisor before investing.
Stock Showdown Saturday: Can You Spot the Trade?Disclaimer:
The chart used in this video is from May 2023 (over 3 months old). It is shown only for educational purposes, to demonstrate strategy-building ideas and share trading experience. This is not financial advice and should not be considered as a recommendation to buy, sell, or skip any stock. Always do your own research before making trading decisions.
