Buy, Sell, Retest or Sit Out? | Ep. 1 – Trade Decision SeriesCharts in this video are over 3 months old. This is for educational purposes only, using TradingView’s replay feature to demonstrate strategy thinking and decision-making. Not financial advice.
Swingtrading

Gold Plan 14/08 – Captain VincentGold Plan 14/08 – Captain Vincent ⚓
Background
Yesterday, Gold touched the Sell Scalp zone and cruised smoothly for 220 pips 🎯.
However, it failed to break the previous Buy Zone and is now maintaining a bullish structure on the H1 chart, with higher lows forming.
Today, the market may move slower as traders await the US PPI data , so each entry point must be taken with caution.
Zone 1 – Golden Harbor 🏝️ (Main Buy Zone – SMC Demand)
Entry: 3,334 – 3,332
SL: 3,327
TP: 3,338 → 3,342 → 3,346 → 33xx
Note: This is the main buy zone, aligned with the SMC Demand Zone. Enter only if there’s a clear reversal signal (Pin Bar / Engulfing) on M15/H1.
Zone 2 – Storm Breaker 🌊 (Sell Zone – SMC Supply)
Entry: 3,398 – 3,400
SL: 3,407
TP: 3,394 → 3,390 → 3,386 → 33xx
Note: Strong sell zone. Watch price reaction before entry. Prefer partial profit-taking along the way.
Today’s Scenarios
If price tests Golden Harbor → Wait for pin bar or engulfing, then Buy in line with the uptrend.
If price approaches Storm Breaker → Look for short-term sell setups on reversal signals.
If price stays in the mid-range → Stay on the shore, save energy for the golden moment.
Captain’s Note:
"Today, the golden sea still rides the bullish tide, but the PPI winds may shift without warning. Keep the helm steady, and anchor only at safe harbors." 🏴☠️📈

Gold Plan 13/08 – Captain VincentGold Plan 13/08 – Captain Vincent ⚓
News Background
📊 Gold is holding steady near $3,350/oz after the US July CPI release.
Headline CPI : 2.7% (below forecast of 2.8%) 📉
Core CPI: 3.1% (up from 2.9%) 📈
➡ This cools down inflation fears from tariffs and increases the probability of a 25 bps Fed rate cut in September , which is bullish for Gold.
Key factors to watch:
💼 Market awaiting more data: PPI, jobless claims, retail sales.
🔍 Tariff drama: Trump says no tariffs, but US Customs just listed 1kg & 100oz gold bars under taxable imports.
🌐 US extends the trade truce with China for another 90 days.
🕊 US–Russia talks on Ukraine scheduled for 15 Aug in Alaska.
News conclusion:
Lower-than-expected CPI + higher Fed cut chances = Gold remains positive.
But tariff and geopolitical risks must be tracked closely.
Yesterday’s Action (12/08)
Gold tapped the Buy Scalp – Quick Boarding 🚤 zone and bounced ~290 pips .
However, it failed to break decisively above the zone and moved sideways around support.
Technical Plan – 13/08
1. Sell Scalp – Quick Boarding Reverse ⚓
Entry: 3,374 – 3,376
SL: 3,382
TP: 3,368 → 3,362 → 3,355 → 3,3xx
Reason: Short-term resistance, suitable for quick sell scalps when price retests higher.
2. Sell Zone – Storm Breaker 🌊
Entry: 3,405 – 3,406
SL: 3,411
TP: 3,395 → 3,385 → 3,375 → 3,365
Reason: Major resistance zone aligned with previous highs and trend channel.
Scenarios:
Price likely to rise from current sideways range to test either Sell Scalp or Storm Breaker.
Priority: Sell if reversal signals (pin bar, engulfing) appear on M15/H1 at these zones.
If price breaks above Storm Breaker and holds above 3,411 → cancel sell plan, wait for new structure.
Captain’s Note:
"The CPI wave has anchored the Gold ship near 3,350. Today, the crew is ready to set sail towards Sell Scalp and Storm Breaker, waiting for the winds to shift for a profitable turn." ⚓🌊

Gold Plan 12/08 – Captain VincentGold Plan 12/08 – Captain Vincent ⚓
Background:
After sliding from the Storm Breaker 🌊, Gold has broken below the 3358 zone and successfully retested it. The ship is now heading straight towards the Buy Scalp – Quick Boarding 🚤 dock.
Today’s Plan: Only buy when price reaches the pre-defined support zones — no chasing in open waters.
Zone 1 – Quick Boarding 🚤 (Buy Scalp)
Entry: 3,333 – 3,331
SL: 3,327
TP: 3,336 → 3,339 → 3,342 → 3,345 → 3,348 → 33xx
Note: Fast in & out. Take partial profits at each TP hit.
Zone 2 – Golden Harbor 🏝️ (Main Buy Zone)
Entry: 3,311 – 3,309
SL: 3,305
TP: 3,315 → 3,319 → 3,323 → 3,327 → 3,331 → 33xx
Note: Main accumulation zone. Hold longer if buying momentum stays strong.
Today’s Scenarios:
If price hits Quick Boarding → Wait for a reversal signal (pin bar, engulfing) on M15/H1 before entering.
If price dips to Golden Harbor → Observe the bounce strength; enter only on clear confirmation.
If neither zone is touched → Stay on the shore; wait for the next voyage.
Captain’s Note:
“The Gold ship has left the 3358 waters, turning its bow towards Quick Boarding 🚤. If docking is smooth, the crew will sail out swiftly to the open seas. Golden Harbor 🏝️ remains the main refuge if stronger waves push deeper.”

AXIS BANK | Swing Long Setup 📌 AXIS BANK – Wave 2 Completion & Potential Bullish Wave 3 Ahead 🚀
Axis Bank appears to have completed its corrective Wave 2 and may now be gearing up for the next impulsive rally — Wave 3, which is often the strongest in Elliott Wave theory.
---
🧩 Elliott Wave Structure
Wave 1: Strong rally from the lows earlier in 2025, showing clear bullish intent.
Wave 2: Completed as a complex W–X–Y correction , ending around the 50% Fibonacci retracement zone (₹1,079), which is a common reversal area in Elliott Wave patterns.
The substructure inside Wave 2 (marked as a–b–c, w–x–y) shows corrective nature, indicating that the broader uptrend remains intact.
---
📈 Current Outlook & Key Levels
Current Price**: ₹1,073 (hovering near 50% retracement level).
Support Zones:
₹1,051 (38.2% Fib) – minor support.
₹1,005 (23.6% Fib) – strong support and Wave 2 invalidation watch.
Immediate Resistance: ₹1,128 (61.8% Fib).
Breakout Trigger : A sustained close above ₹1,182 will confirm strength and open the path for higher targets.
---
🎯 Upside Targets (Based on Fib Extensions of Wave 1)
Target 1: ₹1,238 (100% projection).
Target 2: ₹1,321 (127.2% extension) – strong Wave 3 projection zone.
---
🔍 Indicators & Market Context
✅ Price has respected the 50% Fibonacci retracement, showing early signs of buyers stepping in.
✅ Moving averages are starting to flatten, and a bullish crossover could be on the way once price pushes above ₹1,128.
✅ Volume remains moderate; a spike in buying volume on breakout would add confidence to the bullish scenario.
---
⚠️ Risk Management
> If price drops below ₹1,005 (Wave 2 low), the bullish Elliott count would be invalidated, and deeper correction may follow. In such a case, it's better to step aside and wait for a fresh setup.
---
📝 Summary
> Axis Bank seems to have finished its Wave 2 correction and is preparing for a possible Wave 3 rally. A breakout above ₹1,182 could start the next bullish leg towards ₹1,238 and ₹1,321. Until then, watch the key supports at ₹1,051 and ₹1,005.
---
**Disclaimer:**
This analysis is for educational purposes only and is not financial advice. Please consult a SEBI-registered financial advisor before making any investment decisions.
#AxisBank #ElliottWave #SwingTrading #Wave3 #PriceAction #TradingViewIndia #TechnicalAnalysis
---

LLOYDSME LLOYDSME is looking good.
It has re-tested the BO and now bouncing from the support zone, above 20ema
✅ If you like my analysis, please follow me as a token of appreciation :)
in.tradingview.com/u/SatpalS/
📌 For learning and educational purposes only, not a recommendation. Please consult your financial advisor before investing.

GOLD LONGEntry- 101650-101600
SL- 101200
Target- 102700
Pattern- Gold is making a cup and handle pattern in 1hr TF and is also breaking out of an important resistance zone that 101550. Hence a long trade can be initiated in Gold.
Disclaimer- This is just for educational purpose please take advice before making any decision.
Jai Shree Ram.

METROPOLIS CMP. 2039.60On the weekly chart, the price is showing a strong move to the upside buy above 2050 with a stop loss of 1950 then targets are 2100-2160-2210-2260+. SS of 1985, THEN TARGETS ARE 2090-2150-2200+
#METROPOLIS #BUY #STRONG #WEEKLY

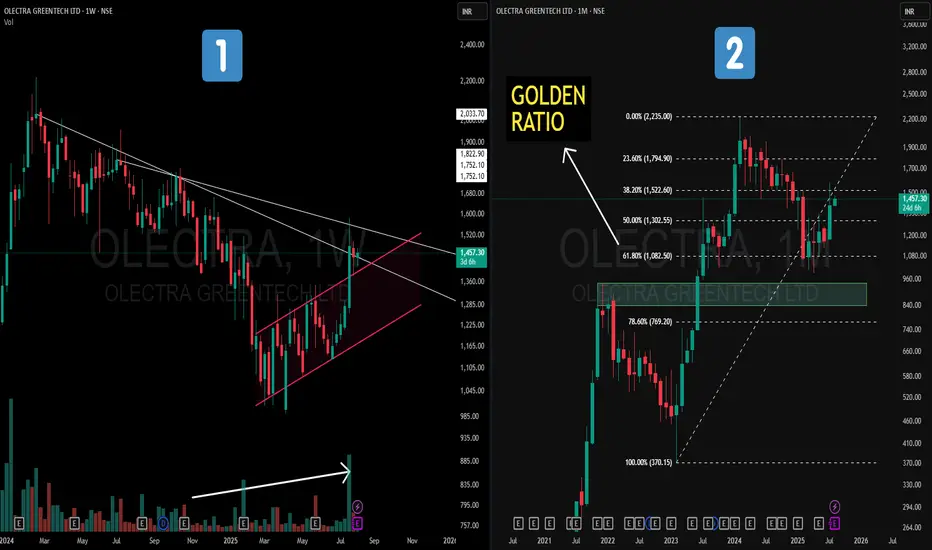
Olectra Greentech – Golden Ratio on MTF + Hidden channel on WTF📝 Description
📌On the Weekly Chart (Left) – Price action has formed a strong counter-trend (CT) breakout from a prolonged downtrend. Hidden within the structure is a parallel channel (highlighted in pink), with volume gradually increasing in the recent rally — a positive sign of accumulation.
📌On the Monthly Chart (Right) – A Fibonacci retracement drawn from the Feb 2023 low to the Feb 2024 high (a one-year strong uptrend) shows price taking support exactly at the 61.8% Golden Ratio. This reaction from a key retracement zone is aligned with historical technical behavior.
This is not a forecast, but rather a technical observation of structure, retracement behavior, and volume dynamics.
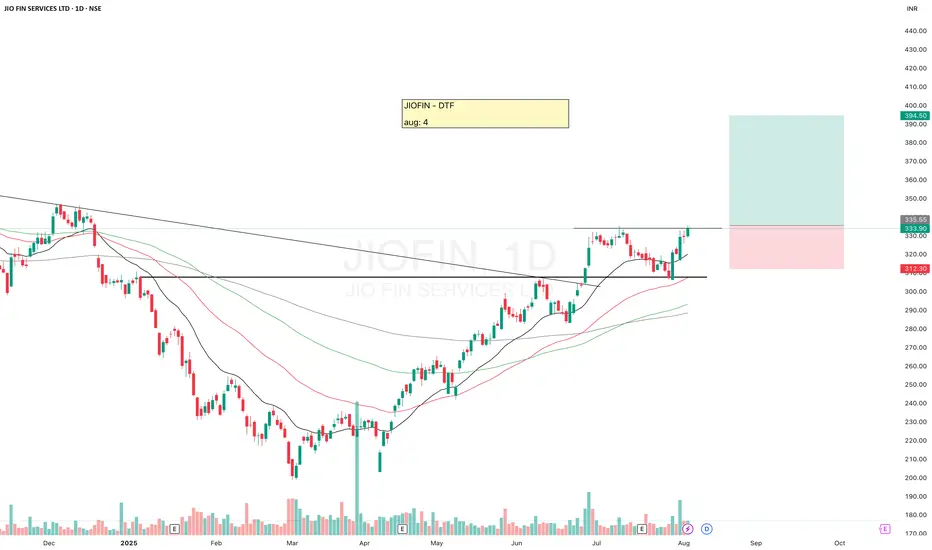
JIOFINJIOFIN is looking good, breakout from here may give a good upside move.
EMAs are aligned, keep eyes on it.
✅ If you like my analysis, please follow me here as a token of appreciation :)
in.tradingview.com/u/SatpalS/
📌 For learning and educational purposes only, not a recommendation. Please consult your financial advisor before investing.
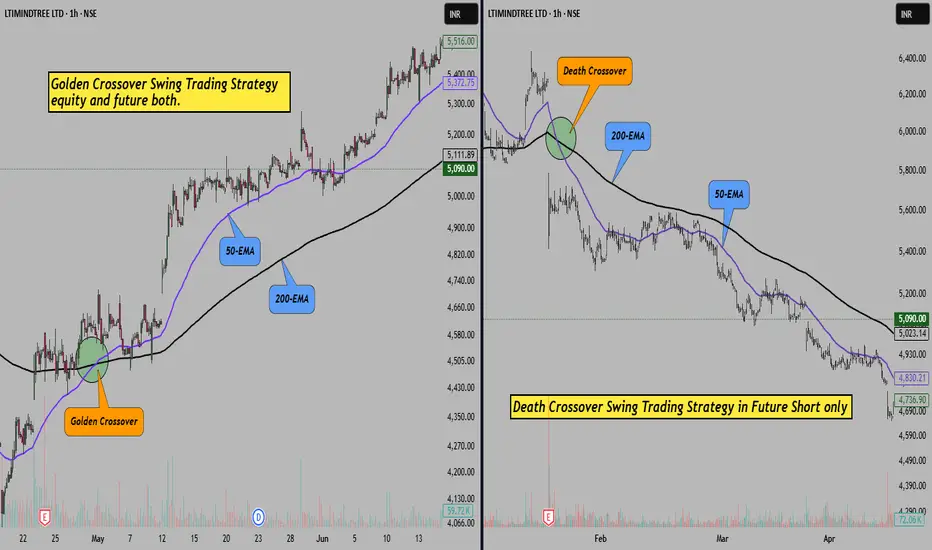
Golden EMA Setup – Catch Medium-Term Trends with 50 & 200 EMA!Hello Traders!
One of the simplest yet most powerful ways to identify long-lasting trends is by using moving averages. And among all combinations, there’s one that stands out for swing and positional trades, the Golden EMA Setup .
It uses just two tools: the 50 EMA and the 200 EMA. When used correctly, this setup helps you ride big trends and avoid choppy zones.
Let’s understand how this works and how you can apply it.
What is the Golden EMA Setup?
It’s a trend-following strategy based on the crossover of two EMAs:
50 EMA (Fast Average): Reacts quicker to price changes
200 EMA (Slow Average): Represents the long-term trend
When 50 EMA crosses above 200 EMA, it’s considered a Golden Crossover , a bullish signal.
When 50 EMA crosses below 200 EMA, it’s a Death Crossover , a bearish signal.
How to Trade This Setup:
Entry:
Buy when 50 EMA crosses above 200 EMA and price is above both.
Stop Loss:
Just below the 200 EMA or recent swing low.
Target:
Trail the stop loss and ride the trend till the crossover reverses or price weakens.
Timeframe:
Works best on daily or 1-hour chart for positional/swing trades.
Rahul Tip:
Golden EMA setup works great during trending phases, but avoid using it in sideways markets — you may get trapped in whipsaws. Always confirm with volume or RSI divergence before entering.
Did you ever used this strategy before, let me know in comment box.
Supply & Demand + Patterns: A Simple Yet Powerful Swing StrategyExplore how supply-demand zones interact with patterns to create high-probability setups. This session breaks down rallies, pullbacks, and a simple process to start building a reliable swing trading strategy . Clear, structured, and beginner-friendly.

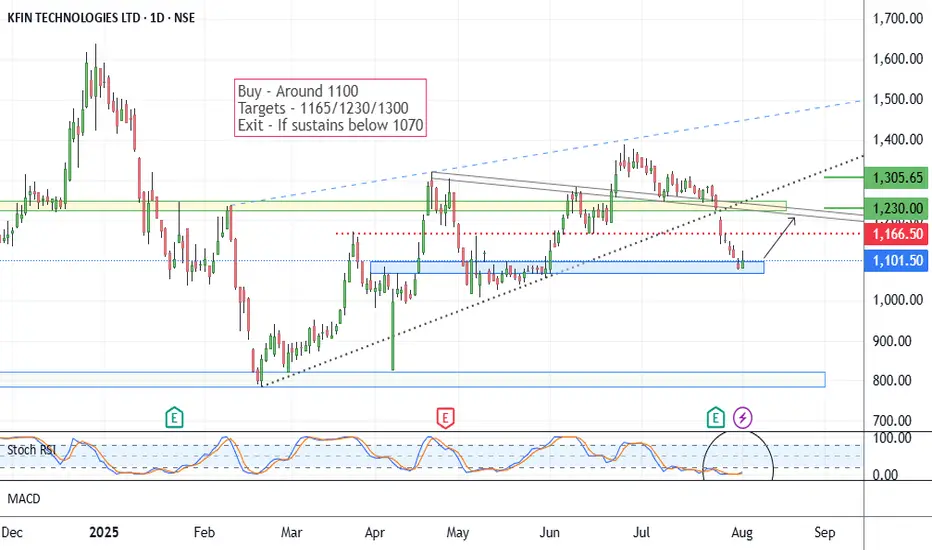
Kfintech - Positional Long SetupIn the last month of July, the stock price fell from 1380 to 1100. Presently seems on a support area. As you may see on the chart. This setup is based on a reversal possibility from the support range around 1080.
Stochastic RSI shows a reversal sign.
Possible targets may be 1165/1230 and 1305.
If it sustains below 1070-1050 levels, the setup will go weak. Below 1070, the exit plan should be considered.
One has to keep the position size according to the risk management.
All these illustrations are my personal view, only for learning and observation purposes; this is not buying or selling advice.
All the best.
TRENT LONGEntry- 5080-5100
Target- 5200, 5300, 5350
SL- 4950
Reason- After a good fall Trent made a base by trading in a range and now it is breaking out of that range. (Range breakout Trade)
Disclaimer- This is just for educational purpose.
Jai Shree Ram.

Nifty May Slide to 22000 — Here’s the Technical BreakdownNSE:NIFTY
Why Nifty May Slide to 22000 – A Comprehensive Technical and Macro-Economic Analysis
---
🔹Summary:
The Indian stock market, led by the Nifty 50, appears to be entering a corrective phase. Based on a comprehensive multi-timeframe technical analysis, combined with deteriorating global cues and domestic economic pressure points, there is a high probability that the Nifty index could fall to the 22000 zone in the coming weeks or months.
---
📊 1. Multi-Timeframe Technical Analysis
🔴 Daily Chart Insights:
Nifty has broken below the 20-day and 50-day EMAs.
MACD has shown a fresh bearish crossover, and the histogram is increasing in negative territory.
Lower highs and breakdown candles indicate short-term weakness.
Immediate support zones: 22800 and 22100.
🔵 Weekly Chart Insights:
After forming a lower high, Nifty has started forming red candles.
MACD on the weekly chart has recently given a bearish crossover.
Price is nearing the 50-week EMA; a breakdown may accelerate the fall to 21084.
200 EMA stands near 20618 – strong medium-term support.
🔶 Monthly Chart Insights:
Long-term uptrend is weakening.
MACD histogram is red, with the MACD line diverging downward.
Historical resistance around 25,000 held strong.
Monthly supports at 23401, 22805, and major zone at 21084.
Extreme correction support zone: 18250.
---
🌎 2. Global Macroeconomic Factors
✉️ Hawkish US Federal Reserve:
Fed remains reluctant to cut rates due to sticky core inflation.
High US yields attract capital back to the US, triggering FII outflows.
⛽ Rising Crude Oil Prices:
Brent crude consistently around \$70+/barrel.
India, a net importer, faces rising import bills, widening the current account deficit.
Higher oil = pressure on inflation + input cost rise for manufacturing and transport sectors.
🇨🇳 China’s Slowdown:
Real estate crisis, deflation risk, and declining exports in China.
Global growth slowdown impacting Indian export-heavy sectors (IT, Pharma).
📈 FII Data:
* FIIs have turned net sellers in recent weeks in both equities and index futures.
* Weak INR (trading near 84) adds pressure to FII outflows.
---
📊 3. Domestic Economic Concerns
📉 Valuation Concerns:
Nifty PE > 22x, above historical mean of 18x.
Many large caps are seeing **EPS downgrades** or flat YoY growth.
Risk of further de-rating if earnings disappoint.
👐 Weakening Sectors:
IT: Margin pressures and delayed tech spending.
Banking: Credit growth tapering, NIM compression.
Auto & FMCG: Rising input cost and subdued rural demand.
🪖 INR Weakness:
A weak rupee leads to expensive imports and inflation.
RBI may have limited ability to control INR due to global currency war.
✈️ Pre-Election Volatility:
Upcoming general elections (2026) cause policy overhang.
Historically, markets correct 6-9 months prior to national elections.
---
🔹 4. Conclusion: Levels to Watch
| 22805 | First technical support / swing low zone
| 22105 | Confluence of horizontal support and Fibs
| 21085 | Weekly structure support
| 20618 | 200 EMA on weekly chart
| 18277 | Worst-case scenario support (panic zone)
---
🔎 Final View:
While the long-term bullish structure of Nifty is not completely broken, signs of a **multi-month correction are strong and building**. The alignment of technical breakdowns with global and economic headwinds suggests a high-probability move toward 22000 or lower. Caution is advised for investors and traders holding long positions.
Actionable Advice: Wait for confirmation reversal signals before entering fresh longs. Maintain strict risk management and monitor key levels closely.
---
⚠️ Disclaimer:
This analysis is for educational and informational purposes only.
We are not SEBI-registered analysts or advisors.
This is our personal view based on available data and market trends.
Please consult your SEBI-registered investment advisor before making any investment or trading decisions.
You are solely responsible for any financial decisions you make based on this content.
========================
Trade Secrets By Pratik
========================

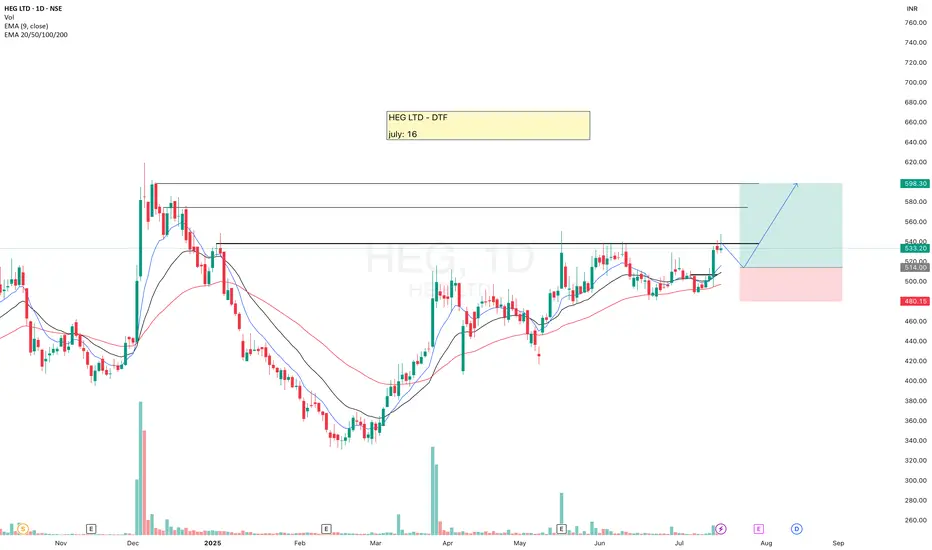
HEGHEG is looking good, moving above 20ema, but I am looking for small retracement for the Entry. In case it starts consolidating at CMP then we'll change our plan accordingly.
Trading is a game of probabilities, keep your ego aside and flow with the market.
✅ If you like my analysis, please follow me here as a token of appreciation :)
in.tradingview.com/u/SatpalS/
📌 For learning and educational purposes only, not a recommendation. Please consult your financial advisor before investing.
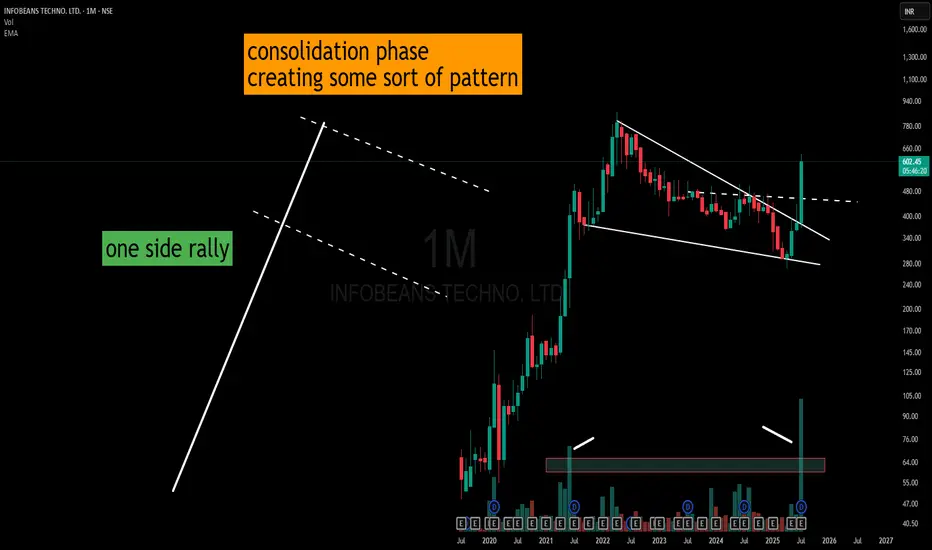
Infobean – Triangle Consolidation with Volume SpikeAfter a sharp one-sided rally, the price entered a prolonged consolidation phase.
Instead of the usual parallel-channel flag formation, the structure has evolved into a descending triangle with slightly lower highs and marginally lower lows.
What stands out is the recent significant volume expansion—often called a “volume buster.” While the shape resembles a pole-then-consolidation setup, the breakout structure and volume shift highlight an important phase change in market activity.
I have only created how I would Draw it and try to get some information out of it.
(This is a structural observation, not a buy/sell recommendation.)
DMART – A Clean Case Study in Patience & Price Action________________________________________
Ticker: NSE: DMART
Sector: Retail – Supermarkets & Hypermarkets
Market Cap: ≈ ₹2.78 lakh crore (approx as of July 30, 2025)
Current Price: ₹4,281.40 (up ~7% on July 30, 2025)
Technical Rating: ⭐⭐⭐⭐⭐
________________________________________
📢 DMart (Avenue Supermarts) Update – July 30, 2025:
If you’re a new investor tracking India’s retail space, DMart just gave us a masterclass in how market sentiment can flip fast — and why fundamentals still matter.
In its Q1 FY26 results, DMart reported a modest 2% profit growth (₹830 cr), despite a solid 16% jump in revenue. This raised concerns among analysts about tight margins and intensifying competition, especially from fast-moving consumer goods (FMCG) and quick-commerce players. Not surprisingly, the stock dipped around 2.6% post-results.
But fast-forward to late July, and the narrative flipped.
On July 30, DMart shares surged 7–8% intraday, marking their biggest rally since March, after announcing the opening of its 426th store and laying out a bold expansion plan. The market cheered the company’s strong growth visibility and confidence in its value-retail model. CEO Neville Noronha emphasized the importance of store additions, digital scaling via DMart Ready, and the company’s resilience in a competitive landscape.
On the digital front, online grocery sales grew 21% YoY to ₹3,502 cr in FY25 — a good sign of consumer shift — though losses widened as DMart expanded into new cities.
What’s the takeaway? For learners, this is a great example of how stocks don’t move just on earnings, but on future guidance, strategy, and investor confidence. DMart may not have wowed with profits this quarter, but its long-term vision still packs a punch.
________________________________________
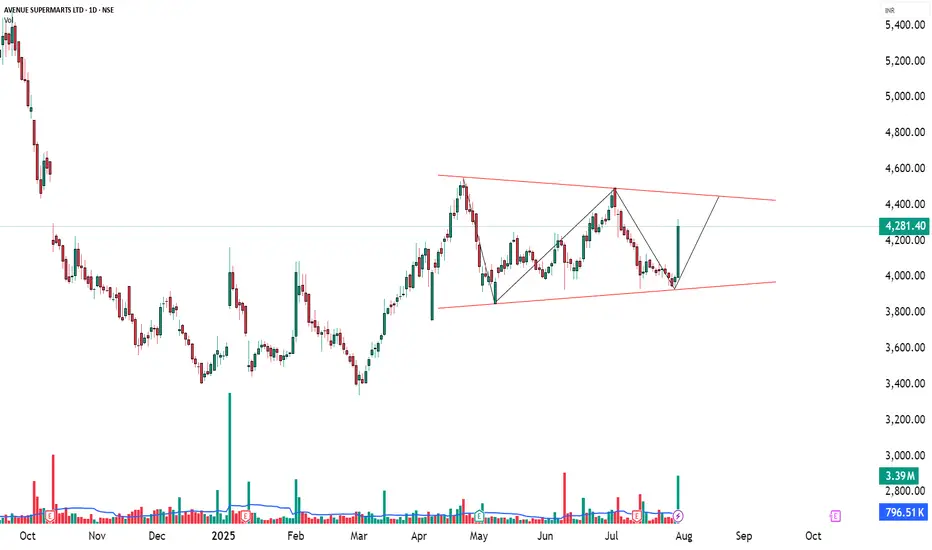
📉 Technical Analysis | Chart Pattern: Potential Breakout Brewing:
DMART has been consolidating in a symmetrical triangle pattern on the daily chart since April 2025 — a classic setup that often signals a big move ahead. On July 30, the stock showed signs of life with a strong 7% gain and a 5× volume spike, which usually reflects institutional accumulation and rising trader interest.
🔍 But here’s the key insight:
Despite the surge in volume, the price has not yet convincingly broken above the triangle’s upper trendline. This means there’s no valid price breakout yet — only a volume-based alert. For newer traders, this is a great example of why volume alone isn't enough. A true breakout needs a strong candle closing above the pattern, preferably with follow-through buying.
________________________________________
🔼 Key Resistance Levels to Watch:
₹4,403 – Recent swing high and immediate target if breakout confirms
₹4,526 – April top and near-term bullish milestone
₹4,728 – Long-term resistance if momentum builds up post-breakout
🔽 Important Support Levels:
₹4,078 – Breakout support zone and first pullback entry area
₹3,876 – Base of the triangle, also a structural support
₹3,753 – Deeper support, invalidation point if breached
________________________________________
🧭 Strategy Insight for New Traders:
This is a textbook case of a "breakout watchlist" setup. With strong bullish indicators — RSI > 60, MACD crossover, Supertrend flip, and a BB Squeeze breakout setup — the chart is preparing for a move. But confirmation is key.
✅ Wait for a clear breakout above the trendline with sustained volume
✅ Avoid chasing the move too early — breakout traps are common
✅ If the breakout confirms, ₹4,403 and ₹4,526 become logical targets
✅ A retest toward ₹4,080 could offer a low-risk long entry if supported by volume
________________________________________
🧠 Pro Note for Beginners: A breakout isn’t just about price jumping — it’s about structure, confirmation, and follow-through. Think of volume spikes as the "whispers" before the market makes a bold statement.
________________________________________
🔍 Fundamental Analysis:
If you’re just starting out in stock market investing, DMART offers an interesting case study—a well-run retail company with strong fundamentals and a clear growth story. As of July 2025, DMART has shown solid performance, especially in revenue growth, while keeping debt levels incredibly low.
In Q1 FY26, the company posted standalone revenues of ₹15,932 crore—up 16.2% YoY—highlighting strong consumer demand and steady growth momentum. Over the full FY25, consolidated revenue rose nearly 17% YoY, reflecting DMART’s consistent top-line performance. However, while revenues are rising fast, margins have seen slight compression. PAT (net profit) for FY25 stood at ₹2,707 crore with a PAT margin of 4.6%, down from 5% a year earlier.
DMART’s earnings per share (EPS) is growing steadily too—₹41.61 in FY25, up ~7% from last year. But with a price-to-earnings (P/E) ratio of ~96x, the stock trades at a steep premium compared to peers, signaling that the market has high expectations for its future growth.
One of DMART’s biggest strengths is its minimal debt—the company operates with almost zero leverage, giving it exceptional financial flexibility. It also generates healthy free cash flows from its core retail operations, though its online grocery venture (DMart Ready) is still in the investment phase, posting losses as it expands.
From a valuation standpoint, DMART is expensive, no doubt. But investors are paying for its scalability, low-risk model, and disciplined management. With 415 stores across India and consistent quarterly additions, the company continues to grow organically while maintaining a lean balance sheet.
🔔 Bottom Line for Beginners: DMART is a financially strong and well-managed company with proven business fundamentals. But with a very high valuation and slowing profit growth, new investors should be cautious. It may be wise to watch for better entry points or wait for earnings to catch up with the price. For long-term investors with patience and a high-quality bias, it could still be a worthy contender—especially if margins and digital growth improve.
________________________________________
📈 DMART Chart Study – Educational Swing Trade Example:
Disclaimer: This is an educational post intended to help new traders understand breakout setups. This is not a recommendation to buy, sell, or hold any stock or security. Always consult your registered financial advisor before making any trading decisions.
If you're learning how swing trades work, this DMART daily chart setup from July 30, 2025, offers a great example of how price action, volume, and key levels can come together. It’s a practical case study to understand the breakout trading concept.
________________________________________
🛠️ Trade Structure (For Educational Purposes)
Reference Entry Price: ₹4,324.00
Reference Stop Loss: ₹3,925.85
Risk-Reward Scenario: Approx. 1:1, with potential extension to 1:2+ (based on hypothetical higher target)
________________________________________
🔍 Key Chart Observations:
✅ Breakout Candle Formation: A strong bullish candle closed near its high — a typical sign of price strength.
✅ Volume Confirmation: Volume surged to 3.39 million shares, which is over 4× the daily average — often seen in breakout moves.
✅ Price Range Context:
• Support/Base Zone: Around ₹3,340
• Initial Target Zone: ₹4,557.70
________________________________________
📘 Educational Insights:
🔴 Risk-Reward Perspective: At the observed entry level, the risk-to-reward ratio was near 1:1 — not ideal for most strategies. A more efficient trade setup might occur on a pullback or with a more distant target.
🔄 Retest Possibility: If the price retraces to ₹4,150–₹4,200 with lower volume, that zone could serve as a reference for learners exploring re-entry setups (purely for study).
🧠 Capital Risk Planning: Risk management is crucial. Avoid risking more than 2–3% of total trading capital on any single idea, no matter how strong the pattern looks.
________________________________________
📌 Beginner Learning Point:
Breakout trading is more than just chasing big candles. A proper breakout setup usually involves volume surge, clear consolidation range, and defined risk management. Learning to combine these elements is key to developing trading discipline.
________________________________________
🧾 Why I’m Watching DMART — A STWP Perspective for Beginner Investors:
One of the best lessons I’ve learned in my investing journey is this: It’s better to buy a great business at a fair price than a fair business at a great price. And when I look at DMART (Avenue Supermarts Ltd.), I see the foundation of a truly great business — even if the price isn’t quite right just yet.
________________________________________
🛒 A Business Anyone Can Understand:
DMART isn’t chasing trends or building flashy tech. It’s focused on something much simpler — and far more reliable: selling everyday essentials. Groceries, home goods, basics — the things people need no matter what. And they do it efficiently, consistently, and affordably. That simplicity, when executed well, is a major strength.
________________________________________
🧱 A Strong, Repeatable Model:
What really impresses me is their cost discipline. DMART owns many of its stores, keeping rental costs low. They avoid unnecessary frills and instead focus on efficiency and tight operations. The result? A cost advantage that’s tough for others to beat. Even though retail has thin margins, DMART’s model is scalable, profitable, and built for the long haul.
________________________________________
👨💼 Led by a Trusted Name:
The company is backed by Radhakishan Damani — a man known for his patience, clarity, and capital discipline. He’s not in a rush to make headlines. He’s building something durable. And when you find great leadership combined with a focused business model, that’s a rare combo worth watching.
________________________________________
📉 Why This Stock Is on My Watchlist?
In one word: Valuation.
DMART often trades at 80–100 times earnings — which is expensive, even for a wonderful business. As an investor, I’d rather wait for a better deal than rush in and overpay. Great businesses can still turn into poor investments if you don’t get the price right. So for now, I’m staying patient.
________________________________________
📈 If the Price Comes Down…
If the market turns pessimistic or earnings grow into the valuation, DMART will be high on my buy list. Here’s why:
✅ A clean, debt-light balance sheet
✅ A brand people trust
✅ A scalable, cost-efficient model
✅ A long growth runway in India’s retail sector
✅ And thoughtful, no-drama leadership
________________________________________
🪙 Final Thought for New Investors:
As Warren Buffett says, “Time is the friend of the wonderful company and the enemy of the mediocre.”
DMART, in my view, is a wonderful company. I’d love to own it — but only when the price is right. Until then, I’ll keep watching, learning, and staying patient.
(Of course, one could consider buying a small quantity now and adding more on dips — a strategy that balances quality with prudence.)
________________________________________
⚠️ Disclaimer (Please Read Carefully):
This content is shared strictly for educational and research purposes only.
I am not a SEBI-registered investment advisor, and no buy or sell recommendations are being made.
All views expressed are based on personal market analysis and experience. They are not intended as financial advice.
Trading — especially in derivatives like options — involves significant financial risk. Losses can exceed your initial investment.
👉 Always do your own research and consult a certified SEBI-registered advisor before making any investment or trading decisions.
👉 Use proper risk management and only trade with capital you can afford to lose.
The author assumes no responsibility or liability for any trading losses incurred from acting on this content.
By engaging with this material, you agree to these terms.
________________________________________
💬 Found this helpful?
Drop your thoughts, questions, or insights in the comments below ⬇️ — let’s learn together!
🔁 Share this post with your trading friends and community — help them discover clean charts, structured setups, and zone-based learning.
✅ Follow @simpletradewithpatience for clear setups, educational content, and a no-nonsense approach to price action, supply-demand zones, and risk-managed trades.
🚀 Trade with patience. Trust your charts. Stay clear-headed.
Because the goal is not just to trade — it's to trade better.
Be Self-Reliant | Trade with Patience | Learn with Charts & Zones 📊
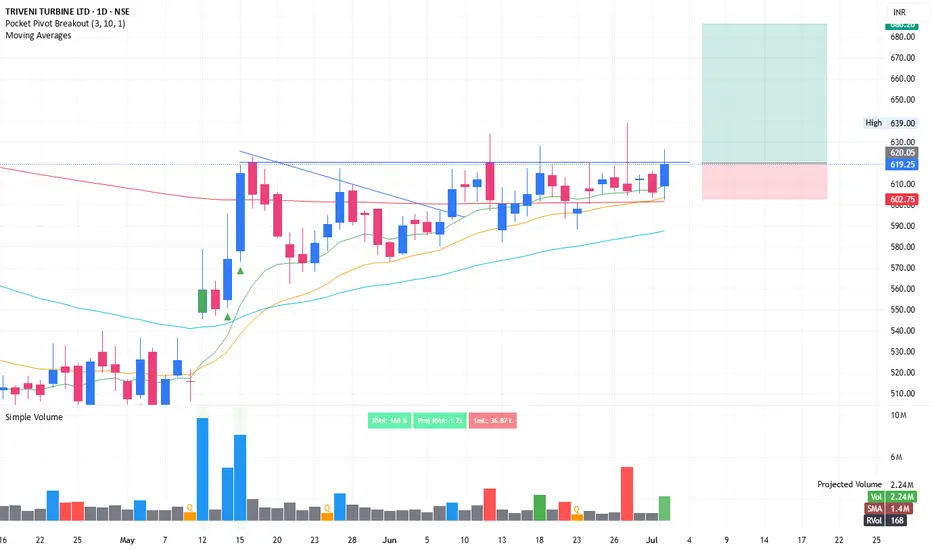
Range break, 1:3 Risk reward, Expecting 10% move in few daysTRITURBINE: Again coming up with swing trade idea. tight consolidation in range of 3% within last 5-6 days. Price is hovering around 10 and 20 EMA. Rejection on 27th Jun shows weak hands going away. Breaking above the pivot line could lead to significant push when crossing with good volume.
SL is somewhere around 3% (Refer the long position drawn over the chart).
One can invest 10% portfolio size as per following calculations
Position sizing and managing risk is the key.
Portfolio is: 1,00,000
Position size: 10,000
Risk 3%: 300. Which means only 0.3% of overall portfolio value is under risk.
Stay connected for commentary for coming days
Disclaimer:
The information provided herein is for educational and informational purposes only and should not be construed as investment advice. The stock analysis and recommendations are based on publicly available information, data sources believed to be reliable, and our interpretation at the time of writing.
Investing in equities involves risks, including the risk of loss of capital. Past performance is not indicative of future results. Readers and investors are advised to conduct their own research or consult a qualified financial advisor before making any investment decisions.
The author(s), affiliates, or associated entities may hold positions in the stocks mentioned, and such positions are subject to change without notice.
We do not guarantee the accuracy, completeness, or timeliness of any information presented, and we disclaim any liability for financial losses or damages resulting from the use of this content.
JSW-INFRA : Powering India’s Port Revolution – A Deep Dive into NSE:JSWINFRA
JSW Infrastructure Ltd.
🧾 Company Overview
Role: JSW Infrastructure is India's second-largest commercial port operator (after Adani Ports), and forms a core part of the JSW Group.
Operations: The company manages and operates major ports across both the east and west coastlines of India.
Revenue Streams: Primarily driven by port operations (handling bulk, breakbulk, containerized cargo), as well as integrated logistics services.
📊 FY24 Financial Snapshot
Revenue ₹3,200+Cr
EBITDA Margin 55–60%
Net Profit ₹750+Cr
Debt to Equity ~0.6x
ROCE ~15%
ROE ~13%
Positive aspects:
Asset Turnover Strong
Double-digit revenue CAGR (>20%) over the past three years.
High EBITDA margins consistent with best-in-class infra businesses.
Well-diversified cargo and customer profile, with increasing non-JSW business.
Stable long-term contracts & beneficiary of India’s logistics and trade reforms.
Risks / Weaknesses:
~70% revenue is from group companies, though diversification is underway.
Aggressive capex plans elevate financial risk.
Susceptible to regulatory, tariff, and environmental compliance changes.
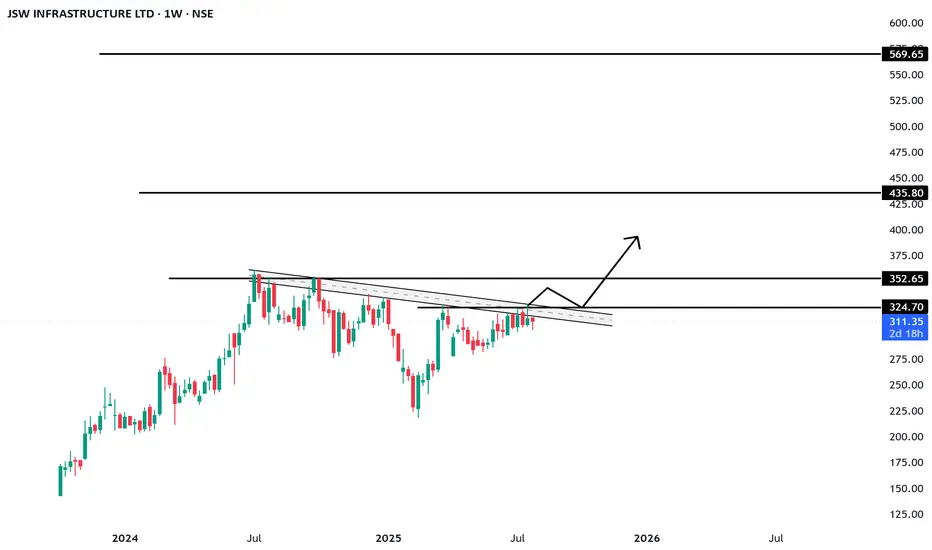
📈 Technical Analysis (July 2025)
• Share Price: Trading in the ₹260–₹280 range. IPO was at ₹119 (Sep 2023); strong price appreciation since listing.
• Trend: Intact uptrend; recently consolidated between ₹240–₹260.
• Support/Resistance: Key support at ₹230–₹235; resistance at ₹285–₹300.
• Moving Averages: Stock remains above both its 50-EMA and 200-EMA — a structurally bullish indicator.
• Momentum:
o RSI: 60–65 (bullish, but approaching overbought)
o MACD: Fresh bullish crossover; volume shows accumulation near breakout.
• Outlook: Breakout above ₹285 could trigger medium-term upside toward ₹320–₹340. Buy-on-dips is favored, with strong accumulation likely in the ₹230–₹240 zone.
🚀 Growth Prospects & Strategic Moves
• Capacity Expansion: Plans to nearly double port capacity by FY30 (from ~160 MTPA to ~300 MTPA).
• Cargo Diversification: Targeting major reduction of group dependency (from ~70% to ~50%) by growing third-party cargo traffic.
• New Projects: Investment pipeline includes both greenfield and brownfield projects in Odisha, Maharashtra, and other states.
• Integrated Logistics: Deeper backward integration into rail connectivity and warehousing to capture higher value from logistics value chain.
• Macro Tailwinds
o Major government initiatives (e.g., Sagarmala) catalyzing sector growth.
o India’s trade/exports rising; strong outlook for cargo and container volumes.
o Shifts in supply chains to coastal shipping and blended logistics.
o Demand uptrend in containerization and warehousing services.
⚠️ Key Risks & Limitations
• High Capex Cycle: Expansion could elevate debt and financial leverage.
• Macro Sensitivity: Lower industrial/output growth would hit cargo volumes.
• Regulatory Overhang: Tariff and ESG regulations present chronic uncertainty.
• Group Concentration: Third-party cargo growth remains an execution challenge.
• Rivalry: Competitive intensity from Adani, DP World, and others is ramping up.
📌 Conclusion & Investment Verdict
Parameter Verdict
Fundamentals Strong, superior margins, efficient operations
Valuation Fair to premium (due to uptrend and growth)
Technical Trend Bullish, ready for potential breakout
Growth Outlook High (supported by sector tailwinds)
Risk Profile Moderate (driven by capex & regulatory factors)
For long-term investors:
JSW Infra presents a compelling case for portfolio inclusion, offering robust growth visibility, sectoral leadership, and operating excellence. Accumulation is best near ₹230–₹240 on dips.
Short-term view:
Stocks in strong uptrends may see minor corrections but are well-placed for fresh breakouts above ₹285, targeting ₹320–₹340.
The stock is ideal for investors seeking infrastructure-sector exposure with high growth potential, but one must remain mindful of execution and regulatory risks.
==============================
==============================
⚠️ Disclaimer:
This analysis is for educational and informational purposes only.
We are not SEBI-registered analysts or advisors.
This is our personal view based on available data and market trends.
Please consult your SEBI-registered investment advisor before making any investment or trading decisions.
You are solely responsible for any financial decisions you make based on this content.
========================
Trade Secrets By Pratik
========================
Update idea
Add note
Trade_Secrets_By_Pratik
Also on:
Disclaimer
The information and publications are not meant to be, and do not constitute, financial, investment, trading, or other types of advice or recommendations supplied or endorsed by TradingView. Read more in the Terms of Use.
English (India)
Select market data provided by ICE Data services.
Select reference data provided by FactSet. Copyright © 2025 FactSet Research Systems Inc.
© 2025 TradingView, Inc.
More than a product
Supercharts
Screeners
Stocks
ETFs
Bonds
Crypto coins
CEX pairs
DEX pairs
Pine
Heatmaps
Stocks
ETFs
Crypto
Calendars
Economic
Earnings
Dividends
More products
Yield Curves
Options
News Flow
Pine Script®
Apps
Mobile
Desktop
Tools & subscriptions
Features
Pricing
Market data
Trading
Overview
Brokers
Special offers
CME Group futures
Eurex futures
US stocks bundle
About company
Who we are
Athletes
Blog
Careers
Media kit
Merch
TradingView store
Tarot cards for traders
The C63 TradeTime
Policies & security
Terms of Use
Disclaimer
Privacy Policy
Cookies Policy
Accessibility Statement
Security tips
Bug Bounty program
Status page
Community
Social network
Wall of Love
Refer a friend
House Rules
Moderators
Ideas
Trading
Education
Editors' picks
Pine Script
Indicators & strategies
Wizards
Freelancers
Business solutions
Widgets
Charting libraries
Lightweight Charts™
Advanced Charts
Trading Platform
Growth opportunities
Advertising
Brokerage integration
Partner program
Education program
Look First
HDFC BANK LTD
NSE•Real-time•Market closed
Edit Idea
Minimize
Close
JSW INFRA : Powering India’s Port Revolution – A Deep Dive into
NSE:JSWINFRA
JSW Infrastructure Ltd.
🧾 Company Overview
Role: JSW Infrastructure is India's second-largest commercial port operator (after Adani Ports), and forms a core part of the JSW Group.
Operations: The company manages and operates major ports across both the east and west coastlines of India.
Revenue Streams: Primarily driven by port operations (handling bulk, breakbulk, containerized cargo), as well as integrated logistics services.
📊 FY24 Financial Snapshot
Revenue ₹3,200+Cr
EBITDA Margin 55–60%
Net Profit ₹750+Cr
Debt to Equity ~0.6x
ROCE ~15%
ROE ~13%
Positive aspects:
Asset Turnover Strong
Double-digit revenue CAGR (>20%) over the past three years.
High EBITDA margins consistent with best-in-class infra businesses.
Well-diversified cargo and customer profile, with increasing non-JSW business.
Stable long-term contracts & beneficiary of India’s logistics and trade reforms.
Risks / Weaknesses:
~70% revenue is from group companies, though diversification is underway.
Aggressive capex plans elevate financial risk.
Susceptible to regulatory, tariff, and environmental compliance changes.
📈 Technical Analysis (July 2025)
• Share Price: Trading in the ₹260–₹280 range. IPO was at ₹119 (Sep 2023); strong price appreciation since listing.
• Trend: Intact uptrend; recently consolidated between ₹240–₹260.
• Support/Resistance: Key support at ₹230–₹235; resistance at ₹285–₹300.
• Moving Averages: Stock remains above both its 50-EMA and 200-EMA — a structurally bullish indicator.
• Momentum:
o RSI: 60–65 (bullish, but approaching overbought)
o MACD: Fresh bullish crossover; volume shows accumulation near breakout.
• Outlook: Breakout above ₹285 could trigger medium-term upside toward ₹320–₹340. Buy-on-dips is favored, with strong accumulation likely in the ₹230–₹240 zone.
🚀 Growth Prospects & Strategic Moves
• Capacity Expansion: Plans to nearly double port capacity by FY30 (from ~160 MTPA to ~300 MTPA).
• Cargo Diversification: Targeting major reduction of group dependency (from ~70% to ~50%) by growing third-party cargo traffic.
• New Projects: Investment pipeline includes both greenfield and brownfield projects in Odisha, Maharashtra, and other states.
• Integrated Logistics: Deeper backward integration into rail connectivity and warehousing to capture higher value from logistics value chain.
• Macro Tailwinds
o Major government initiatives (e.g., Sagarmala) catalyzing sector growth.
o India’s trade/exports rising; strong outlook for cargo and container volumes.
o Shifts in supply chains to coastal shipping and blended logistics.
o Demand uptrend in containerization and warehousing services.
⚠️ Key Risks & Limitations
• High Capex Cycle: Expansion could elevate debt and financial leverage.
• Macro Sensitivity: Lower industrial/output growth would hit cargo volumes.
• Regulatory Overhang: Tariff and ESG regulations present chronic uncertainty.
• Group Concentration: Third-party cargo growth remains an execution challenge.
• Rivalry: Competitive intensity from Adani, DP World, and others is ramping up.
📌 Conclusion & Investment Verdict
Parameter Verdict
Fundamentals Strong, superior margins, efficient operations
Valuation Fair to premium (due to uptrend and growth)
Technical Trend Bullish, ready for potential breakout
Growth Outlook High (supported by sector tailwinds)
Risk Profile Moderate (driven by capex & regulatory factors)
For long-term investors:
JSW Infra presents a compelling case for portfolio inclusion, offering robust growth visibility, sectoral leadership, and operating excellence. Accumulation is best near ₹230–₹240 on dips.
Short-term view:
Stocks in strong uptrends may see minor corrections but are well-placed for fresh breakouts above ₹285, targeting ₹320–₹340.
The stock is ideal for investors seeking infrastructure-sector exposure with high growth potential, but one must remain mindful of execution and regulatory risks.
==============================
==============================
⚠️ Disclaimer:
This analysis is for educational and informational purposes only.
We are not SEBI-registered analysts or advisors.
This is our personal view based on available data and market trends.
Please consult your SEBI-registered investment advisor before making any investment or trading decisions.
You are solely responsible for any financial decisions you make based on this content.
========================
Trade Secrets By Pratik
========================
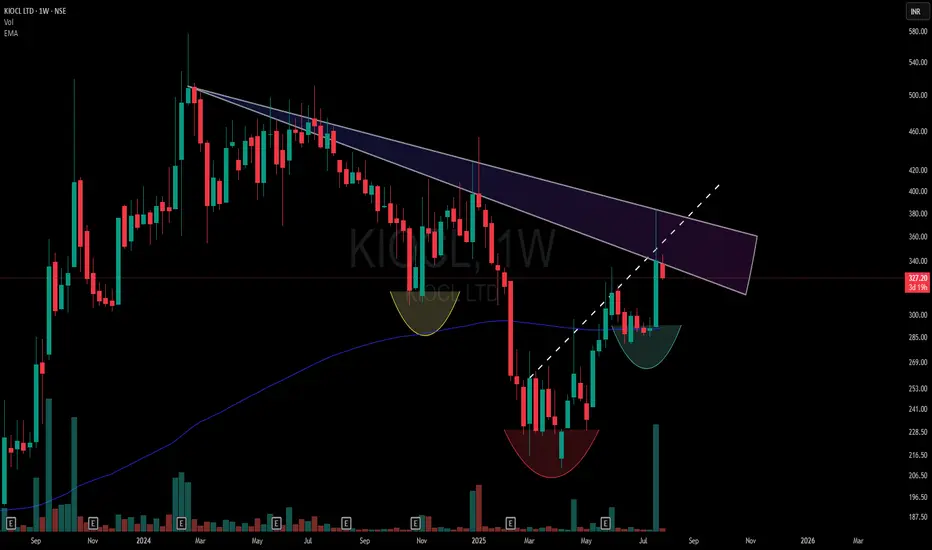
Dual Counter-Trend Zone and Market Structure Shift- This chart highlights a dual counter-trend resistance zone formed by two overlapping CT trendlines (marked in the shaded purple region).
🟡 Yellow Cup – Marks the origin base of the structure (assumed starting shift).
🔴 Red Cup – Establishes a Lower Low Base, still within bearish control.
🟢 Green Cup – Forms a Higher Low Base, showing a market structure change supported by a noticeable volume surge.
- The dotted trendline drawn through the zone acts as a hidden resistance confluence
⚠️ Disclaimer:
This post is non-forecasting in nature. It is not a buy/sell recommendation or financial advice. The chart is shared purely for educational and structural analysis purposes.
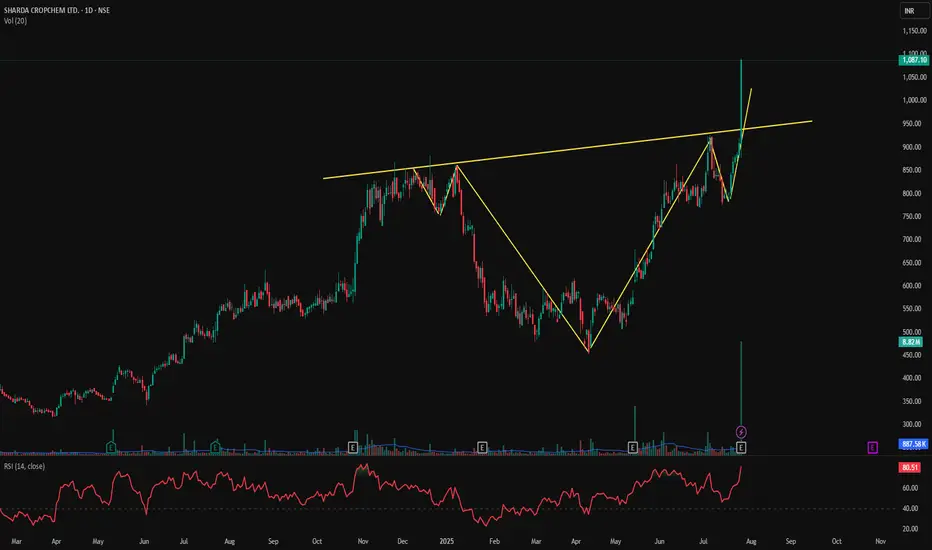
SHARDACROP – Cup & Handle Breakout with Explosive Volume📊 SHARDACROP – Cup & Handle Breakout with Explosive Volume | RSI > 80
📅 Chart Date: July 26, 2025
📍 CMP: ₹1,087.10 (+19.63%)
📈 Symbol: NSE:SHARDACROP | 1D Timeframe
🔍 Technical Analysis Breakdown
☕ Cup and Handle Breakout
A clear Cup and Handle formation has completed.
Breakout above the neckline (~₹940) with a massive bullish candle.
💥 Volume Spike
Volume surged to 8.82M, against the 20-day average of ~887K — institutional buying visible.
This is the highest volume in months, confirming the breakout strength.
📈 RSI (14, close): 80.51
Momentum is extremely strong, entering the overbought zone — may signal continuation or short-term pullback before resuming rally.
📌 Breakout Level: ₹940
📌 Immediate Resistance: ₹1,100–₹1,150
📌 Support on Retest: ₹940–₹960
🎯 Trade Setup
Entry on Retest: ₹960–₹980
Stoploss: ₹920 (below handle base)
Target: ₹1,150 / ₹1,200+
Risk Level: Moderate–High (due to RSI overbought, but pattern is strong)
⚠️ Disclaimer: This is an educational chart setup and not trading advice. Please conduct your own research and risk management.
📣 Follow @PriceAction_Pulse for more such clean breakouts and chart pattern analysis!
🔁 Drop a comment if SHARDACROP is on your radar for the next breakout rally 📈
Institutional Trading Strategies🔍 What Is Institutional Trading?
Institutional trading refers to how large financial institutions, such as hedge funds, investment banks, mutual funds, insurance companies, and pension funds, buy and sell large volumes of stocks, options, futures, and other financial instruments in the market.
Unlike retail traders (individual traders), institutions trade with massive capital, often in millions or billions of dollars. Their actions can move the market, and they use advanced tools, data, and strategies to protect their capital and maximize profit.
🏦 Who Are the Institutional Players?
Here are examples of institutional traders:
BlackRock
Vanguard
JP Morgan
Goldman Sachs
Citadel
Morgan Stanley
HDFC AMC / SBI MF (India context)
These entities manage huge portfolios for clients or for themselves and use highly strategic methods to execute trades.
⚙️ Why Are Their Strategies Different?
Institutional traders have several advantages over retail traders:
Access to better data (real-time order flow, economic models)
Advanced technology (high-frequency trading algorithms)
Lower transaction costs (thanks to bulk volume deals)
Connections (direct access to liquidity providers, brokers)
Skilled teams (analysts, quant traders, risk managers)
But there’s a big challenge: Their trades are so large, they can’t buy or sell in one go. If they do, they’ll cause huge price moves (called slippage). So they use smart strategies to enter and exit positions quietly without alerting the market.
🧠 Core Institutional Trading Strategies
Here are the most important trading strategies used by institutions:
1. 📊 Volume-Based Trading (Accumulation & Distribution)
Institutions use a strategy of accumulating large positions over time (buying slowly) and later distributing (selling slowly). This is done to hide their true intent from the market.
Accumulation Phase: Buying gradually in small chunks to avoid price spikes.
Distribution Phase: Selling in a quiet way so they don’t crash the price.
They might accumulate shares for weeks or months, often using dark pools or algorithms to keep their activity hidden.
2. 🏦 Order Flow Analysis / Tape Reading
Institutional traders track real-time order flow — meaning they study the buy/sell pressure using tools like:
Level 2 (market depth)
Time & sales (ticker tape)
Footprint charts
Delta volume
They watch where large orders are being placed, pulled, or spoofed, giving insight into what other big players are doing.
3. 💻 Algorithmic & High-Frequency Trading (HFT)
Institutions use algorithms (algos) to place thousands of trades per second. These bots follow specific rules based on:
Market trends
Arbitrage opportunities
Statistical models
HFT strategies are extremely fast, aiming to profit from tiny price differences in milliseconds.
4. 🧱 Quantitative Trading
Quant funds like Renaissance Technologies or D.E. Shaw use math, coding, and machine learning to create models that predict price movements.
They may build systems that factor in:
Price action history
News sentiment
Economic indicators
Correlation between assets
Volatility, interest rates
These are not human trades – the models execute trades based on data patterns.
5. 🧩 Options-Based Hedging Strategies
Institutions use options to hedge, speculate, or generate income.
Common techniques:
Protective Puts (insurance for falling stocks)
Covered Calls (collect premium for sideways movement)
Calendar Spreads, Iron Condors, etc. (advanced strategies for theta/gamma/vega exposure)
They often create multi-leg options positions to reduce risk and take advantage of implied volatility.
6. 🏰 Dark Pools Trading
Institutions often trade through dark pools, which are private exchanges not visible to the public. These are used to place large orders without revealing size, so other traders don’t front-run their positions.
Example: An institution may buy 1 million shares through a dark pool instead of a public exchange like NSE or NYSE.
7. 📍 Sector Rotation Strategy
Institutions frequently rotate their capital between sectors based on economic cycles.
In recession: move to defensive stocks (FMCG, Pharma)
In recovery: switch to cyclicals (automobile, banking, infrastructure)
They allocate billions of dollars based on macro themes, earnings cycles, and geopolitical shifts.
8. 🔁 Rebalancing Portfolios
Large funds constantly rebalance their portfolios — buying/selling assets to maintain target allocations. This causes monthly/quarterly flows in stocks or ETFs, which can influence price significantly.
Traders often try to anticipate these flows and trade in the same direction.
📉 How Institutional Traders Enter Positions Quietly
Let’s break down a common stealth strategy:
📘 Step-by-Step Accumulation Example:
Stock ABC trades at ₹100.
Institution wants to buy 5 lakh shares.
If they buy all at once, the price may jump to ₹110+.
So they:
Break order into 5,000 share blocks
Buy at different times of day
Use different brokers/accounts to hide volume
Buy some shares in dark pool
Use algorithm to monitor market depth
After 2 weeks, they complete the buy at an average price of ₹101.
Once they have the position, they might release news or earnings upgrades to support the price.
They hold till price hits their target (say ₹130), then start distributing in small blocks again.
👁 How to Spot Institutional Activity as a Retail Trader?
While you can’t directly see them, you can learn to follow the footprints:
🔍 Clues of Smart Money Activity:
Unusual volume on low-news days
Breakout with high volume but small price move
Price holding key levels repeatedly (support/resistance)
Option open interest buildup
Low volatility periods followed by volume spike
Multiple rejections from the same price zone (indicating accumulation/distribution)
🧠 Mindset of Institutional Traders
What makes institutions successful is not just tools or money — it’s their discipline, planning, and patience. Key principles:
Capital preservation first
Risk-to-reward must be favorable
Avoid emotional decisions
Backtesting before executing strategies
Long-term consistency over short-term wins
📌 Summary – What Can We Learn?
Institutional trading is not magic — it’s structured, logical, and data-driven. As a retail trader, you can’t beat them in speed or capital, but you can:
✅ Learn how they operate
✅ Use similar risk management
✅ Follow the smart money
✅ Avoid emotional trades
✅ Focus on long-term skill building
🏁 Final Thought
The goal isn’t to copy institutional trades, but to understand their footprint and align your trades with their flow. Most successful retail traders grow by observing how smart money moves, then reacting wisely.
You don’t need ₹100 crore to trade like an institution — you need a strategic mindset, discipline, and a plan.
