Intraday Breakouts & FakeoutsIntroduction
If you’ve been trading for any length of time, you've probably heard of the term “breakout”. It sounds exciting—and it is. A breakout can be the start of a big move and massive profits. But what’s less talked about (yet very common) is the “fakeout”—a breakout that doesn’t hold and traps traders on the wrong side.
In the world of intraday trading, understanding breakouts and fakeouts is critical. Many traders lose money not because they don’t spot the breakout, but because they get caught in fakeouts. In this guide, we’re going to deeply understand what breakouts are, how fakeouts trick traders, and how you can trade both effectively.
Let’s dive in.
Part 1: What is a Breakout in Intraday Trading?
In simple words, a breakout happens when the price of a stock or asset moves outside a defined support or resistance level with increased volume.
Imagine the price is stuck between ₹100 (support) and ₹110 (resistance). It keeps bouncing in this range for hours. If suddenly, the price jumps above ₹110, that’s a breakout to the upside. If it drops below ₹100, that’s a breakdown (downward breakout).
Types of Breakouts
Price Breakout
Breaks key support/resistance levels.
Can happen on charts like 5-min, 15-min, or hourly.
Example: Nifty breaking above the day’s high at 10:30 AM with a strong green candle.
Volume Breakout
Price breaks with strong volume. Volume confirms that the breakout is real.
No volume = high risk of fakeout.
Time-Based Breakout
Usually happens during market opening (9:15-10:00 AM) or after lunch session (1:30-2:30 PM).
Institutions are active during these times.
Why Do Breakouts Happen?
A breakout indicates fresh buying or selling interest.
It reflects market consensus that price is ready to move beyond its old limits.
Often driven by news, earnings, or technical pressure (like stop-loss hunting).
Part 2: What is a Fakeout?
A fakeout (fake breakout) occurs when:
Price appears to break a level.
Traders jump in expecting a big move.
But price immediately reverses and traps them.
Fakeouts are deliberate traps—usually set by big players (institutions, smart money) to grab liquidity.
Retail traders often become the liquidity providers for institutions.
Why Do Fakeouts Happen?
Institutions want to fill large orders.
They push prices above resistance to trigger buy orders and stop-losses of short sellers.
Then they reverse the move, causing panic.
End result: Retail traders are left holding losses.
Part 3: Intraday Breakout Trading Strategies
Let’s look at some practical breakout strategies for intraday traders.
1. Opening Range Breakout (ORB)
Define the first 15–30 minutes range after market opens.
Place buy order above the high and sell order below the low.
Wait for confirmation candle and volume spike.
Common in indices like Nifty, Bank Nifty.
Tip: Always avoid trading in sideways markets using ORB. Use it when there’s strong news or momentum.
2. Flag or Pennant Breakout
Price consolidates in a tight flag or triangle after a sharp move.
Breakout of the pattern gives second entry into the trend.
Ideal for stocks showing momentum (e.g., high volume gainers).
3. Break and Retest Strategy
Wait for price to break a level.
Let it come back and retest the breakout point.
If retest holds and reverses in the breakout direction → enter.
Safer than blind breakout entries.
4. Trendline or Channel Breakout
Draw intraday trendlines on 5-min or 15-min chart.
Break of the trendline with good volume = possible entry.
Works well when the price breaks a descending or ascending channel.
Part 4: How to Avoid Fakeouts
Let’s be honest—you can’t avoid fakeouts 100%. But you can reduce them by being smart:
✅ Wait for Confirmation
Don’t enter on the first candle.
Wait for a closing candle above/below the breakout zone.
✅ Use Volume
No volume = No trade.
Use volume bars to check if breakout is real.
✅ Check Higher Time Frame
If 5-min shows breakout, check 15-min or hourly chart.
Are those timeframes supporting the move?
✅ Avoid Trading in Newsless/Sideways Markets
Breakouts in a consolidating or low-volume market are usually traps.
✅ Don’t Chase Breakouts
If price already moved too far from level, skip it.
Chasing leads to bad entries and panic exits.
Part 5: Stop Loss & Risk Management
Even the best setups fail. So risk management is king.
🔹 Where to Place Stop Loss?
Just below breakout candle (for long).
Just above breakdown candle (for short).
Or below the last swing low/high.
Example:
If a stock breaks out at ₹210 and breakout candle low is ₹205, place SL at ₹204.50.
🔹 How Much to Risk?
Risk only 1–2% of your total capital per trade.
Never add to a losing breakout trade.
Use position sizing wisely.
Part 6: Mindset – Stay Neutral, Not Emotional
Fakeouts hurt more mentally than financially.
After 2–3 fakeouts, you may start doubting every breakout.
The key is to follow a process, not feelings.
Keep notes of what works and what doesn’t. Learn from each setup.
Part 7: Bonus – Common Breakout Traps
Breakout Without Volume
Looks tempting, but lacks power.
Almost always fails.
Midday Breakout in Low Volatility
Low chance of success unless news-driven.
Breakouts Near Big Events (like Fed meetings, RBI policy)
Markets often reverse after whipsawing.
Extended Breakouts (after 4-5 green candles in a row)
Usually too late to enter.
Conclusion
Trading intraday breakouts and avoiding fakeouts is both art and science.
Yes, it’s risky. Yes, it’s fast. But with the right knowledge, experience, and discipline, you can turn it into a powerful edge.
To succeed:
Focus on volume, price action, and context.
Have patience to wait for the right setup.
And most importantly, protect your capital using risk management.
Breakouts can give you explosive gains—but only if you avoid the traps that come with them. So stay sharp, stay calm, and trade with a plan.
Swingtrading
BTCUSD 1D TimeframeBitcoin is trading near $117,800 – $118,400
It’s in a sideways consolidation zone after a strong uptrend
📊 Technical Summary
📈 Trend Direction:
Primary Trend: Bullish (long-term)
Short-Term Trend: Sideways to slightly bullish
Structure: Higher highs and higher lows still intact
🔍 Key Support & Resistance Levels
🟢 Support Zones:
$117,000 — Immediate support zone
$115,000 — Minor demand zone
$112,000 — Key swing low support
$108,000 – $110,000 — Strong base if correction deepens
🔴 Resistance Zones:
$119,000 — Current price ceiling
$121,000 — Breakout target
$123,000 – $125,000 — All-time high resistance area
🧠 Indicators Overview
📌 RSI (Relative Strength Index):
Around 58–60
Shows moderate bullishness — not overbought
📌 MACD (Moving Average Convergence Divergence):
MACD line above signal line, but momentum is weakening
Indicates potential slowing of bullish push
📌 Moving Averages:
20-day EMA: Below price — short-term support
50-day EMA: Also below — confirms mid-term uptrend
200-day EMA: Far below — strong long-term bullish signal
🕯️ Candlestick Behavior
Recent candles are small-bodied: suggests indecision
Wicks both sides: market waiting for next trigger
No bearish reversal patterns visible yet

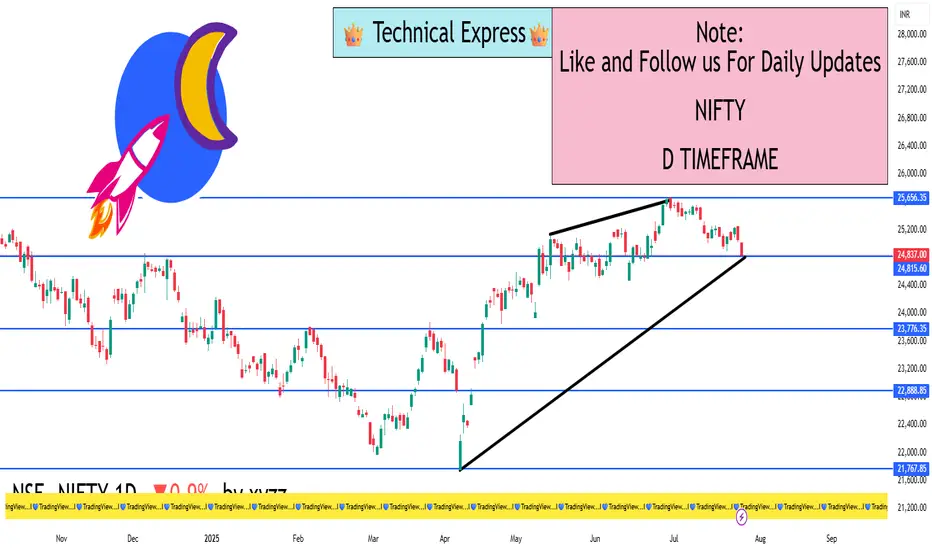
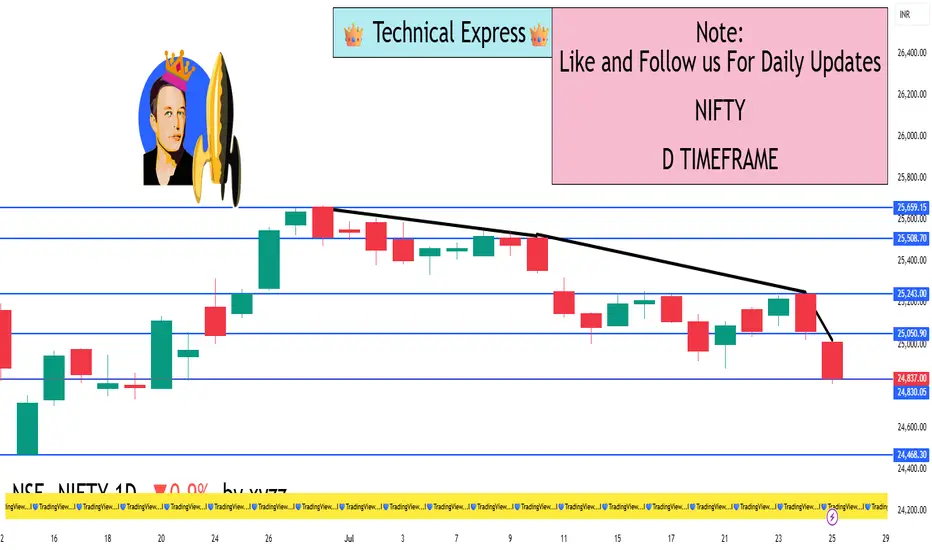
NIFTY 1D TimeframeClosing Price: ₹24,837.00
Daily Change: −0.90% (about 225 points down)
Day’s Range: ₹24,806 – ₹25,010
Volume: Moderate to slightly higher than average
Market Sentiment: Cautiously Bearish
🔍 1D Price Action Summary
The 1-day chart of Nifty shows weakness near a key resistance zone. The index has been trading in a downward-sloping range over the past few sessions. The day began with mild strength but selling pressure pushed the index down by the close.
Bearish candlestick formation with a relatively long upper wick, indicating rejection near intraday highs.
4th consecutive day of weakness, hinting at profit booking and lower highs on the chart.
The price closed near the day’s low, suggesting bearish momentum could carry into the next session.
📐 Technical Levels
✅ Support Zones
Primary Support: ₹24,800 – This level has been tested multiple times recently. A close below it could trigger further downside.
Secondary Support: ₹24,550 – Considered a swing low from earlier this month.
Major Support: ₹24,250 – The breakout level from the previous consolidation.
❌ Resistance Zones
Immediate Resistance: ₹25,050 – This was the intraday high and rejected.
Stronger Resistance: ₹25,250 – Previously a strong support zone, now turned resistance.
Major Resistance: ₹25,500 – All-time high zone; bulls will need strength to retest this.
📊 Trend Analysis
Current Trend: Short-Term Bearish
Medium-Term Trend: Neutral to Slightly Bullish
200-DMA (Daily Moving Average): Nifty is trading above the 200-DMA, keeping the long-term trend intact.
50-DMA: Price is nearing the 50-day moving average. A break below could accelerate selling pressure.
📈 Chart Patterns Observed
Head and Shoulders Pattern (Forming): The right shoulder is under formation; neckline lies near ₹24,800. Breakdown could trigger a short-term fall of 200–300 points.
Bearish Engulfing Candlestick (on the daily): Indicates aggressive seller dominance.
Lower Highs and Lower Lows: A sign of short-term downtrend.
🧠 Institutional & Retail Activity
FIIs (Foreign Institutional Investors): Net sellers over the past few sessions. Sentiment cautious due to global macro uncertainty.
DIIs (Domestic Institutions): Providing some support on dips, but not aggressively buying.
Retail Traders: More active in options and short-term plays; volatility increasing.
💡 Trading Strategy Ideas (Short-Term)
🔻 For Bears (Short-Side Traders)
Consider short positions below ₹24,800 with targets around ₹24,550–24,400.
Use strict stop-loss above ₹25,050 to manage risk.
Bearish bias valid until the price closes above ₹25,250.
🔼 For Bulls (Dip Buyers)
Watch for price action around ₹24,800–24,550 for signs of reversal.
Ideal scenario: bullish engulfing candle or bullish divergence on RSI.
Avoid aggressive buying unless the index reclaims ₹25,250.
🕯️ Candle Psychology Summary
The market opened near flat, tried to move higher, but was met with consistent selling.
This created a long upper wick – a sign that bulls lost control quickly.
The close near the low signals sellers had the upper hand all day.
🚨 Key Takeaways
Nifty is under pressure with key support at ₹24,800 in focus.
A breakdown below this level could drag the index to ₹24,550 or even lower.
Bulls must reclaim ₹25,250 to shift momentum in their favor.
RSI and MACD show weakness, but Stochastic hints a possible oversold bounce soon.
Volatility remains high; risk management is critical.
Trading Master Class With Experts🎓 Trading Master Class With Experts
Join a premium learning experience led by real market experts and institutional-level traders.
This is not just theory—it's real-world strategy, live insights, and powerful execution.
🔥 What You’ll Learn:
Advanced Price Action – Master structure, trends & breakouts
Institutional Trading Tactics – Learn how the big players move
Options & Derivatives – Trade with smart setups & defined risk
Strategy Building – From scalping to swing setups
Trader Psychology – Build discipline, mindset & consistency
Risk Management – Professional capital protection strategies
💡 Why Join?
✅ Learn from real experts
✅ Get access to institutional methods
✅ Trade with confidence, clarity & control
✅ Perfect for intraday, swing, and option traders
📌 Learn. Apply. Profit.
This is your step toward trading like a pro.

Master Institutional Trading🏛️ Master Institutional Trading
Unlock the secrets of how the smart money dominates the market
Learn to think, plan, and trade like top institutions and hedge funds.
What You’ll Master:
Advanced Market Structure – Breakouts, fakeouts & liquidity grabs
Smart Money Concepts – Accumulation & distribution like a pro
Order Flow & Volume Logic – Follow the real money
Entry & Exit Precision – Based on logic, not guesswork
Institutional Risk Management – Capital protection & scaling
Trader Psychology – Discipline, patience & strategy
No more random trades. No more emotional decisions.
This is structured, high-level trading built for serious traders.
📌 Master the mindset. Read the market. Trade like institutions.

Learn Advanced Institutional Trading🏛️ Learn Advanced Institutional Trading
Step into the world of professional-level trading and master how institutions control the markets.
This advanced level dives deep into:
Market Structure Mastery – Spot trends, breakouts & manipulation zones
Smart Money Tactics – Learn how big players accumulate & distribute silently
Volume & Liquidity Zones – Trade where institutions trade
Precision-Based Entries – No noise, just logic
Risk Management Systems – Protect capital like a pro
Avoid Retail Traps – Outsmart fakeouts, stop hunts & emotional trades
Whether you're trading options, futures, or intraday levels—this training gives you the edge to follow the real money and make consistent, calculated moves.
📌 Upgrade your strategy. Trade with purpose. Win like institutions.

Institutional Intraday option Trading🏛️ Institutional Intraday Option Trading
Trade like the big players — with speed, strategy, and smart money precision.
This is high-level intraday options trading the way institutions do it — not with guesswork, but with structure, volume, and calculated risk.
🔥 What You’ll Learn:
Smart Money Concepts – Recognize institutional footprints & price manipulation
Intraday Market Structure – Breakouts, fakeouts, traps & liquidity zones
High-Volume Option Levels – Trade where institutions act
Scalp-to-Swing Entries – Fast setups with defined risk
Tight Risk Management – Stop loss placement like a pro
Time & Premium Decay Tactics – Trade with Theta on your side
💼 Perfect For:
✅ Intraday Option Traders
✅ Scalpers & Index Traders (Nifty/BankNifty )
✅ Anyone ready to follow the real momentum
📌 Fast markets need smart strategies.
Learn to dominate intraday moves with institutional logic.

Advance Option Trading⚙️ Advance Option Trading
Advance Option Trading helps you level up your skills and trade like the pros!
It’s not just about buying Calls or Puts — it's about using smart, multi-leg strategies like:
🔹 Iron Condors
🔹 Butterflies
🔹 Credit Spreads
🔹 Calendar Spreads
These strategies let you profit from:
📈 Price movement
⏳ Time decay (Theta)
🌪️ Volatility changes (Vega)
🔍 What You'll Learn:
Greeks mastery – Delta , Theta , Gamma , Vega
Risk control – Trade with limited loss & defined risk
Trade adjustments – Fix or flip trades smartly
High-probability setups – Trade based on logic, not luck
💡 Perfect For:
✅ Experienced traders
✅ Options scalpers & income seekers
✅ Anyone ready to trade like institutions
🚀 Final Thought:
Trade smarter. Risk less. Profit more.
Advance Option Trading is your path to professional-level strategies with control, clarity, and consistency.

Learn Institutional Trading🏛️ Learn Institutional Trading
Step into the world of smart money and learn how the big players trade!
Institutional Trading isn’t about following indicators—it’s about understanding market structure, liquidity, and smart money moves.
🔍 What You’ll Learn:
Market Structure – Trends, ranges, and liquidity zones
Smart Money Concepts – Accumulation , distribution , and manipulation traps
Volume & Order Flow – See what the institutions see
Precision Entries – No guessing, just calculated moves
Risk Management – Trade like a pro, protect your capital
💡 Why It Matters:
Retail traders often get trapped 🚧 by institutional strategies. When you learn how institutions think and operate, you stop reacting and start predicting market behavior.
🚀 Final Thought:
Think like a pro. Trade like an institution. 🏛️ Win with structure.
Learn Institutional Trading and transform the way you see the market—forever

Option Trading💼 Option Trading 📉📈
Leverage. Flexibility. Strategic Advantage.
Option Trading is a powerful segment of the financial markets where traders and investors use derivative contracts—known as options—to speculate, hedge, or generate income. Unlike traditional stock trading, options give you the right (but not the obligation) to buy or sell an asset at a predetermined price, within a specific time frame.
It’s a strategic tool used by everyone from retail traders to hedge funds to gain exposure with limited risk and amplified potential.
🔍 Key Concepts:
✅ Call Option – Gives the right to buy an asset at a fixed price (strike)
✅ Put Option – Gives the right to sell an asset at a fixed price
✅ Premium – The price paid to buy the option contract
✅ Strike Price – The level at which the option can be exercised
✅ Expiry Date – The date on which the contract expires
✅ In-the-Money / Out-of-the-Money – Describes the moneyness of a position relative to current price
⚙️ Why Trade Options?
🔹 Leverage – Control larger positions with smaller capital
🔹 Flexibility – Bullish, bearish, neutral—there’s a strategy for every view
🔹 Defined Risk – Max risk = premium paid (in buying options)
🔹 Income Generation – Sell options (covered calls, credit spreads) for passive income
🔹 Hedging – Protect existing stock positions from volatility or loss
Option trading isn’t gambling—it’s a game of precision, risk management, and market insight. To succeed, you need to master:

Institutional Trading🏛️ Institutional Trading 📊
Trade Like the Smart Money
Institutional Trading refers to the high-volume, data-driven buying and selling of financial assets by large entities such as hedge funds, banks, mutual funds, insurance companies, pension funds, and proprietary trading firms. Unlike retail traders, institutional traders have access to advanced tools, deep liquidity, insider networks, and strategic research that give them a significant edge in the market.
These market participants don’t chase price—they move it. Their trades are structured, well-researched, and often hidden from the public eye through techniques like iceberg orders, dark pools, and algorithmic execution.
🔍 Key Features of Institutional Trading:
✅ Volume & Scale: Trades are executed in massive quantities, often spread across multiple venues to avoid detection.
✅ Market Influence: Institutions drive trends and liquidity. Their positioning can define entire market cycles.
✅ Strategic Execution: Every move is planned, including accumulation, distribution, and fakeouts to trap retail participants.
✅ Advanced Tools: They use sophisticated algorithms, AI-based models, high-frequency data, and institutional-grade charting.
✅ Focus on Risk-Reward: Strict risk management and portfolio balancing govern every trade decision.
🚀 Elevate Your Trading:
Learning Institutional Trading isn’t about copying big players—it’s about thinking like them, reading the market through their lens, and upgrading your strategy with smart money logic.
📈 Trade with structure. Trade with logic. Trade like an institution.

Ride The Big Moves🚀 Ride The Big Moves 📈
"Ride The Big Moves" is a powerful trading strategy and mindset that focuses on capturing large, high-probability market moves—rather than chasing small, uncertain fluctuations. It’s about positioning yourself with the trend, identifying institutional footprints, and holding trades with discipline and conviction for maximum reward.
This concept is rooted in smart money principles: letting your winners run, minimizing overtrading, and waiting for momentum-backed breakouts instead of guessing tops and bottoms. Whether you're trading options, stocks, or futures, the goal is simple—enter with precision, and ride the wave to its full potential.
👉 Perfect for:
✅ Swing Traders
✅ Intraday Momentum Traders
✅ Institutional-Style Traders
✅ Traders seeking fewer but higher-quality setups
🔍 Key Components:
Identifying high-volume breakout zones
Trend confirmation using price action
Entry triggers aligned with momentum shifts
Risk management for extended holds
Avoiding noise & false signals
Stop settling for crumbs — Ride The Big Moves and trade like the pros.

Options Trading vs Stock Trading👋 Introduction
If you've ever stepped into the world of the stock market, chances are you've heard about both stock trading and options trading. While they both exist under the umbrella of equity markets, they are fundamentally different beasts.
Imagine stock trading like buying a house — you own the asset. In contrast, options trading is like paying a small amount to rent the house with the option to buy it later — you get access, flexibility, and leverage, but also more complexity and risk.
In this guide, we’ll break it down in simple language, so you can understand:
What each involves
How they work
Risks vs rewards
Which one suits your trading style
📌 1. What Is Stock Trading?
Stock trading involves buying and selling shares of publicly listed companies on the stock exchange.
Example:
You buy 10 shares of TCS at ₹3,500, totaling ₹35,000. If the price rises to ₹3,800, and you sell, you make a ₹3,000 profit.
Key features:
Ownership: You become a partial owner of the company
No expiry: You can hold stocks forever
Dividends: You may earn income from dividends
Capital appreciation: Profit is made when price rises
Lower complexity: Ideal for beginners
📌 2. What Is Options Trading?
Options trading involves buying and selling contracts (not shares directly), that give you the right (but not the obligation) to buy or sell a stock at a specific price before a set date.
There are two main types of options:
Call Option: Betting that the price will go up
Put Option: Betting that the price will go down
Each contract typically covers 1 lot (e.g., 25 shares) of a stock or index.
Example:
You buy a Reliance 2800 Call Option for ₹50, and each lot = 250 shares. Your total cost = ₹12,500. If Reliance goes above ₹2800 and the premium rises to ₹100, you earn ₹12,500 profit.
Key features:
Leverage: Small capital, large exposure
Limited time: All options have expiry dates (weekly/monthly)
No ownership: You control a right, not the actual stock
Higher risk: Gains can be huge, losses can be total
Advanced strategy: Better for experienced traders
💥 3. Risk-Reward Trade-off
Stock Trading:
Lower volatility: Stock prices move gradually
Better for long-term wealth
Risk is limited to the price going down, but you still own the stock
Options Trading:
High leverage = high reward, high risk
Option premiums can decay rapidly due to time decay (theta)
Entire premium can become zero at expiry
Can be used for hedging or speculation
🧮 4. Margin & Capital Requirements
Stock Trading:
You pay the entire value of the stock upfront (unless using margin facilities)
Brokers may offer 5x margin for intraday, but that’s separate
Options Trading:
Option buyers pay only the premium
Option sellers (writers) require huge margin due to unlimited loss potential
Can start with as low as ₹500–₹5,000 per trade
🧠 5. Who Should Trade What?
You Are Prefer Stock Trading Prefer Options Trading
Beginner ✅ Yes ❌ No (unless trained)
Short-term trader ✅ Yes ✅ Yes
Investor ✅ Yes ❌ Not ideal
Hedger ❌ No ✅ Yes
Speculator ❌ Less ideal ✅ Perfect
🔁 8. Time Decay – The Invisible Killer in Options
One key concept in options is time decay (theta). As expiry nears, the premium loses value even if the stock doesn’t fall.
If you're long in options and your view is wrong or delayed, your option can become worthless.
Stock trading has no such concept — the price remains based on fundamentals and demand-supply.
🧮 6. Strategies Comparison
📈 Stock Trading:
Buy and Hold
Swing Trading
Intraday
🧩 Options Trading:
Buy Call / Buy Put (directional)
Sell Options (income)
Straddle / Strangle (neutral)
Iron Condor / Butterfly (advanced)
🧭 7. Regulatory Perspective
SEBI has increased margin requirements for option sellers due to high risk.
Recent data shows that:
90%+ retail option buyers lose money
85%+ option sellers make money, but require capital and strategy
Stock traders lose less on average, but make smaller % gains
💬 8. Psychological Factor
Stock trading is slower and requires patience
Options trading is fast, intense, and emotional — often leading to impulse trading
You must develop:
Strong discipline
Risk management
Understanding of Greeks (for options)
📚 9. Learning Curve
Area Difficulty (1 to 10)
Stock Trading 3–5
Options Trading 7–9
Options involve:
Understanding of strike prices, expiry, premium, Greeks (delta, theta, vega, gamma)
Quick decision-making under pressure
Multiple possibilities with the same price movement
Retail Trading vs Institutional Trading👋 Introduction
When we hear the term "trading," we often imagine someone sitting in front of a laptop buying and selling stocks — maybe even like you or me. But not all traders are the same.
There are two major types of traders in the stock market:
Retail Traders – Individual investors like students, salaried professionals, or small business owners.
Institutional Traders – Large organizations like mutual funds, hedge funds, pension funds, foreign investors, and banks.
Both operate in the same market but with very different tools, access, size, and influence.
Let’s break down the major differences between retail and institutional trading in a way that’s easy to understand and helps you think smarter as a trader.
📌 Who is a Retail Trader?
A retail trader is any individual who trades with personal money, not on behalf of others. These are regular people using platforms like Zerodha, Groww, Upstox, Angel One, etc.
Characteristics of Retail Traders:
Trade in small quantities
Use mobile apps or online platforms
Rely on technical indicators, news, social media, or trading courses
Face capital limitations (often under ₹1–5 lakhs or ₹10–20 lakhs for advanced ones)
Emotional decisions often play a bigger role
Impact on stock price is minimal due to small size
📌 Who is an Institutional Trader?
An institutional trader represents large financial institutions. They trade on behalf of clients, funds, or corporations with capital often running into crores or billions of rupees.
Examples:
FII (Foreign Institutional Investors)
DII (Domestic Institutional Investors)
Mutual Fund Houses (SBI MF, HDFC MF, ICICI Pru MF)
Insurance Companies (LIC)
Hedge Funds, Sovereign Funds, Investment Banks
Characteristics:
Trade in very large quantities (thousands to millions of shares)
Have dedicated research teams
Use high-frequency trading (HFT), algorithmic strategies, and block deals
Get priority access to stock allotments (like IPO anchor portions)
Influence stock prices due to their massive capital movements
🧠 How They Trade Differently
🔹 1. Entry Strategy:
Retail Trader: Buys based on chart breakout, news, or gut feeling.
Institutional Trader: Analyzes cash flow, management calls, macro factors, and even global risk.
🔹 2. Position Size:
Retail: Buys 10, 100, or 500 shares.
Institutional: May buy 1,00,000+ shares — sometimes slowly (accumulating) to avoid moving the price.
🔹 3. Holding Period:
Retail: Intraday, swing (few days), or positional.
Institutional: Depends — could be intraday (quant funds), quarterly, or multi-year holdings (pension funds).
🔹 4. Leverage:
Retail: Gets margin from broker, usually limited.
Institutional: Gets much larger and cheaper margin, due to strong balance sheets.
🔥 How Institutions Shape the Market
When a large FII like Vanguard or BlackRock enters or exits a stock, price reacts immediately. For example:
If FIIs buy ₹5000 crore worth of Infosys, it shows strength and attracts more buyers.
If Mutual Funds dump shares of Zomato in bulk, retail may panic and sell too.
So, institutions often act as market movers.
📈 Why Institutional Traders Perform Better (Generally)
They have teams of analysts, economists, risk managers
They avoid emotional mistakes — no panic buying or selling
They use models and simulations
They manage risk per trade very strictly
They get real-time global economic feeds
🙋 Why Do Retail Traders Lose More Often?
Studies show that over 85–90% of retail traders lose money, especially in F&O (Futures and Options). Why?
Lack of discipline – No stop-loss, random trading
Over-trading – Multiple trades a day without edge
Chasing news / tips – Not building conviction
No risk management – Betting all capital in one stock
Emotional trading – Fear & greed override logic
Meanwhile, institutions focus on:
Risk-to-reward
Long-term trends
Diversification
Hedging
Structured research
🛡️ Can Retail Traders Compete?
Yes — with proper knowledge and discipline.
Retail traders have some advantages too:
More flexibility: Can enter and exit faster due to small size
No committee pressure: Don’t answer to bosses or clients
Niche strategies: Can trade small-cap momentum where institutions avoid
Learning access: With internet, any trader can learn smartly today
🏁 Final Words: Use Institutional Moves to Your Advantage
Even if you’re a retail trader, you can follow institutional activity:
Track FII/DII flows daily (available on NSE)
Follow bulk/block deals
Use tools like Trendlyne, Screener, Moneycontrol to see where funds are buying/selling
Use this information to align your trades with "smart money", and avoid standing against institutional trends.
Technical Analysis vs Fundamental AnalysisWhat’s the Difference?
When people analyze stocks or any tradable asset, they usually follow one of two main approaches: Technical Analysis or Fundamental Analysis. Each one is like using a different lens to look at the same object. Both methods try to answer the same question:
“Should I buy, sell, or avoid this stock?”
But how they arrive at that answer is completely different.
1️⃣ What is Technical Analysis?
Technical Analysis is all about reading charts. It’s based on the belief that everything that affects a stock's price is already reflected in the stock price itself.
So instead of reading about a company's earnings or business strategy, technical analysts look at price movements, trading volumes, and patterns on charts to try to guess what might happen next.
How It Works:
Technical traders believe that history repeats itself.
Price moves in trends — up, down, or sideways.
Patterns like flags, triangles, and head-and-shoulders are seen as hints.
Indicators like RSI (Relative Strength Index), MACD (Moving Average Convergence Divergence), and moving averages are used to make decisions.
Key Concepts in Technical Analysis:
Candlestick Patterns: These show how the price moved in a given time — whether buyers or sellers were in control.
Support & Resistance: Support is a price level where a stock tends to stop falling. Resistance is where it often stops rising.
Volume: Helps you understand the strength behind a price movement.
Breakouts & Reversals: Important signals that indicate possible trend changes.
Real-Life Example:
Let’s say Stock A is trading at ₹500. It has bounced from this price three times before. That level becomes a support. If it suddenly jumps above ₹550 with high volume, that could be seen as a breakout, and a trader might enter a short-term position.
Pros of Technical Analysis:
Helpful for short-term trading like intraday or swing trades.
Fast decision-making based on visual cues.
Doesn’t require knowledge of a company’s financials.
Can be used across all asset classes (stocks, forex, commodities, crypto).
Cons of Technical Analysis:
It doesn’t look at what the company actually does.
False signals can mislead.
It works on probability — not certainty.
Can be overwhelming with too many indicators.
2️⃣ What is Fundamental Analysis?
Fundamental Analysis is like doing background research on a company before deciding whether to invest in it. Instead of looking at charts, you look at the company’s financial health, industry conditions, economic trends, and management quality.
The main goal is to find the true value (intrinsic value) of a stock and compare it with the current market price.
How It Works:
If the intrinsic value is more than the market price, the stock is considered undervalued and worth buying.
If the market price is more than the intrinsic value, it’s seen as overvalued, and better to avoid or sell.
Key Tools of Fundamental Analysis:
Financial Reports: Balance Sheet, Income Statement, Cash Flow Statement.
Ratios: PE (Price-to-Earnings), ROE (Return on Equity), Debt-to-Equity, EPS (Earnings Per Share).
Company's Business Model: What the company does, how it earns, and whether it's sustainable.
Management Quality: Experience and vision of the leadership.
Industry & Economy: Is the industry growing? Are economic conditions favorable?
Pros of Fundamental Analysis:
Ideal for long-term investment.
Helps understand the actual business you’re putting money into.
Less affected by short-term volatility.
Encourages rational decision-making.
Cons of Fundamental Analysis:
Takes time and effort to study.
May not tell you when exactly to buy or sell.
Requires understanding of finance, economics, and accounting.
Stock may stay undervalued for a long time despite good fundamentals.
✅ Which One Should You Choose?
It all depends on your personality, goals, and time commitment.
Go for Technical Analysis if:
You’re active and want to trade daily or weekly.
You like working with patterns and visuals.
You want to time your entry and exit precisely.
You are okay with taking risks for quick gains.
Go for Fundamental Analysis if:
You think long-term and want to build wealth.
You want to invest in solid companies.
You have patience and a stable mindset.
You prefer logic and numbers over charts.
⚖️ Can You Combine Both?
Yes, and that’s what many experienced market participants do.
This combined approach is called techno-fundamental analysis.
For example:
You use fundamentals to select a good company.
You use technicals to find the right entry point.
This way, you get the best of both worlds.
🧠 Final Thought
There’s no universal rule that says one method is always better. It’s all about what suits your style and objective.
If you’re building a portfolio for retirement or wealth over 10+ years, fundamental analysis is your friend.
If you want to trade actively and spot market opportunities daily or weekly, technical analysis is the way to go.
Over time, learning both will make you a more flexible and better-informed market participant.
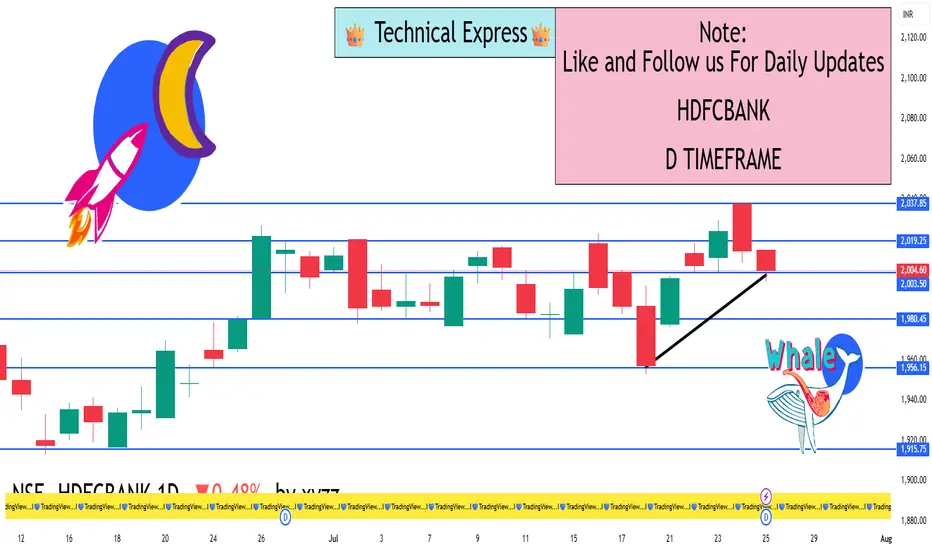
HDFCBANK 1D TimeframeClosing Price: ₹2,004.60
Opening Price: ₹2,018.80
Day’s High: ₹2,028.00
Day’s Low: ₹1,996.75
Net Change: –₹16.10 (–0.80%)
Trend: Mild Bearish
🔻 Support Levels
₹1,985 – Immediate support (20-day moving average)
₹1,950 – Short-term support (50-day moving average)
₹1,910 – Medium support (100-day moving average)
🔺 Resistance Levels
₹2,030 – Recent swing high and near-term resistance
₹2,050 – Breakout zone if momentum picks up
₹2,100 – Major resistance area
📈 Technical Indicators
RSI (Relative Strength Index): ~62
➤ In neutral to bullish territory, showing healthy momentum but close to overbought levels.
MACD (Moving Average Convergence Divergence):
➤ MACD line above Signal line – currently a bullish signal.
Volume:
➤ Normal trading volume; no heavy buying or panic selling.
➤ Indicates steady participation from both retail and institutional investors.
Candlestick Pattern:
➤ Small bearish candle after a strong bullish move earlier in the week.
➤ Indicates temporary profit booking or hesitation near resistance zone.
🧠 Market Sentiment
Overall sentiment remains positive for HDFC Bank due to:
Strong financials and balance sheet
Good loan growth reported in recent results
High investor confidence post bonus issue announcement
However, profit booking is likely near ₹2,030 as it is a psychological and technical resistance.
✅ Conclusion
Short-Term View: Mild pullback within an uptrend; no major weakness.
Medium-Term Trend: Still bullish as price remains above key moving averages.
Action to Watch:
A breakout above ₹2,030 may trigger a rally toward ₹2,050+.
A drop below ₹1,985 may invite short-term selling toward ₹1,950.
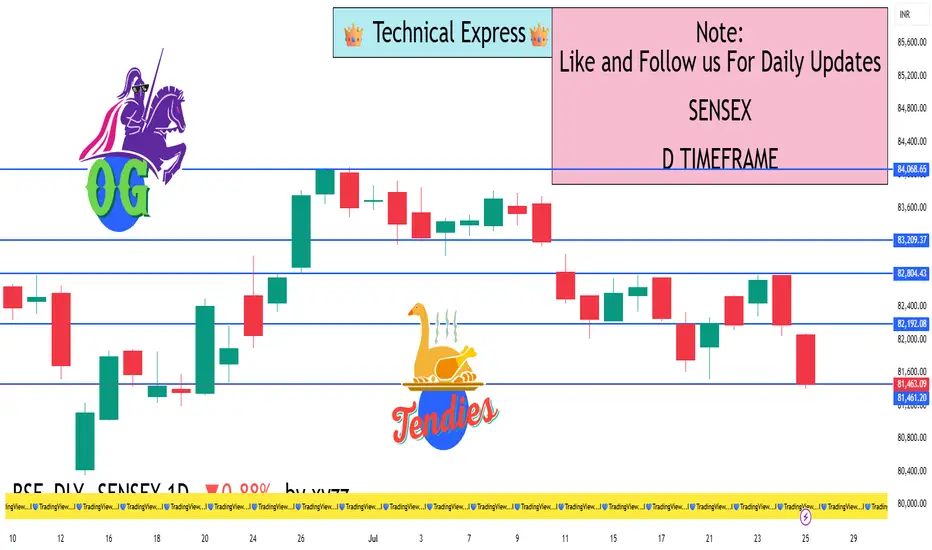
SENSEX 1D TimeframeClosing Value: 81,463.09
Net Change: −721.08 points (−0.88%)
Opening Level: 82,065.76
Day’s High: 82,069.51
Day’s Low: 81,397.69
Trend: Bearish
📊 Technical Analysis:
✅ Candle Type:
Large bearish candle with a close near the day’s low.
Indicates strong selling pressure throughout the session.
🔻 Support Levels:
81,400 – Immediate support (Friday’s low)
81,000 – Critical psychological and technical level
80,700 – Medium-term support zone
🔺 Resistance Levels:
82,070 – Intraday high and near-term resistance
82,300 – Minor resistance
82,500 – Strong resistance zone
📈 Indicator Summary:
RSI (Relative Strength Index): Likely below 50 – shows weakening buying strength
MACD: Bearish crossover – confirms ongoing downtrend
Volume: Higher than average – selling was broad-based and strong
🧠 Market Sentiment:
Bearish sentiment due to pressure in Auto, Banking, Energy, and IT sectors
Major stocks pulling down the index: Reliance, HDFC Bank, Infosys, Tech Mahindra, and Bajaj Finance
Investors showed caution amid FII selling, weak global signals, and earnings season pressure
✅ Conclusion:
Sensex is in a short-term downtrend
A breakdown below 81,000 could trigger a move toward 80,700 or lower
Bulls must reclaim 82,000–82,300 levels to regain positive momentum
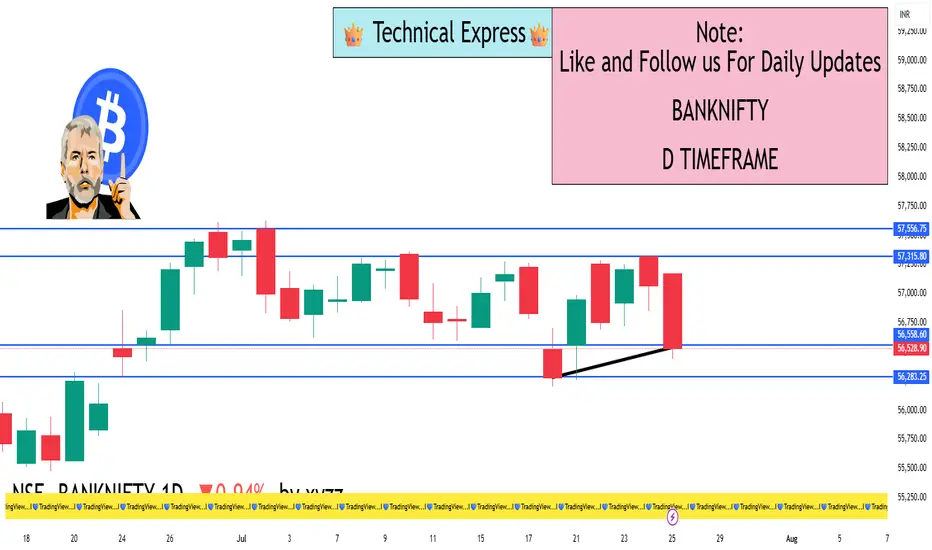
BANKNIFTY 1D TimeframeClosing Value: 56,528.90
Net Change: −537.15 points (−0.94%)
Opening Price: 57,034.40
Day’s High: 57,170.70
Day’s Low: 56,439.40
Trend: Bearish
📊 Technical Analysis
✅ Candle Pattern:
A strong bearish candle was formed.
Price opened higher but failed to sustain and closed near the day’s low — a sign of heavy intraday selling.
🔻 Support Zones:
56,400 – Immediate support (also the day's low)
56,000 – Psychological round number
55,750 – Medium-term support (from earlier price consolidation)
🔺 Resistance Zones:
56,800 – Near-term resistance
57,000 – Critical level; needs to be reclaimed for bullish reversal
57,300 – Stronger resistance zone based on recent highs
📈 Indicator Summary:
RSI (Relative Strength Index): Likely below 50, signaling weakening bullish momentum
MACD (Moving Average Convergence Divergence): Bearish crossover remains intact
Volume: Higher than average, suggesting institutional selling pressure
🧠 Market Sentiment:
Bearish sentiment prevailed across major banks including HDFC Bank, ICICI Bank, Axis Bank, Kotak Bank, and SBI
Pressure also visible in PSU banks (like PNB, Bank of Baroda, Canara Bank)
Overall market mood was risk-averse due to global uncertainty and potential interest rate impact
Foreign Institutional Investors (FIIs) continued their selling streak
Traders remain cautious ahead of upcoming quarterly bank results
✅ Conclusion:
Bank Nifty is currently in a short-term downtrend.
If 56,400 breaks decisively, it may head toward 56,000 and 55,750.
For bulls to regain strength, Bank Nifty must cross back above 57,000 with strong volume and momentum.
NIFTY 1D TimeframeClosing Price: 24,837.00
Net Change: −225.10 points (−0.90%)
Opening: 24,981.35
High: 25,008.90
Low: 24,770.85
Trend: Bearish
📊 Technical Overview
✅ Candle Type:
Bearish candle formed with a long body and small wicks.
Indicates strong selling pressure throughout the day.
🔻 Support Zones:
24,750 – Immediate support (tested on 25 July)
24,600 – Stronger support zone
24,400 – Medium-term support from early July
🔺 Resistance Zones:
24,900 – Immediate resistance
25,000 – Psychological resistance
25,150–25,300 – Strong resistance zone
📈 Indicators Summary:
RSI: Likely near 45 – showing weakening momentum
MACD: Bearish crossover continues – indicating downward trend
Volume: Slightly higher than average – confirms active selling
🧠 Market Sentiment:
Sentiment remains cautious and bearish.
Selling seen in major sectors like Auto, Energy, FMCG, and Banking.
Only Pharma showed relative strength.
Global cues and foreign investor selling weighed on market sentiment.
This marks the fourth straight weekly loss for the Nifty index.
✅ Conclusion:
Nifty is in a short-term downtrend, unable to sustain above 25,000.
If 24,750 is broken decisively, the next target could be 24,600 or lower.
Bulls must reclaim and hold above 25,000–25,150 to reverse the sentiment.
Advance Option Trading💼 Advance Option Trading
Advance Option Trading is the next level of trading options — where strategies go beyond simple buying of calls and puts. It involves using multi-leg strategies, understanding the Greeks, managing volatility, and hedging risk like professionals do.
This level of trading is used by experienced traders, institutions, and fund managers who want to take advantage of market complexity, pricing inefficiencies, and risk-reward opportunities in a calculated way.
🔧 What You Learn in Advanced Option Trading:
⚖️ Multi-leg strategies:
Spreads (Bull/Bear, Debit/Credit)
Iron Condors 🕊️, Butterflies 🦋, Straddles & Strangles 🔄
Calendar spreads 🗓️ and Diagonal spreads ➕
🧠 Options Greeks Mastery:
Delta (directional risk)
Theta (time decay)
Vega (volatility sensitivity)
Gamma & Rho (rate of change and interest rate risk)
📈 Volatility Trading:
Learn to trade Implied Volatility (IV) vs. Historical Volatility (HV)
Use volatility crush during earnings
Find edge in IV skew and term structure
🛡️ Hedging and Portfolio Management:
Use options to protect investments
Manage long-term positions with short-term trades
Build delta-neutral portfolios that profit in any direction
🧩 Why It’s Powerful:
🧮 Offers custom risk-reward setups
🔄 Allows you to profit in all market conditions (up, down, sideways)
🎯 Gives you precision control over market exposure
💰 Generates income through strategies like covered calls and credit spreads
🛡️ Helps hedge large portfolios or speculative positions safely
📌 In simple words:
Advanced Option Trading is like playing chess in the financial markets — it’s strategic, thoughtful, and designed to give you an edge over ordinary traders. You don’t just guess direction; you plan for every move the market can make.

Institutional Trading🏦 Institutional Trading
Institutional Trading refers to the buying and selling of large volumes of financial assets by big organizations such as banks 🏛️, hedge funds 📊, mutual funds 💼, pension funds 💰, and proprietary trading firms. These trades are typically high in value and are executed with sophisticated strategies, tools, and market access that retail traders don’t have.
Institutional traders use:
📈 Advanced algorithms
🧠 Data-driven analysis
💹 Block orders
🔍 Deep market research
🛡️ Strong risk management systems
Because of their size and influence, institutional trades can impact market prices, create liquidity zones, and often set the trend for retail traders to follow.
📌 In simple words:
Institutional Trading is how the "big players" move the markets — strategically, in high volume, and with professional precision.

Institutional Option Trading🏛️ Institutional Option Trading
Institutional Option Trading refers to how large financial institutions like hedge funds 📊, investment banks 🏦, insurance firms 🧾, and asset managers 💼 use options contracts strategically to hedge risks, generate income, or make large, leveraged bets with controlled risk.
These institutions trade options using:
🧠 Advanced analytics & algorithms
📉 Volatility-based strategies (like straddles, condors, and spreads)
📊 Risk-neutral positioning using Greeks (Delta, Vega, Theta, etc.)
🛡️ Portfolio hedging & macroeconomic plays
💼 Multi-million dollar contracts with custom structures
Their trading is not based on emotions, but on probabilities, risk-reward analysis, and long-term objectives.
📌 In simple words:
Institutional Option Trading is how big players use options smartly to manage risk and extract value — with precision, scale, and professional tools. 💼⚙️📈

Option Trading📘 Option Trading
Option Trading is a type of trading where you buy and sell contracts called options, instead of directly buying stocks. These contracts give you the right (but not the obligation) to buy or sell an asset at a set price within a specific time.
There are two main types:
🟢 Call Option – Right to buy the asset
🔴 Put Option – Right to sell the asset
Traders use options to:
📈 Make profits from price movements
🛡️ Hedge their investments
💰 Generate consistent income
⚖️ Manage risk with limited capital
Options are powerful because they offer leverage (small investment, big potential), but they also come with higher risks if not used carefully.
📌 In simple words:
Option Trading lets you bet on whether a stock will go up 📈 or down 📉, without owning it — and helps smart traders manage risk and reward like a pro.
