Option Buying vs. Option Selling🔍 What Are Options in Simple Terms?
Options are contracts that give you the right, but not the obligation, to buy or sell a stock (or index) at a specific price (called the strike price) before a certain date (the expiry).
There are two types of options:
Call Option: Gives you the right to buy.
Put Option: Gives you the right to sell.
Now, you can either buy these options or sell/write them. This is where Option Buying and Option Selling come into play.
🎯 Option Buying – The Dreamer’s Game
✅ What is Option Buying?
You pay a premium (small amount) and get the right to benefit from a big move in the market—either up or down—depending on the type of option you buy.
If you expect the market to go up, you buy a Call Option.
If you expect the market to go down, you buy a Put Option.
✅ Why Do People Love Option Buying?
Low Capital Requirement: You can buy an option for ₹100–₹2,000 and control a large value of the index/stock.
Unlimited Profit Potential: Your losses are limited to the premium, but profits can be huge if the market moves in your favor.
Simple to Execute: Easy for new traders to understand and start with.
❌ But Here’s the Harsh Reality...
Time Decay (Theta): Every day, your option loses value if the price doesn’t move. You’re fighting time.
Low Winning Ratio: Most options expire worthless. So unless you catch a big, fast move, you lose.
Emotionally Draining: You’ll be right on direction but still lose money due to premium decay or slippage.
🔄 Real-Life Example
Imagine buying a Bank Nifty 49,000 CE for ₹150. If Bank Nifty goes to 49,200, you might make good returns. But if it stays sideways or only moves near expiry, your ₹150 can become ₹10—even though your view was right.
Option Buyer’s Risk = 100% of Premium
Option Buyer’s Reward = Unlimited (theoretically)
🛡️ Option Selling – The Smart Money’s Edge
✅ What is Option Selling?
You sell/write options and receive the premium upfront. You win if the option loses value—which is what happens most of the time.
If you believe the market will not go above a certain level, you sell a Call Option.
If you believe the market will not fall below a certain level, you sell a Put Option.
Basically, you're betting on nothing extreme happening.
✅ Why Do Institutions Prefer Option Selling?
High Probability of Profit: Around 70–80% of options expire worthless. That’s why sellers profit more often.
Theta Decay Works in Your Favor: Time works for you, not against you.
Regular Income: You can create strategies to earn consistently—especially in rangebound markets.
❌ What Are the Risks?
Unlimited Loss Potential: If the market moves against you sharply, your losses can be massive.
Needs Big Capital: Option selling requires margin, usually ₹1.5 to ₹2 lakhs per lot.
High Discipline Required: One mistake (overleveraging or wrong strike selling) can blow up your account.
🔄 Real-Life Example
Suppose you sell Nifty 23,300 CE for ₹100 and Nifty closes at 23,100 on expiry. That ₹100 premium becomes zero, and you keep it fully. But if Nifty suddenly jumps to 23,500, your ₹100 premium may become ₹400 or ₹800, and you’ll be in deep trouble unless you manage your position.
Option Seller’s Risk = Unlimited (in theory)
Option Seller’s Reward = Limited to Premium
🧠 Which One Is Better?
It depends on your mindset, capital, and risk appetite.
👉 Option Buying is better if:
You are a small retail trader with ₹5K–₹20K capital.
You have a strong directional view (especially on event days).
You can afford to lose small amounts for big returns.
You don’t want to manage complex positions or margins.
👉 Option Selling is better if:
You have ₹1–₹2 lakh+ capital and a focus on consistent profits.
You can manage risk through hedging or spreads.
You prefer high accuracy and stable income over jackpot trades.
You follow rules and don’t panic with market moves.
🧠 Smart Approach: Combine Both
Professional traders don’t pick just one—they combine both.
💡 Examples:
Buy Call, Sell Far OTM Call = Bull Call Spread
Sell Both CE & PE at Key Levels = Strangle/Straddle
Buy Put, Sell Lower Put = Bear Put Spread
These reduce risk and improve probability while keeping reward potential intact.
🧘♂️ Final Advice (From Practical Traders)
Avoid random option buying. Don’t chase cheap options blindly.
Don’t sell naked options without risk control.
Use hedging or spreads to limit both loss and margin requirement.
Focus on discipline, not thrill.
Always respect position sizing, stop loss, and capital management.
Avoid trading during low volume or uncertain news zones.
📌 Conclusion
Option Buying is like buying a lottery ticket with logic. It’s risky, but the reward can be sweet. Option Selling is like being the insurance company—it’s slow, but steady and statistically in your favor.
Swingtrading
Option Chain Analysis + Open Interest (OI)🧠 Let’s First Understand: What is Option Chain?
An Option Chain is a table that shows available strike prices for a particular stock/index along with their Call and Put option data—like premium, volume, open interest, change in OI, etc.
✅ Where can you find it?
NSE Website (most reliable)
Trading Platforms like Zerodha, AngelOne, etc.
Apps like Sensibull, Opstra, etc.
The option chain is divided into two parts:
Left side – Call Options (CE)
Right side – Put Options (PE)
Each row shows the strike price and various data like:
LTP (Last Traded Price) – the premium.
Open Interest (OI) – total contracts outstanding.
Change in OI – new positions added or removed.
Volume – how many contracts traded today.
🔍 What is Open Interest (OI)?
OI = Open Interest = Open positions in the market.
It shows how many contracts are live at a particular strike. It’s like a pulse of the market—it tells us where the action is happening.
If OI is going up → Traders are adding positions
If OI is going down → Traders are closing positions
🔑 Why Is OI Important?
Because institutions and smart money create large positions—and OI helps us identify where they’re betting.
OI gives an idea of:
Support and Resistance zones
Strength of a trend
Where market might reverse
Where volatility might increase
📘 Understanding Support & Resistance Using Option Chain
Support and resistance levels can be seen through the OI data in the option chain.
✅ How to Identify Support?
Look at Put OI:
The strike price with highest Put OI is considered strong support.
Why? Because put writers (who are mostly smart money) don’t expect the price to fall below this level.
Example:
If 22,500 PE has the highest OI, it acts as a support level.
✅ How to Identify Resistance?
Look at Call OI:
The strike price with highest Call OI is considered strong resistance.
Why? Because call writers are betting price won’t go above this level.
Example:
If 23,200 CE has the highest OI, it acts as a resistance level.
🔁 Change in OI – Fresh Positions vs Exits
Don't just look at total OI—look at the change in OI today.
Increase in OI = Fresh positions are being added
Decrease in OI = Traders are squaring off positions
It helps confirm if the current market move is genuine or fake.
Example:
If Nifty is going up and Call OI at 23,000 is increasing, it means fresh selling → possible resistance.
But if Call OI is decreasing, it means sellers are exiting → breakout possible.
🧩 How Option Chain + OI Help in Intraday Trading
Find Support & Resistance Zones
Use highest OI levels to set your boundaries.
Avoid buying near strong resistance; avoid selling near strong support.
Use OI to Validate Breakouts
Watch how OI changes near key strike prices.
If resistance strike sees short covering (OI falling), breakout is real.
Trend Confirmation
Long buildup (Price ↑, OI ↑) = Uptrend
Short buildup (Price ↓, OI ↑) = Downtrend
Expiry Day Strategy
Focus on where OI is building rapidly.
Use max pain and max OI to sell straddles/strangles safely.
🧠 Advanced Concepts
🔸 Max Pain Theory
Max Pain is the strike price where the most option buyers lose money on expiry. It is the level where option sellers are most profitable. It usually acts like a magnet near expiry.
Example:
If Max Pain for Nifty is 23,000, market may stay near this level on expiry day.
🔸 PCR (Put Call Ratio)
PCR = Total Put OI / Total Call OI
PCR > 1: More Puts than Calls → Bullish sentiment
PCR < 1: More Calls than Puts → Bearish sentiment
PCR near 1 = Neutral/Rangebound market
Use it with caution—extremely high or low PCR may signal reversal zones.
🛠️ Tools to Use (Free)
NSE India Website – Best for raw data
Sensibull, Opstra, Quantsapp – Visual OI charts
TradingView – Combine charts + option levels
Telegram OI Bots – For quick OI updates
📌 Do's & Don'ts in Option Chain + OI Analysis
✅ Do:
Use OI + Price + Volume together
Watch OI shifts during the day (especially 9:30–10:30 AM and 2–3 PM)
Combine with support/resistance zones from charts
❌ Don’t:
Trade blindly based only on highest OI
Ignore rapid changes in OI—it could signal smart money exit
Confuse high OI with direction—it just means “interest,” not bias
🎯 Final Words
Option Chain + OI analysis isn’t just a tool—it’s your insight into the mind of the market. It tells you what others are doing, especially the big players who move the markets.
To master it, keep practicing:
Observe how OI builds around events (like RBI policy, earnings)
Watch price + OI behavior on breakout and breakdown days
Pair OI with basic technical analysis for solid confidence
Institutional Order Flow / Smart Money Concepts🚀 What is Institutional Order Flow?
Institutional Order Flow simply means tracking how big players are placing their buy and sell orders, and using that data to trade alongside them — not against them.
Big players can’t enter or exit in one go. If they do, they’ll move the market too much. So they:
Split their orders
Use liquidity zones
Create traps and fakeouts to fill their orders
Your job as a retail trader is to spot these footprints.
💡 Why is it Important?
Most retail traders:
Follow indicators
Chase breakouts
React late
Institutions:
Create liquidity traps
Use retail mistakes to enter their positions
Push price into zones that force emotional trading
By understanding Institutional Order Flow or Smart Money Concepts, you’ll stop being the one getting trapped—and start trading with the whales.
🔍 Key Concepts of Smart Money / Institutional Order Flow
Let’s now break down the core principles and tools.
1. Liquidity Zones
Institutions need liquidity — meaning many buyers or sellers to fill their orders.
They create fake breakouts, stop hunts, or news spikes to force retail traders to enter or exit — and then they do the opposite.
Example:
Price breaks above resistance — retail buys breakout
Institutions sell into that liquidity
Price reverses sharply = retail gets trapped
Your job: Identify where liquidity is sitting (above highs, below lows).
2. Breaker Blocks
A breaker block is an OB that failed, but now acts as the opposite side’s zone.
Example:
Price breaks bullish OB and comes back → now it acts as support.
Same with bearish OB → becomes resistance.
These show who is now in control — buyers or sellers.
3. Market Structure Shifts (MSS)
Smart money tracks structure, not indicators.
A Market Structure Shift happens when:
The trend breaks (HH → LL or LL → HH)
A new direction is confirmed
Institutions often wait for MSS before executing large orders.
Your job: Don’t jump in early. Wait for structure change to confirm smart money is switching sides.
4. Fair Value Gap (FVG)
An FVG is a price imbalance between candles — where price moved too fast, leaving a “gap” in liquidity.
FVG means:
A zone where institutions might revisit
Often gets “filled” later
Use for entries, targets, or rejections
How to spot: In a strong move, look between the first candle’s high and the third candle’s low (or vice versa) – this is your FVG.
5. Internal vs External Liquidity
Institutions use both:
External Liquidity = above highs / below lows (stop-loss areas of retail traders)
Internal Liquidity = inside the range (consolidation, breaker retests)
They:
Grab external liquidity
Fill internal orders
Then move price in their actual direction
This explains why breakouts fail — they were designed to!
🔁 Typical Smart Money Price Flow (Simple)
Accumulate (Sideways range)
Manipulate (Fake breakout or stop hunt)
Distribute (Strong move in real direction)
If you know this sequence, you can start trading the traps, not falling for them.
🛠 How to Trade Smart Money Concepts – Step by Step
Let’s bring it all together in a logical workflow:
✅ Step 1: Analyze Market Structure
On higher timeframes (1H, 4H, Daily), check:
Trend (bullish/bearish)
Breaks in structure (HH/LL change)
Are we in consolidation?
✅ Step 2: Identify Key Zones
Mark:
Order blocks (the last opposite candle before big move)
FVGs (imbalances)
Equal highs/lows (liquidity)
Swing points (for stop hunts)
✅ Step 3: Wait for Liquidity Grab
Watch for:
Wicks above highs or below lows
Aggressive moves into zones
Quick rejections
These are signs smart money is active.
✅ Step 4: Confirmation
MSS: Wait for structure to shift
Candle Confirmation: Engulfing, Break of structure candle
FVG Fill or OB tap
Only enter when confluence builds — not just one clue.
✅ Step 5: Risk-Managed Entry
Entry: After confirmation near OB or FVG
SL: Just outside OB/FVG
TP: Next liquidity zone or opposite OB
Always maintain minimum 1:2 RR.
😱 Common Mistakes Retail Traders Make
Trading breakouts blindly
Entering before confirmation (no MSS or candle clue)
Ignoring structure for indicators
Thinking OB is one candle – it's a zone
No patience – chasing price instead of letting price come to you
🎯 Why Institutions Need You to Lose
Yes — if you lose, they win.
Your stop-loss is their entry liquidity
Your breakout buy is their exit plan
Your emotional trading funds their smart entries
That's why they manipulate, trap, and fake moves to create liquidity.
But with knowledge of Institutional Order Flow — you flip the script.
💬 Final Thoughts
Institutional Order Flow / Smart Money Concepts aren’t a secret strategy — they’re simply a deeper understanding of how the market actually works.
Instead of being manipulated, you become the one who reads the manipulation.
It’s not about predicting the market — it’s about reacting to what smart money is doing, with patience, precision, and process.
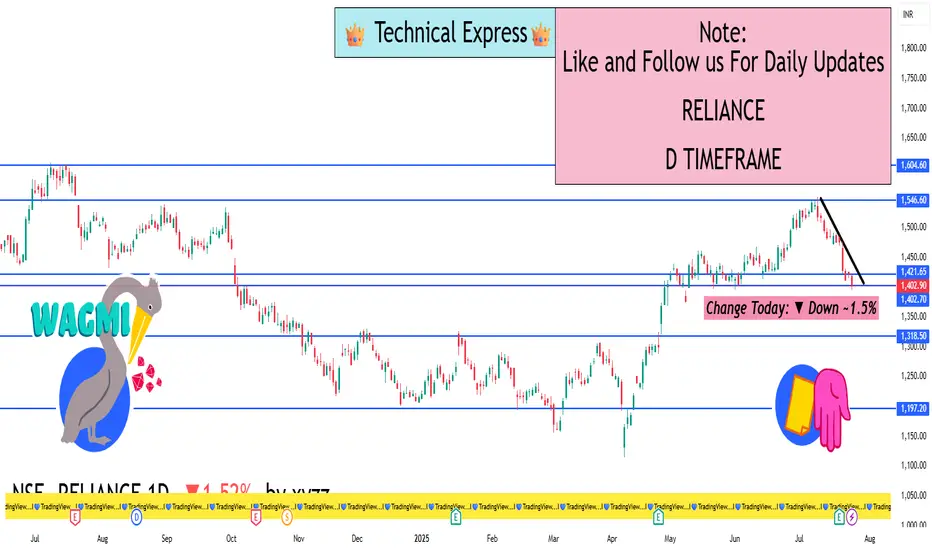
RELIANCE 1D TimeframeStock Data (1D Time Frame)
Current Market Price: ₹1,403 – ₹1,405 (Approx.)
Change Today: ▼ Down ~1.5%
Previous Close: ₹1,425
Day’s High: ₹1,427
Day’s Low: ₹1,398
52-Week High: ₹1,551
52-Week Low: ₹1,115
🧾 Intraday Performance Summary
Reliance opened mildly negative and continued a downward trend due to broader market weakness.
The stock touched an intraday low near ₹1,398 as profit-booking continued post its recent rally.
Despite reporting record profits in Q1, investor sentiment remains cautious due to underperformance in its Oil-to-Chemicals (O2C) and Retail segments.
🧠 Technical View (1-Day Time Frame)
Indicator Status
Trend Short-term Weak/Bearish
RSI (Relative Strength Index) Near 45 – slightly weak
Support Level ₹1,390 – ₹1,350 zone
Resistance Level ₹1,430 – ₹1,470
Volume Above average during dips
Stock is trading below key moving averages (20 and 50 DMA).
Break below ₹1,390 may lead to further correction toward ₹1,350.
Upside momentum may resume only if it breaks and sustains above ₹1,430–₹1,440 levels.
🧮 Fundamental Insights
💼 Q1 FY26 Highlights:
Net Profit: Around ₹30,783 crore, helped by a one-time gain from stake sales.
Core Business Growth: Adjusted profit growth (excluding exceptional items) is about 25% year-over-year.
Retail & O2C: Both divisions saw margin pressure despite revenue growth.
Jio Platforms: Continued to show strong performance through ARPU improvement and subscriber growth.
New Energy Segment: Investment in green energy, solar, and hydrogen tech continues to build momentum.
📈 Key Growth Drivers Ahead
Jio Expansion – Increased monetization from 5G and digital platforms.
Retail Scaling – Aggressive expansion through online + offline strategies.
Green Energy Push – Investments in solar panels, hydrogen energy, and battery storage to become significant in 2025–26.
Potential IPOs – Jio and Retail business listing possibilities can unlock value.
🛑 Risks to Watch
Pressure on global refining margins may continue to affect the O2C segment.
Delay in clean energy execution can lead to valuation stress.
Macro market correction or FII selling could drag heavyweights like Reliance.
🔮 Outlook
Short Term: Cautious-to-bearish unless ₹1,430 is reclaimed. ₹1,350 is a critical support.
Medium to Long Term: Remains fundamentally strong. New growth drivers (Jio, Retail, Energy) support a positive outlook beyond 3–6 months.
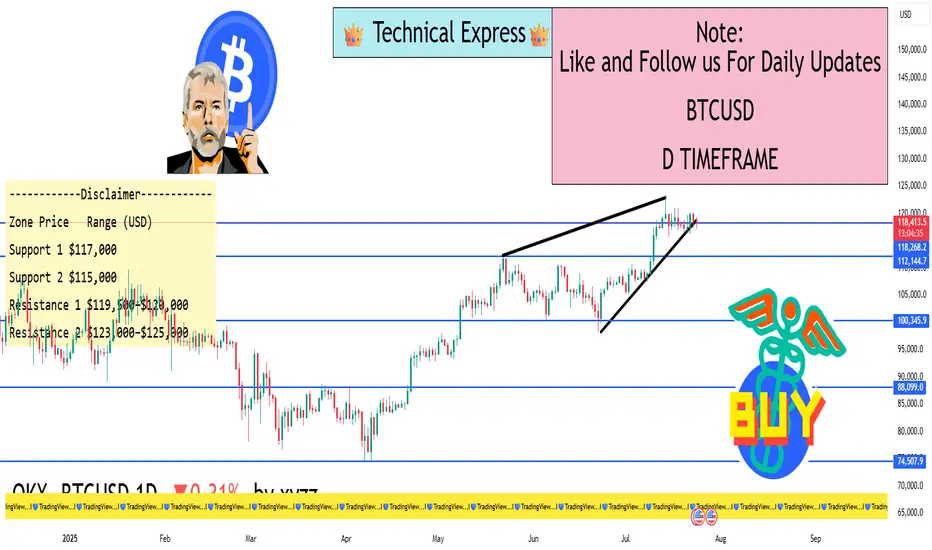
BTCUSD 1D Timeframe✅ Current Market Data
Current Price: ~$118,420 USD
Day’s High: ~$119,210
Day’s Low: ~$117,428
Previous Close: ~$118,004
Change Today: +$416 (around +0.35%)
📈 Price Behavior Today
Bitcoin is showing range-bound movement between $117K and $119K after a strong rally in the past few days.
The current price action suggests market indecision, with neither bulls nor bears taking clear control.
Momentum indicators are neutral, with RSI hovering around 52–55, indicating sideways consolidation.
🧠 Key Drivers Behind Price Action
Profit Booking: After recent rallies above $120K, traders are taking profits, keeping the price in check.
Strong Institutional Demand: ETFs and institutional buying continue to offer long-term support to Bitcoin.
Favorable Crypto Regulations: Recent developments in U.S. crypto policies are boosting confidence in Bitcoin as a store of value.
On-Chain Strength: Network health (hash rate, wallet activity, HODL behavior) remains strong, signaling long-term bullishness.
🔍 Technical Levels to Watch
Zone Price Range (USD)
Support 1 $117,000
Support 2 $115,000
Resistance 1 $119,500–$120,000
Resistance 2 $123,000–$125,000
A close above $120K could initiate a bullish breakout targeting $125K–$130K.
A fall below $117K may invite a deeper pullback toward $115K or even $111K in the short term.
🔄 Market Sentiment
Neutral-to-Bullish in the short term.
Strong Bullish in the long-term due to adoption, policy support, and demand.
Investors are cautiously optimistic, awaiting stronger volume and breakout confirmation.
🎯 Outlook Ahead
Short-Term View: Consolidation between $117K–$120K likely to continue unless a strong volume breakout occurs.
Medium-Term View: A confirmed move above $120K may push BTC toward new highs of $130K–$138K.
Risk Zone: If Bitcoin fails to hold $115K, it could enter a corrective phase down to $111K.
✅ Summary
Bitcoin is currently in a sideways consolidation phase, with strong support around $117K and resistance just below $120K. The broader outlook remains positive, but the market is waiting for a fresh trigger—either a breakout above $120K or a breakdown below $115K—for the next decisive move.
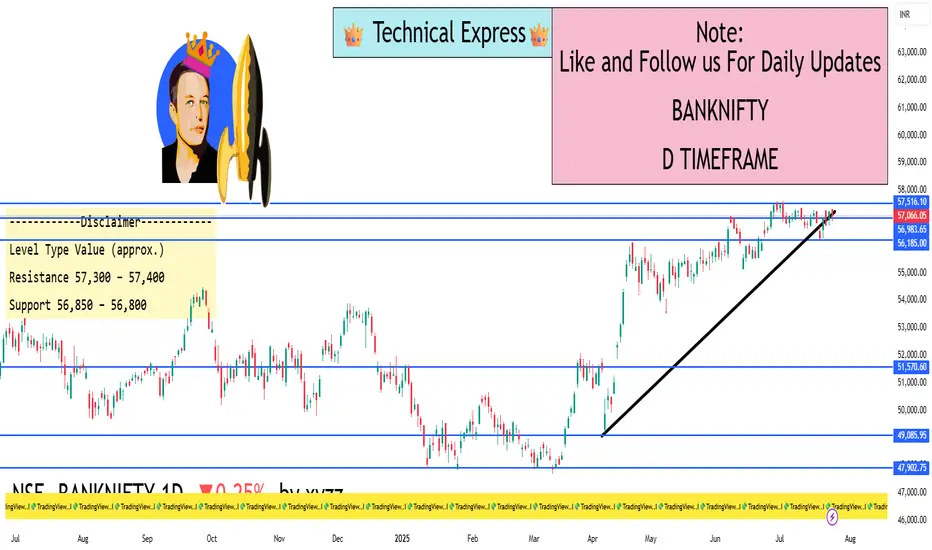
BANKNIFTY 1D Timeframe Key Data (as of early afternoon):
Current Price: ~57,080
Opening Price: 57,316
Day’s High: 57,316
Day’s Low: 56,851
Previous Close: 57,210
Net Change: –128 points (around –0.22%)
Intraday Price Action Summary
Bearish Start: Opened near the high and immediately faced selling pressure, especially in major private banks.
Dip to Support: Price dropped to 56,851, testing key intraday support.
Mild Recovery Attempt: Found some buying interest near the support but still trading below the day’s open.
📊 Technical Levels – 1D View
Level Type Value (Approximate)
Resistance 1 57,300
Resistance 2 57,600
Support 1 56,850
Support 2 56,500
Trend Bias Neutral to Bearish
RSI Level (Est.) 48–50 (sideways zone)
A break above 57,300 could resume bullish momentum.
A fall below 56,800 may extend the decline toward 56,500.
Why Bank Nifty Is Weak Today
Profit Booking: After recent gains, traders are squaring off long positions.
IT Sector Drag: Broader market weakness (led by IT) has spilled over into banking.
Global Cues: No strong global signals to support risk-on sentiment.
Mixed Bank Performance: While PSU banks like Canara Bank and PNB are showing strength, private banks such as Axis, ICICI, and Kotak are under pressure.
Intraday Trading Strategy
If you’re Bullish:
Look for a breakout above 57,300 for confirmation.
Targets could be 57,600 and 58,000 with a stop below 56,850.
If you’re Bearish:
Wait for a break below 56,800.
Downside targets may be 56,500 and 56,300.
Sideways Play: If the index continues to hold between 56,850–57,300, focus on range-bound scalping or wait for a breakout.
Conclusion
Bank Nifty is trading in a consolidation-to-weak zone today. The index is at a technical crossroads—holding above 56,850 keeps hopes for a bounce alive, while a fall below it could invite fresh selling. Eyes should be on private sector banks and broader market sentiment for the next directional cue.
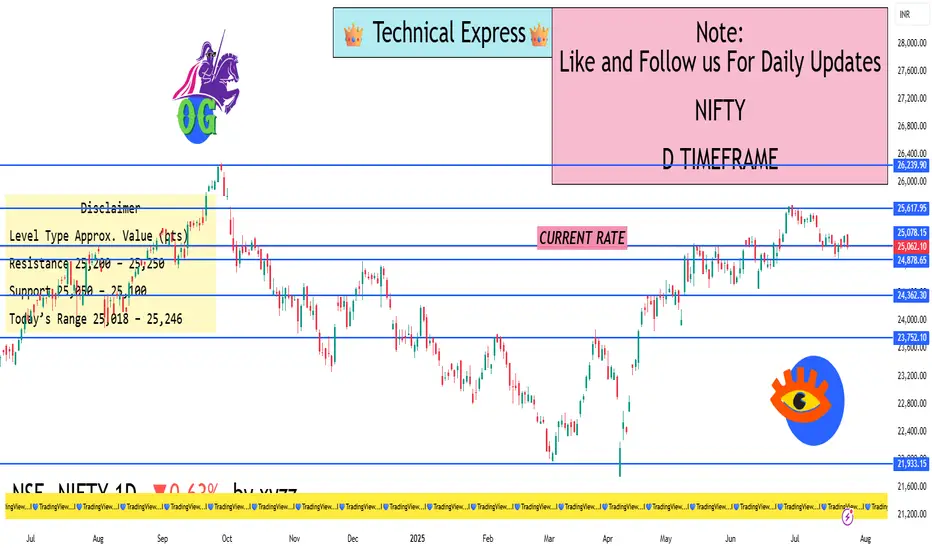
NIFTY 1D Timeframe📌 Current Data (as of early afternoon):
Current Price: Around 25,060
Opening Price: Approx. 25,200
Day’s High: ~25,246
Day’s Low: ~25,018
Previous Close: 25,216
Net Change: Down by ~155 points (–0.62%)
🔍 Intraday Price Action Analysis
Opening Weakness: Nifty opened lower than yesterday’s close due to weak global cues and selling in major sectors.
Bearish Pressure: Sellers dominated early in the day, dragging the index below 25,100.
Support Level Tested: Nifty hovered near 25,050, which acted as a short-term support.
Limited Bounce: Despite attempts to recover, resistance near 25,200–25,250 is capping upside movement.
📊 Technical Summary – 1D Timeframe
Type Range / Value
Support Levels 25,050 / 25,000
Resistance Levels 25,200 / 25,250
Trend Bias Slightly Bearish
Momentum Weak, with mild recovery attempts
Volatility Moderate
If Nifty holds above 25,050, it could try to reclaim 25,200–25,250.
A break below 25,018–25,000 may trigger further downside toward 24,950.
🧠 Why Nifty Is Down Today
IT Sector Weakness: Poor performance in tech stocks after recent earnings reports is dragging the index.
Banking Stocks Pressure: Major private and PSU banks are showing weakness due to profit booking.
Profit Booking: Traders are cashing out after last week's rally near all-time highs.
Global Market Impact: Uncertainty in international markets and trade concerns are weighing on sentiment.
🎯 What Traders Should Watch Next
Key Intraday Level: 25,050 — If Nifty stays above this level, short-term stability is possible.
Breakout Point: 25,250 — A close above this may indicate fresh bullish momentum.
Breakdown Point: Below 25,000 — Could lead to deeper correction toward 24,950–24,900.
Volatility Spike?: Stay alert around closing hours—FII/DII data and global market opening will affect the closing trend.
✅ Conclusion
Nifty 50 is under pressure today due to sectoral weakness and lack of strong domestic triggers. The index is currently range-bound between 25,000–25,250. Traders should monitor these levels closely for the next directional move.
SENSEX 1D Timeframe✅ Key Index Data:
Current Level: ~82,200 (as of early afternoon)
Opening: Around 82,780
Day’s High: 82,784
Day’s Low: 82,047
Previous Close: 82,726
Intraday Change: Down ~520 points (–0.63%)
🔍 Market Behavior (1-Day Time Frame)
Opening Session: The Sensex opened flat but slightly negative, quickly slipping below 82,600 as traders booked profits from recent highs.
Mid-Morning Session: The index continued to slide, breaching key support levels near 82,200–82,100.
Support Zone Tested: Sensex touched a low of around 82,047 before bouncing slightly.
Volatility: The index remained volatile due to global weakness and profit-booking in large-cap stocks.
🧠 Technical Insight (1-Day Chart Perspective)
Level Type Range (approx.)
Resistance 82,700 – 82,800
Support 82,000 – 82,050
Trend Bias Weak / Bearish
RSI (1D est.) Around 45–50 (neutral-to-weak zone)
Market Mood Cautious to bearish
📉 What’s Causing the Decline Today?
Weak IT and Banking Stocks: Both sectors are under pressure due to poor Q1 guidance and weak global cues.
Profit Booking: Investors are trimming positions after recent highs, leading to broad-based selling.
Global Uncertainty: Mixed international signals and concerns over trade policies are affecting sentiment.
Lack of Strong Domestic Triggers: No major positive domestic news to support buying.
🎯 What to Watch Next
Short-Term Trend: Watch if Sensex can hold above 82,000. If broken, more downside toward 81,800–81,500 is possible.
Upside Resistance: If recovery comes, resistance will be strong near 82,700–82,800.
Sector Focus: Banks, IT, and auto are likely to drive further movement.

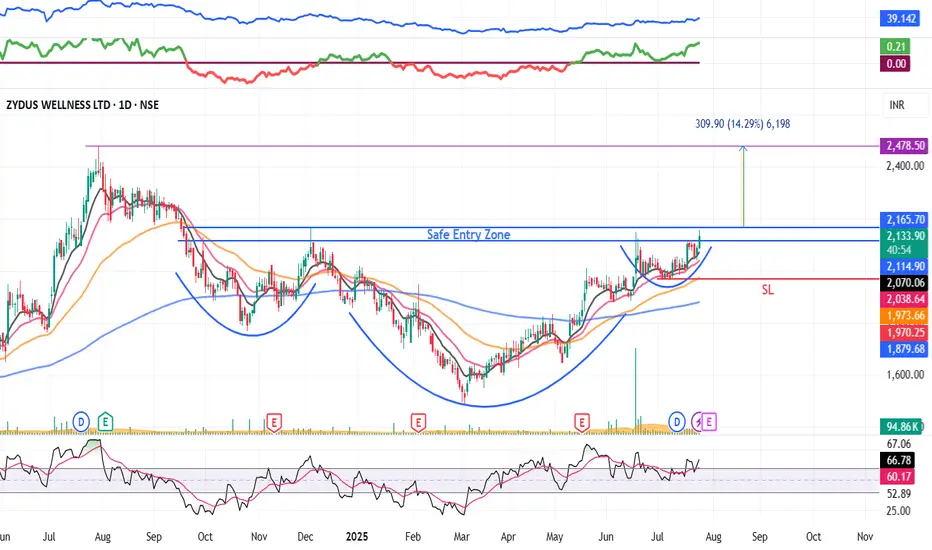
ZYDUSWELL : Inverse Head & Shoulder chart pattern#ZYDUSWELL #patterntrading #chartpattern #breakouttrading #inverseheadandshoulder #trendingstock
ZYDUSWELL : Swing Trade
>> Breakout candidate
>> Inverse Head & shoulder pattern
>> Trending stock
>> Good Strength & Volume
Swing Traders can lock profit at 10% and keep trailing
Pls comment, Boost & follow for more such Analysis
Disc : Charts shared are for Learning purpose and not a Trade recommendation. Consult a SEBI Registered advisor before taking position in it
Learn Institutional Trading📌 What is Institutional Trading?
Institutional trading refers to trading done by large financial organizations like:
Hedge Funds
Mutual Funds
Foreign Institutional Investors (FIIs)
Domestic Institutional Investors (DIIs)
Insurance Companies
Proprietary Trading Firms (Prop Desks)
Investment Banks
🧭 Why Should You Learn Institutional Trading?
Most retail traders:
Enter trades based on emotions or random indicators
Chase price or react late
Trade without understanding who controls the market
But institutions:
Trade with logic, precision, patience, and volume
Follow clear rules based on liquidity, risk, and timing
Use data-driven strategies and structure-based entries
Learning institutional trading means:
✅ You no longer follow retail traps
✅ You align your trade with the market’s real direction
✅ You understand where and why price truly moves
🧱 Key Concepts to Learn in Institutional Trading
1. Market Structure (MS)
Institutional traders analyze price based on structure, not indicators.
They study:
Higher Highs / Higher Lows (HH/HL)
Lower Highs / Lower Lows (LH/LL)
Break of Structure (BOS)
Change of Character (CHOCH)
💡 Pro Tip: Price never moves randomly — it follows structure. Learning how price breaks previous structure shows when the trend is shifting.
2. Liquidity & Smart Money Concepts
Institutions need liquidity to place big orders. So, they look for:
Retail stop-loss zones
Breakout traders’ entries
Obvious support/resistance
Then, they:
Create fake breakouts to grab liquidity
Enter in the opposite direction
Leave behind “footprints” like Order Blocks or FVGs
📌 Important Concepts:
Liquidity Pools
Inducement Zones
Order Blocks (last candle before the move)
Fair Value Gaps (FVG)
Mitigation Zones
📊 Institutions don’t chase price — they manipulate it. Learn to trade where they are entering, not where retailers are exiting.
3. Volume Analysis & Order Flow
Institutions trade with massive capital, so their footprints show up in:
Volume spikes
Imbalance between buyers/sellers
Absorption (when large orders block the market)
Rejections at key zones
🔧 Tools used:
Volume Profile
Delta Volume / Footprint Charts
VWAP (Volume Weighted Average Price)
4. Options Data & Open Interest (OI)
Institutions use option chains to trap or hedge retail participants. They track:
Open Interest Build-up (Call or Put side)
Max Pain Level (where most options lose value)
Put/Call Ratio (PCR)
Option Writers’ Zone (where institutions want expiry)
💡 Example: If 80% OI is built on 22,000CE and price is near it, chances are high that institutions will protect that zone and keep price below it.
5. Institutional Tools & Analysis
Institutions use:
Multi-Timeframe Analysis (MTA)
News + Event Flow
Economic data + earnings
Position sizing based on volatility
Algo-driven execution
Retail traders often focus only on technical indicators — institutions use a combination of fundamentals, sentiment, macroeconomics, and flow.
🧠 Skills Needed to Trade Like Institutions
Chart Reading Without Indicators
Master price action
Understand structure, CHOCH, BOS
Supply and Demand Zone Identification
Mark strong OBs (Order Blocks)
Confirm with imbalance or FVG
Liquidity Mapping
Where will retail place SL?
What’s the inducement?
Volume + OI Reading
Use OI charts to avoid traps
Match price with volume for confirmations
Emotional Discipline
Trade with confidence
Trust your setup — not noise or tips
Risk Management
Fixed % per trade (0.5% to 1%)
SL below valid structure
📈 Example of an Institutional Setup (Bank Nifty)
Structure: Market is in a strong uptrend (HH-HL forming)
Liquidity: Price dips below previous swing low — stop-hunt likely
Order Block: 15-minute bullish OB forms with FVG
Volume: Spike seen + high OI on 49,500 PE
Entry: Bullish candle close in OB
SL: Just below OB
Target: Next liquidity zone or supply area
🔁 RR Ratio: 1:3 or better
🛠️ Tools You Can Use to Learn Institutional Trading
TradingView – Charting, structure, OBs
Chartink / Trendlyne – Option OI analysis
Sensibull / Obstra / Quantsapp – Option strategy + data
Volume Profile – Spot accumulation/distribution
ForexFactory / Investing.com – Economic calendar
Smart Money YouTube / Discord / Telegram Groups – Practice setups
🧩 Step-by-Step Plan to Learn Institutional Trading
Foundation: Learn market structure + price action
Deep Dive: Understand liquidity & smart money concepts
Tools Mastery: Volume, VWAP, OI, Option Chain
Live Practice: Backtest institutional setups
Risk System: Use proper SL, position sizing, and journaling
Mindset: Stay patient and emotion-free
Repeat: Improve setup confidence & refine edge
🚀 Final Thoughts: Trade Like an Institution, Not a Retailer
If you trade based on what’s obvious — you’re likely wrong.
If you trade based on what’s behind the move — you trade like the pros.
Institutional trading is not about complexity.
It’s about thinking ahead, managing risk, and waiting for real opportunities — not noise.

Technical Class🎯 What is a “Technical Class”?
A Technical Class is a structured learning session or course designed to teach technical analysis – the skill of forecasting price movement in financial markets based on charts, price patterns, indicators, volume, and historical data.
It’s one of the most essential skillsets for traders and investors, especially those involved in stock trading, intraday trading, swing trading, options, forex, or crypto.
📘 Purpose of a Technical Class
The main goal of a technical class is to train participants to:
Read and analyze price charts confidently
Use indicators and tools to generate buy/sell signals
Recognize institutional footprints and volume patterns
Make independent, logic-based trading decisions
Avoid emotional or speculative trades
🧱 What Topics Are Covered in a Technical Class?
✅ 1. Chart Reading Basics
Candlestick types (Doji, Hammer, Engulfing, Marubozu)
Price vs. Volume relationship
Support & Resistance levels
Timeframes: Intraday (5m/15m), Positional (1D/1W)
✅ 2. Price Action Trading
Trend structure: HH-HL / LH-LL sequences
Breakouts & Fakeouts
Supply-Demand zones
Liquidity traps
✅ 3. Technical Indicators
Trend Indicators: Moving Averages (SMA/EMA), MACD
Momentum Indicators: RSI, Stochastic, CCI
Volume Indicators: VWAP, OBV, Volume Profile
Volatility Indicators: Bollinger Bands, ATR
✅ 4. Chart Patterns
Continuation Patterns: Flags, Pennants, Triangles
Reversal Patterns: Head & Shoulders, Double Top/Bottom, Wedges
Range Patterns: Rectangles, Channels
✅ 5. Support & Resistance Mastery
Dynamic (Moving averages, trendlines)
Static (Horizontal S/R, Round numbers)
Institutional S/R zones with Volume & OI
✅ 6. Trend Analysis
Identifying Bullish, Bearish, and Sideways markets
Role of Volume in confirming trends
Using Dow Theory and Market Structure
✅ 7. Advanced Concepts
Divergence (Price vs. RSI/MACD)
Multi-Timeframe Analysis (MTA)
Fibonacci Retracement & Extensions
Chart psychology (why price behaves irrationally)
🧠 Skills You Gain from a Technical Class
How to time entries and exits based on confirmation
How to avoid false breakouts
When to use indicators and when to trust price action
How to combine volume + price for high-probability setups
How to align with smart money and institutional footprints
🎓 Who Should Attend a Technical Class?
✅ New traders wanting a strong foundation
✅ Intraday and swing traders aiming for consistency
✅ Investors looking to time entry/exit better
✅ Option traders who want to read chart behavior
✅ Crypto/forex traders who rely on pure price movement
📈 Real-World Applications
Identify trend reversals before they happen
Spot breakouts with volume confirmation
Align trades with institutional positioning
Reduce overtrading and increase accuracy
Make data-backed decisions, not emotional guesses
⚠️ Common Mistakes Covered in a Technical Class
❌ Overuse of indicators (indicator overload)
❌ Trading without stop-loss
❌ Misreading breakouts and breakdowns
❌ Ignoring volume and confirmation
❌ Lack of patience or plan in trade execution
🔚 Final Thoughts
A Technical Class is more than just learning chart patterns — it’s about understanding how the market thinks, how price reacts, and how you can trade in sync with logic, not emotion.
Whether you're into stocks, futures, options, or crypto — a strong technical foundation increases your edge, reduces losses, and boosts confidence.

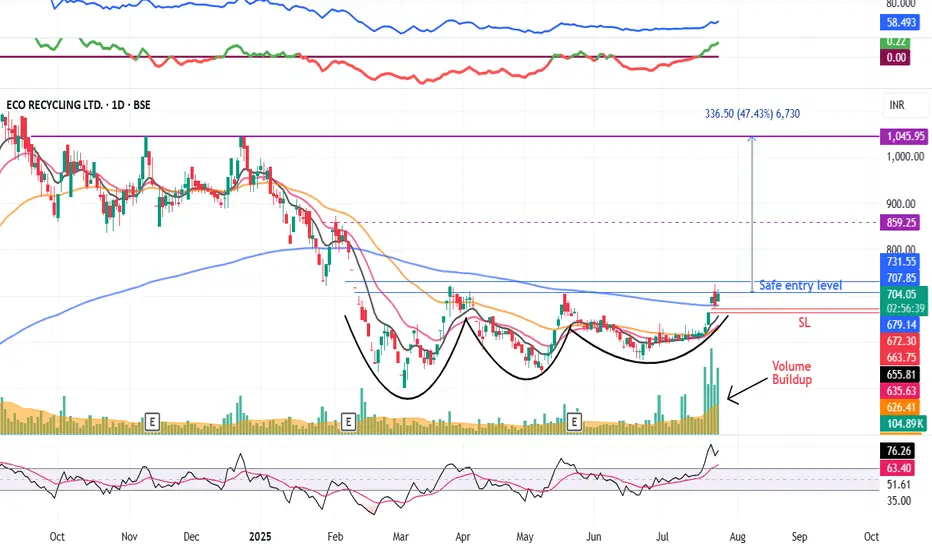
ECORECO - Swing Pick (1-3 Months)#ECORECO #vcppattern #basingpattern #swingtrade #patterntrading
ECORECO : Swing Trading
>> Good Base formation
>> VCP Pattern visible
>> Breakout candidate
>> Good Strength & Volume Buildup
>> Low Risk High Reward Trade
Swing Traders can lock profit at 10% and keep trailing.
Pls comment, Boost and follow us for more such Analysis
Disc : Charts shared are for Learning purpose and not a Trade recommendation. Consult ur financial advisor or a SEBI Registered Advisor before taking position in it.
SWIGGY : Next Multi-bagger ??NSE:SWIGGY
🚀 SWIGGY LTD – Combined Technical + Fundamental Analysis
As of: 24 July 2025 | CMP: ₹420.50 |
📈 TECHNICAL ANALYSIS
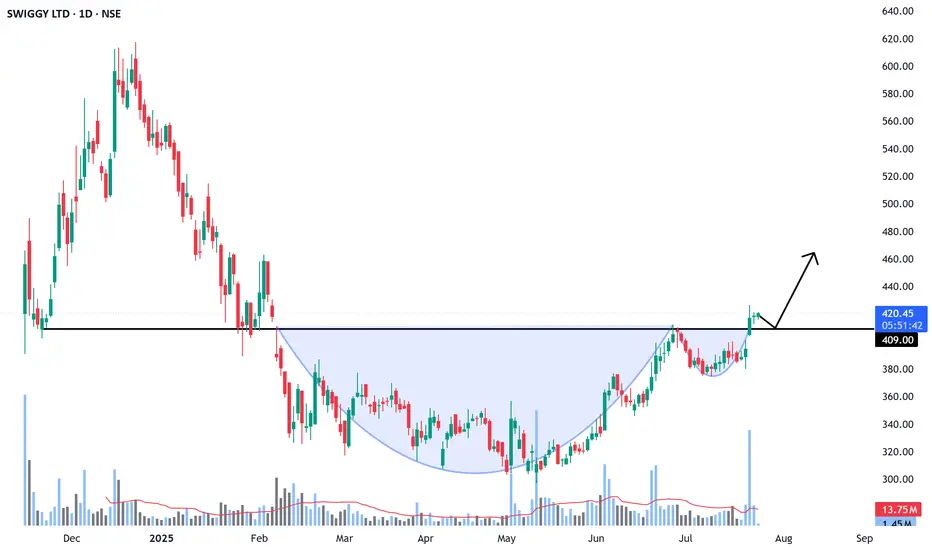
🔷 Pattern: Cup and Handle Breakout
Cup & Handle pattern completed over 5 months (Feb–July 2025)
Breakout Level: ₹409 (marked horizontal resistance)
CMP: ₹420.50 — breakout confirmed with strong volume
Cup Depth: ₹409 – ₹285 = ₹124
🔍 Indicators & Price Action:
Price vs 50 EMA ✅ Above (bullish short-term trend)
Price vs 200 EMA ✅ Above (bullish long-term trend)
Volume ✅ Breakout confirmed with surge
RSI ~63 (strong but not overbought)
🔧 Key Levels:
Support Resistance Swing Target
₹409 (Breakout retest) ₹445 / ₹480 ₹533 (measured move)
Technical Verdict:
Bullish breakout from a long base. With volume confirmation and improving fundamentals, Swiggy is poised for a multi-week rally.
=======================================
📊 FUNDAMENTAL ANALYSIS
📈 1. Revenue Growth
Swiggy has shown consistent and impressive topline expansion over the past 3 years:
Financial Year Revenue (₹ Cr) YoY Growth
FY22 ₹5,705 –
FY23 ₹8,265 +45%
FY24 ₹11,115 +34%
FY25 (Est.) ₹14,500 +30% est.
Growth Drivers:
🚀 Instamart (Grocery) – fastest-growing vertical
🍽️ Food Delivery – steady in Tier I, expanding in Tier II/III
📍 Strong presence in metros, improving reach in smaller cities
💰 2. Profit Trajectory
Swiggy was known for heavy cash burn pre-IPO, but is now nearing profitability:
Financial Year Net Profit/Loss (₹ Cr) EBITDA (₹ Cr)
FY23 -₹4,179 -₹3,363
FY24 -₹1,482 -₹1,115
FY25 (Est.) +₹75 (Profit) +₹350
📉 Losses reduced by over 60% in 12 months
🔁 EBITDA-positive since Q4 FY25 — a major turning point
🛠️ Cost control, reduced discounting, and Instamart’s scale driving margin growth
🌱 3. Future Growth Prospects
Swiggy is now strategically positioned to capture multiple long-term themes:
Segment Outlook Comments
Instamart 🌟 High Growth 60%+ YoY growth, core revenue driver by FY26
Food Delivery 🔁 Steady to Moderate Strong in metros; Tier II/III scaling slowly
Dineout + Genie 🧊 Low Growth Not major contributors, but strengthen ecosystem
New Revenue 🧠 Ads, cloud kitchens High-margin potential in FY26/FY27
🧾 IPO proceeds deployed into logistics & tech infra (no major debt)
📈 Possible MSCI/Nifty Next 50 inclusion in FY26
🔓 Optionality: Entry into fintech/payments, loyalty programs, and dark kitchens
🔚 COMBINED VIEW – TECHNICAL + FUNDAMENTAL
Technical Pattern ✅ Cup & Handle breakout at ₹409
Revenue Trend ✅ Strong CAGR ~36%
Profit Outlook ✅ Profitability by FY25 end
Future Potential ✅ High – Instamart + Ads + Tier-II expansion
Risk ⚠️ Valuation premium + ONDC threat remains
⚠️ Disclaimer:
This analysis is for educational and informational purposes only.
We are not SEBI-registered analysts or advisors.
This is our personal view based on available data and market trends.
Please consult your SEBI-registered investment advisor before making any investment or trading decisions.
You are solely responsible for any financial decisions you make based on this content.
========================
Trade Secrets By Pratik
========================
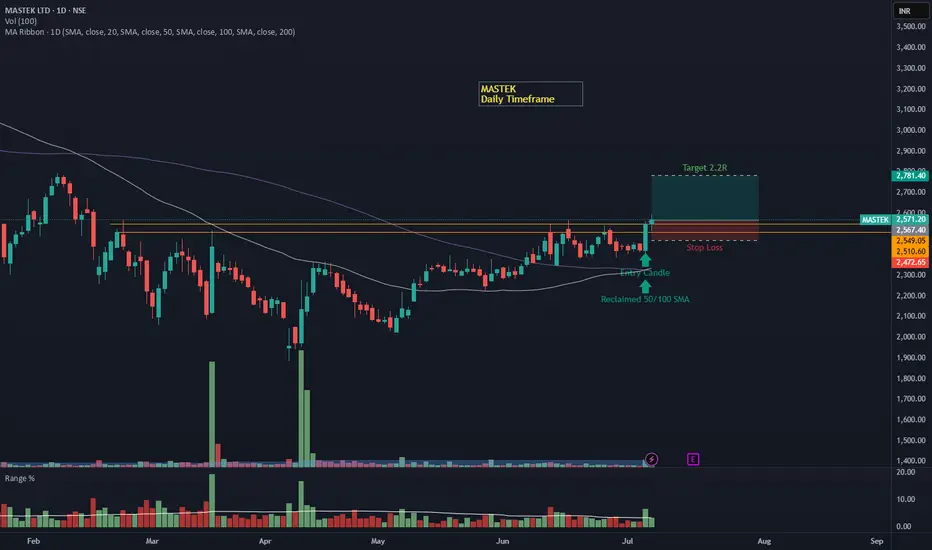
MASTEK – Daily Timeframe Breakout Idea (Resistance Zone Break)MASTEK has broken above a key resistance zone on the daily timeframe, backed by a strong bullish candle and a significant volume surge.
📌 Breakout Context:
The stock consolidated near the ₹2460–2480 zone for several sessions, forming a horizontal resistance zone.
On July 4th, the price broke out with strong bullish momentum, closing above the resistance with a wide-range green candle and a volume spike.
The breakout candle also closed above both 50- and 100-day Simple Moving Averages, confirming a bullish bias.
💡 Trade Setup:
Entry: ₹2550–2570 (near breakout)
Stop Loss: Below the breakout zone at ₹2472
Target: ₹2780+ (2.2R setup)
Risk-Reward: ~1:2.2 (ideal for swing trades)
🎯 Why This Setup Stands Out:
Volume on the breakout day is notably higher than average, confirming institutional interest.
Clean horizontal breakout from a multi-week range.
SMA structure is bullish, with the price reclaiming key MAs.
⚠️ Disclaimer: This post is for educational purposes only and not financial advice. Always consult your financial advisor before making trading decisions.
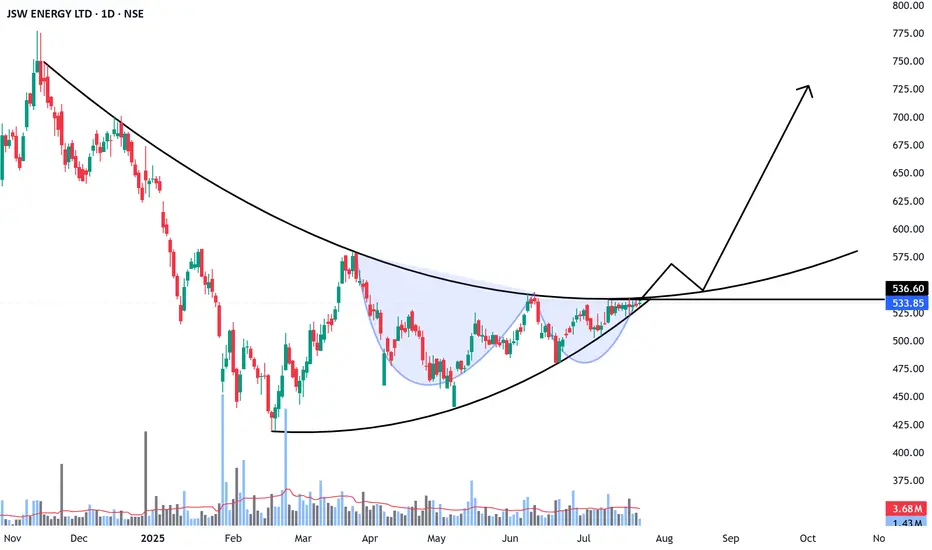
JSW Energy : Energy Stock Heating Up — Watch This Level!NSE:JSWENERGY
🧩 JSW Energy Ltd – Integrated Analysis (Technical + Fundamental)
🔍 1. Chart Technical Analysis
============================
✅ Cup and Handle Breakout in Progress
Pattern: Classic Cup and Handle visible on the daily chart.
Neckline: ₹536.60 — price is at ₹533.85, very close to breakout.
Cup base: ~₹440, Top: ~₹640 ⇒ Cup depth: ₹200
Measured Target: ₹537 + ₹200 = ₹735
🔼 Price Action & Momentum
Higher lows forming in handle → Sign of accumulation.
Volume contracting in the handle → textbook setup.
A breakout with strong volume can trigger sharp upward momentum.
📉 Indicators (Daily Timeframe)
RSI (14) ~58 Bullish, not overbought
MACD Crossover possible Upside momentum brewing
20/50/200 EMA Price trading above all Strong uptrend confirmation
Volume Contracted Perfect setup for breakout
==========================
🧠 2. Fundamental Analysis
==========================
💰 Q4 FY25 Snapshot
Net Profit: ₹408 Cr (YoY +16%)
Revenue: ₹3,189 Cr (YoY +16%)
Fundraising Plan: ₹10,000 Cr approved for green capacity expansion
🔋 Business Strength
Installed Capacity: 8,400+ MW
Diversified portfolio: Thermal, Hydro, Wind, Solar
Acquired: 4,700 MW renewable platform
On track to hit 20 GW by 2030
📊 Financial Metrics
P/E Ratio ~45–70x Slightly overvalued
ROE 8–11% Healthy
Operating Margin ~33% Efficient operations
Dividend Yield ~0.3–0.4% Low, due to reinvestment
Promoter Holding ~69% Strong promoter confidence
🌱 Growth Catalysts
Rising power demand (especially during heatwaves)
Government push for green hydrogen, energy storage
ESG-focused investors: recently added to ESG index
🧾 Final Takeaway –
Why JSW Energy Looks Attractive Now?
📈 Technical Setup : Cup & handle near breakout
💰 Earnings Growth : 16% profit, 16% revenue YoY
🌱 Renewable Push : Target 20GW by 2030
📊 Valuation : Slightly premium, justified
🔍 Volume Pattern : Accumulation confirmed
📌 Summary
JSW Energy is showing strong technical and fundamental convergence:
Technical: Breakout-level Cup & Handle + EMAs + RSI/MACD momentum
Fundamental: Rising profits, capacity expansion, green energy positioning
✅ Best viewed as a medium-to-long-term breakout play
🔐 Stop-loss discipline is very important for risk control
=====================================================
⚠️ Disclaimer:
This analysis is for educational and informational purposes only.
We are not SEBI-registered analysts or advisors.
This is our personal view based on available data and market trends.
Please consult your SEBI-registered investment advisor before making any investment or trading decisions.
You are solely responsible for any financial decisions you make based on this content.
========================
Trade Secrets By Pratik
========================
REC LTD : PSU Power Stock at a Major Demand Zone..NSE:RECLTD
🔍 TECHNICAL ANALYSIS
1. Trend Overview
Primary Trend: Long-term bullish trend from late 2022 to early 2024, followed by a correction.
Current Trend: Consolidation in a sideways range after a correction from ₹644.70 to ₹400.
2. Fibonacci Retracement Levels
From ₹91.40 (low) to ₹644.70 (high):
50% level: ₹368.05 ✅ Price is hovering slightly above this.
61.8% Golden Ratio: ₹302.75 ✅ Strong demand zone.
These levels act as major support zones.
3. Support and Demand Zone
The shaded blue region (₹302–₹368) represents a strong demand zone with confluence from both:
Historical price action support.
Fibonacci 50–61.8% retracement levels.
Price bounced near this zone previously, indicating institutional interest.
4. Price Structure
Price has formed a higher low near ₹368 and is now consolidating between ₹390–₹410.
Sideways candles suggest low volatility accumulation, which can precede a breakout.
5. Volume Analysis
Volume has declined significantly since the top.
A small spike in volume during the bounce from the 50–61.8% zone hints at smart money accumulation.
Need confirmation with rising volume and bullish breakout above ₹420.
6. Key Technical Levels
Resistance (Swing High) ₹644.70
Intermediate Resistance ₹420–₹440
Current Price ₹400.00
Support Zone ₹368–₹302
============================
📊 FUNDAMENTAL ANALYSIS
============================
1. Business Overview
REC Ltd (Rural Electrification Corporation Ltd) is a Navratna PSU under the Ministry of Power.
Primarily lends to power generation, transmission, and distribution projects.
Also active in green energy, infrastructure & smart metering – aligned with India’s energy transition goals.
2. Financial Highlights (as of FY24-25)
Market Cap ₹1.05 Lakh Crore (approx)
P/E Ratio ~6.5x
Dividend Yield ~5.8%
ROE ~21%
Net Profit (FY24) ₹13,500+ Cr (growing YoY)
Gross NPA < 2%
Loan Book > ₹4.5 Lakh Cr
Consistent profit growth, strong asset quality, and high dividend yield make it a fundamentally sound stock.
3. Growth Drivers
Increased electrification & infrastructure projects.
Government's push for smart metering & green energy.
REC is also diversifying into non-power infra (railways, logistics, roads).
4. Valuation
At ₹400, stock is still undervalued based on fundamentals.
P/B and P/E both suggest attractive levels compared to historical averages and PSU peers.
5. Risks
Rising interest rates may affect lending margins.
PSU discounts can lead to slower rerating despite strong financials.
Political and regulatory risks.
🔄 Technical + Fundamental Confluence
📉 Price Correction: Healthy retracement near 50–61.8% zone = good entry for long-term investors.
🏗️ Strong Fundamentals: Profitable, growing book, high ROE, and PSU tailwinds.
🧠 Smart Money Activity: Signs of accumulation + base formation in key demand zone.
📈 Upside Potential: If ₹420–440 breaks out, REC could retest ₹520–600 in the medium term.
📝 Conclusion & Strategy
➕ Positives
Technically in a strong demand zone.
Fundamentally solid with high dividends and low valuation.
Smart money possibly accumulating.
⚠️ Caution
Wait for breakout above ₹420 with volume for confirmation.
Keep stop-loss below ₹368 (50% retracement) for swing trades.
💡 Investor Strategy
Investors: Accumulate in dips between ₹370–₹400 for long-term.
Traders: Buy breakout above ₹420 with target ₹480–₹520; SL: ₹388.
===================================================================
⚠️ Disclaimer:
This analysis is for educational and informational purposes only.
We are not SEBI-registered analysts or advisors.
This is our personal view based on available data and market trends.
Please consult your SEBI-registered investment advisor before making any investment or trading decisions.
You are solely responsible for any financial decisions you make based on this content.
========================
Trade Secrets By Pratik
========================

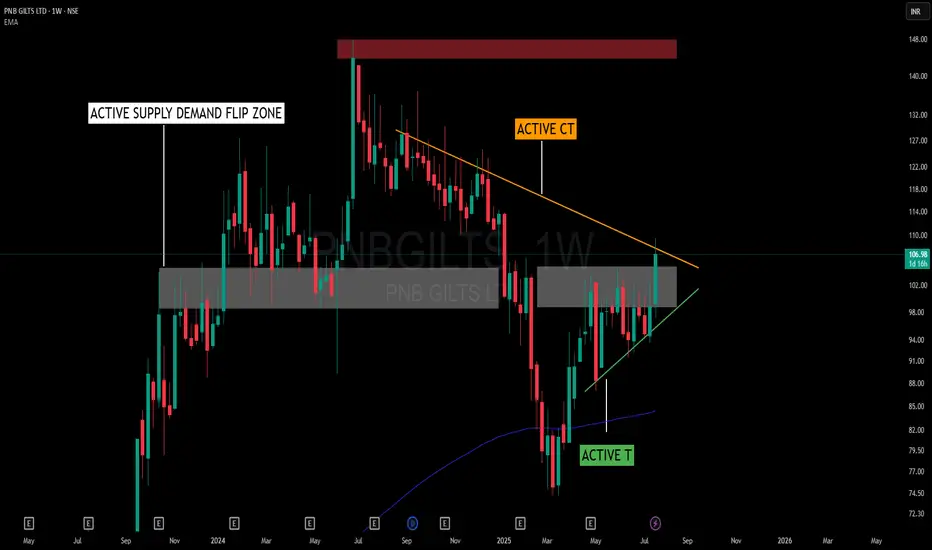
Squeezed by Structure – When Trendlines and Flip Zones CollideThis chart presents an interesting interaction between structure and zone dynamics without adhering to a textbook pattern name. The price is being squeezed within a random, yet well-defined structural form, shaped by the forces of support and resistance.
📌 Key Structural Notes:
🟠 Active Counter Trendline (CT) – Acting as overhead resistance, capping price for several weeks.
🟢 Rising Trendline (T) – Offering a base of support, encouraging higher lows and structural tightening.
🟫 Supply-Demand Flip Zone – A previously reactive supply zone now serving a dual role, showing consistent relevance to price behavior.
🟥 Major Supply Overhead – Remains untested, yet significant from a broader structure perspective.
Rather than labeling this as a triangle or cup-handle, it’s more about how CT and T are working together to compress price into a decision area. The presence of the flip zone adds to the friction, making this a valuable case to observe from a structural and behavioral standpoint.
🧠 Not a prediction or setup – just a visual study of how structure evolves when opposing pressures meet within a contextual zone.
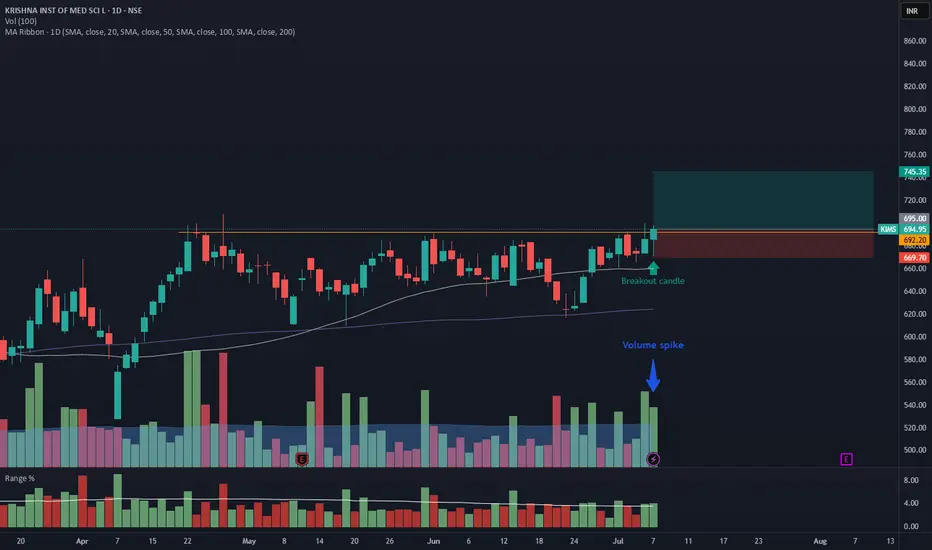
KIMS – Daily Timeframe Breakout Idea (Resistance Zone Break)
KRISHNA INSTITUTE OF MEDICAL SCIENCE has shown a breakout above a key horizontal resistance on the daily chart, accompanied by a ~2x volume surge, supported by strong momentum.
🔍 Breakout Context:
- Price broke above the ~692.20 horizontal resistance, which had held for over 2 months.
- Breakout supported by <2x average volume and just above average range on the breakout candle.
- The price is also trading above both the 50- and 100-day SMAs, indicating strong trend continuation.
- This aligns with a bullish continuation setup.
📉 Trade Plan:
- CMP: ₹694
- Entry: Near ₹695
- Target: ₹746 (~7.25% upside from CMP)
- Stop-Loss: ₹669
- Risk-Reward Ratio: ~1 : 2.0
📌 Note:
- Avoid chasing the extended move unless confident in intraday momentum.
⚠️ Disclaimer: This post is for educational purposes only and not financial advice. Always do your research or consult a financial advisor before trading.
BAJFINANCE looks bullish for swing and long-termMajor trend is clearly up - this has been a long-term outperformer. After a sharp rally, BAJFINANCE entered a corrective phase, but something interesting unfolded:
- The price respected the higher timeframe structure and did not make a lower low, indicating strength.
- A demand zone has now been established, from where price is showing signs of reversal.
- We’ve also seen a break above key lower highs, suggesting a shift in structure back to bullish.
- The consolidation and breakout pattern in the highlighted zone reflects a typical bullish continuation setup after a healthy correction.
This could very well be the early stage of a powerful bullish leg, and is good for both swing trades and long-term positioning.

JINDALSTEL : pattern breakout#JINDALSTEL #patterntrading #chartpatternbreakout #swingtrading
JINDALSTEL : Swing Trading
>> Breakout soon
>> Inverse Head & Shoulder pattern
>> Good Strength & Volumes Buildup
>> Trending setup
Swing Traders can lock profits at 10% and keep Trailing
Pls boost, Comment & Follow for more Analysis
Disc : Charts shared are for Learning purpose and not a Trade recommendation. Pls consult your Financial Advisor or a SEBI Registered Advisor before taking position in it

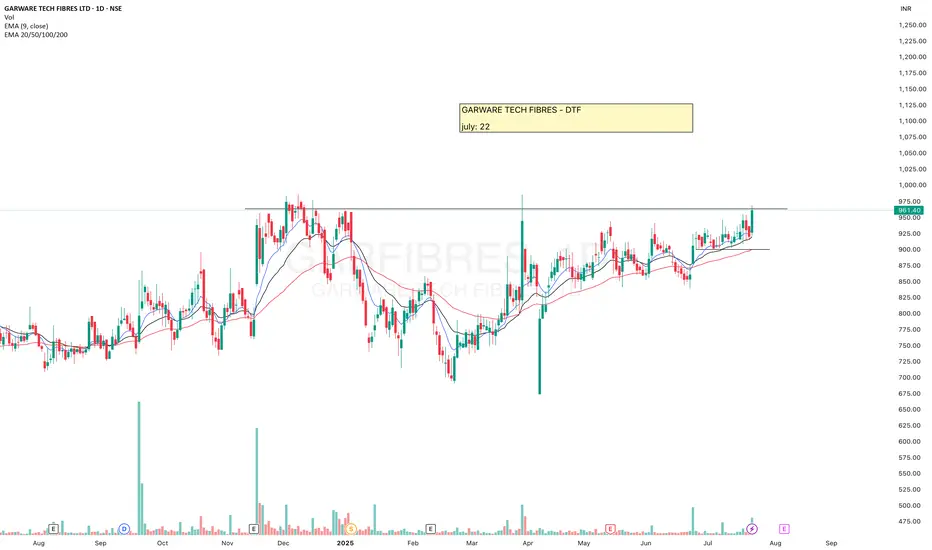
GARFIBRESGARWARE TECH FIBRES has formed a Bullish structure, made VCP pattern, volume is also visible.
Now it is at resistance, keep eyes on it as the breakout from here can give a good upside move.
Breaking ATH may boost it more. But definitely wait for the Re-test after the breakout.
📌 Re-test matters. Always!
Today I shared why waiting for a re-test is so important - with a real example.
Check out the chart and analysis on BLUEJET in my recent post.
It’ll make you rethink your entries.
✅ If you like my analysis, please follow me as a token of appreciation :)
in.tradingview.com/u/SatpalS/
📌 For learning and educational purposes only, not a recommendation. Please consult your financial advisor before investing.
MARKSANSMARKSANS looks good, it's been facing resistance for a long time, and now constantly making HL and Equal highs.
✅ If you like my analysis, please follow me here as a token of appreciation :)
in.tradingview.com/u/SatpalS/
📌 For learning and educational purposes only, not a recommendation. Please consult your financial advisor before investing.

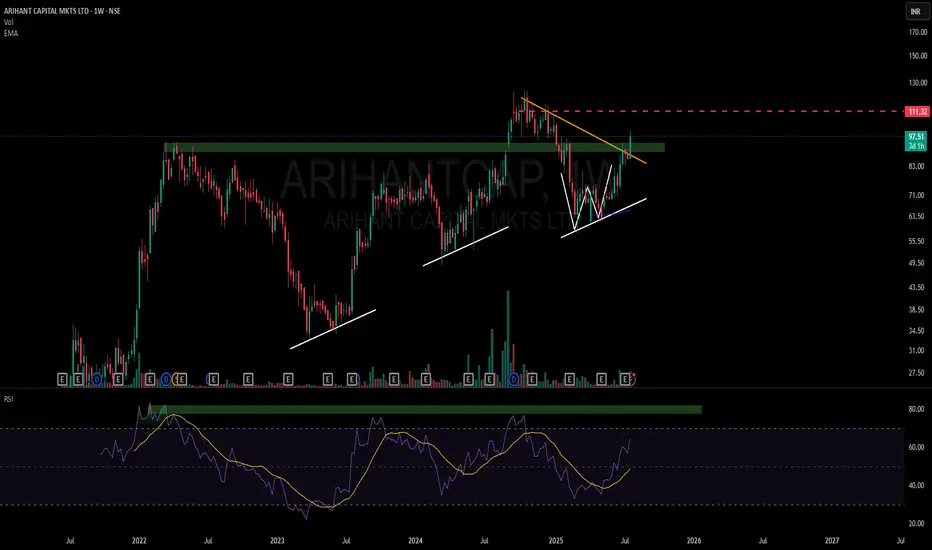
A Story of Structure, Strength, Supply Becomes Demand & RSI🔍 Key Observations:
- Supply ➡️ Demand Flip: The green zone previously acted as a supply region but was recently respected as demand, showcasing a classic SD conversion
- Double Bottom + Higher Lows (Structure): A W-bottom has formed on the weekly timeframe (WTF), with rising higher lows (marked in white)
- Weekly RSI Momentum: RSI has broken out of a local resistance, historically sensitive 76-80 band — a region that previously capped upside
📎 Why this matters (Learning Focus):
This chart provides a neat case study on how multiple timeframe resistance (red dotted) and structural clues such as higher lows, SD flips, and clean RSI zones
📘 Remember:
This is not a prediction — it's a framework for thinking. The goal here is to observe price behavior around critical levels, not a call or tip.