vcp BUY Key Elements of a VCP
Understanding the key elements of a VCP is crucial for successful trading. Here are some of the key elements:
Tightening from left to right within the base: You want to see multiple contractions, at least two, within the base.
Relative strength and accumulation signs: Watch fo
7.47INR
705.10 MINR
2.36 BINR
24.75 M
About ARIHANT CAPITAL MKTS LTD
Sector
Industry
Headquarters
Mumbai
Website
Founded
1992
ISIN
INE420B01036
FIGI
BBG000DYTWT7
Arihant Capital Markets Ltd. is a holding company, which engages in the provision of financial services. Its services include securities and commodities broking, financial planning, depository services, and merchant banking. The company was founded by Ashok Kumar Jain on June 25, 1992 and is headquartered in Mumbai, India.

Company Growth Is Impressive & Technically Also Looks Strong ✅ Arihant Capital Markets is forming a symmetrical triangle pattern with resistance at INR 80 and strong support at INR 60. The stock has shown a bullish breakout signal, suggesting potential upward movement towards INR 90.
✅ Arihant Capital Markets recently reported a 120.9% YoY increase in net sa

Bullish Momentum - Strong Technicals and Robust FundamentalsTrend Breakout: Arihant Capital has broken out above the crucial level of 80, signaling a potential shift in the trend to the upside.
Weekly Candlestick Strength: The stock exhibits a strong closing with an engulfing candlestick pattern on the weekly timeframe, indicating significant bullish sentime

Flag & Pole Pattern In Arihant Capital- Keep In Radar-flag and pole pattern breakout possible above 79
-strong closing in weekly basis
-engulfing candle- looks promising for upside momentum
-rise in rsi along with volume
- i am expecting 110 level soon
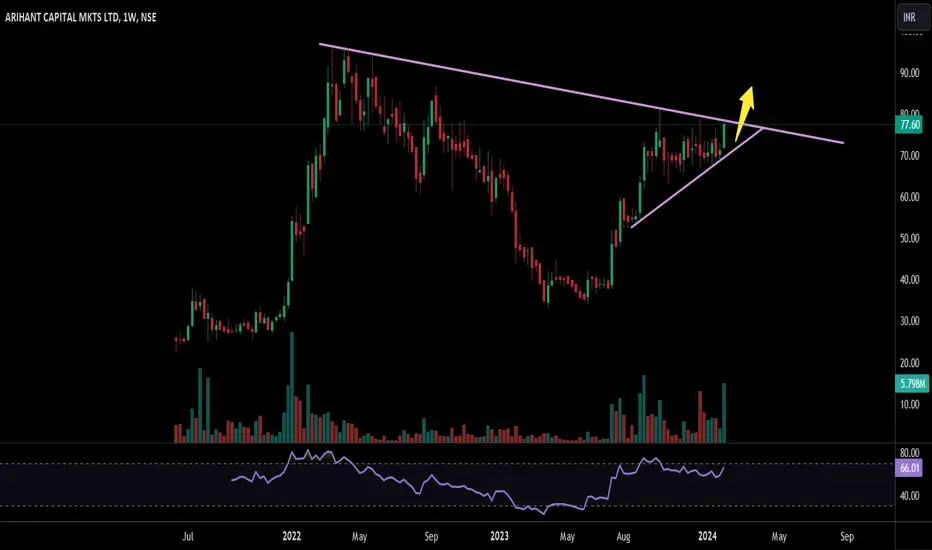
#ARIHANTCAP (Weekly)⚡️ATH breakout expected
⚡️Made base near 34 levels after good correction from ATH
⚡️140% return since Jun 23
⚡13 Weeks Tight Consolidation
🔴 SL 67
🟡 CMP 72
🟢 TGT 80/90/108

BREAKOUT, ARIHANT CAPITAL, 65% RETURNSBUY - ARIHANT CAPITAL MARKETS LTD
CMP - Rs. 70
Target - 1: Rs. 90
Target - 2: Rs. 115
.
Timeframe - 3 months - 8 months
.
Technicals - Trendline Breakout
.
This is just a view by an expert analyst, please invest at your own risk.
.
Follow me for more!

100% returns can be done in upcoming monthsEntry 45
SL 30
Target 100
It's financial are quite impressive and company's operating profit margin is also very good.


Expecting Breakout ✌✌This scrip is expected to give breakout in the coming days. So traders keep on your radar to catch the momentum. Thanks to all 🙏🙏
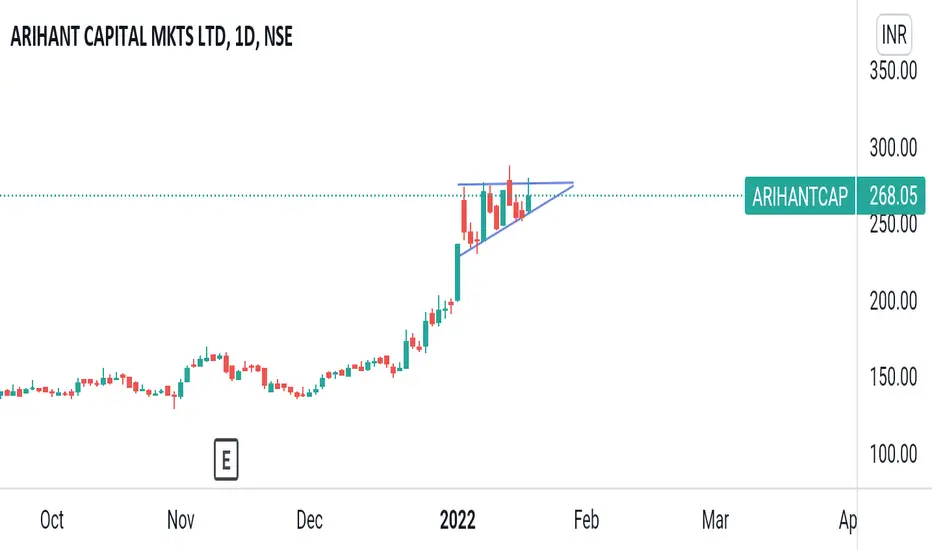
Arihantcapital can expect 5-15% can see it has already corrected from an high of 188.85
currently good to take or wait for breakout
can keep sl at 133 ,,tgt -1 160 ,or can add on dip if breaks down at 125 instead of stop loss already stock corrected so low chance that it will break down
rsi shows positive divergence and macd turn

See all ideas
Trade directly on the supercharts through our supported, fully-verified and user-reviewed brokers.


Frequently Asked Questions
The current price of ARIHANTCAP is 81.48 INR — it has increased by 3.55% in the past 24 hours. Watch ARIHANT CAPITAL MKTS LTD stock price performance more closely on the chart.
Depending on the exchange, the stock ticker may vary. For instance, on NSE exchange ARIHANT CAPITAL MKTS LTD stocks are traded under the ticker ARIHANTCAP.
ARIHANTCAP stock has fallen by 0.63% compared to the previous week, the month change is a 14.58% rise, over the last year ARIHANT CAPITAL MKTS LTD has showed a 60.55% increase.
ARIHANTCAP reached its all-time high on Mar 15, 2022 with the price of 95.90 INR, and its all-time low was 22.25 INR and was reached on Jun 18, 2021. View more price dynamics on ARIHANTCAP chart.
See other stocks reaching their highest and lowest prices.
See other stocks reaching their highest and lowest prices.
ARIHANTCAP stock is 7.22% volatile and has beta coefficient of 1.39. Track ARIHANT CAPITAL MKTS LTD stock price on the chart and check out the list of the most volatile stocks — is ARIHANT CAPITAL MKTS LTD there?
Today ARIHANT CAPITAL MKTS LTD has the market capitalization of 8.20 B, it has decreased by 4.72% over the last week.
Yes, you can track ARIHANT CAPITAL MKTS LTD financials in yearly and quarterly reports right on TradingView.
ARIHANTCAP net income for the last quarter is 188.08 M INR, while the quarter before that showed 246.60 M INR of net income which accounts for −23.73% change. Track more ARIHANT CAPITAL MKTS LTD financial stats to get the full picture.
Yes, ARIHANTCAP dividends are paid annually. The last dividend per share was 0.40 INR. As of today, Dividend Yield (TTM)% is 0.51%. Tracking ARIHANT CAPITAL MKTS LTD dividends might help you take more informed decisions.
EBITDA measures a company's operating performance, its growth signifies an improvement in the efficiency of a company. ARIHANT CAPITAL MKTS LTD EBITDA is 1.02 B INR, and current EBITDA margin is 39.52%. See more stats in ARIHANT CAPITAL MKTS LTD financial statements.
Like other stocks, ARIHANTCAP shares are traded on stock exchanges, e.g. Nasdaq, Nyse, Euronext, and the easiest way to buy them is through an online stock broker. To do this, you need to open an account and follow a broker's procedures, then start trading. You can trade ARIHANT CAPITAL MKTS LTD stock right from TradingView charts — choose your broker and connect to your account.
Investing in stocks requires a comprehensive research: you should carefully study all the available data, e.g. company's financials, related news, and its technical analysis. So ARIHANT CAPITAL MKTS LTD technincal analysis shows the strong buy rating today, and its 1 week rating is buy. Since market conditions are prone to changes, it's worth looking a bit further into the future — according to the 1 month rating ARIHANT CAPITAL MKTS LTD stock shows the buy signal. See more of ARIHANT CAPITAL MKTS LTD technicals for a more comprehensive analysis.
If you're still not sure, try looking for inspiration in our curated watchlists.
If you're still not sure, try looking for inspiration in our curated watchlists.