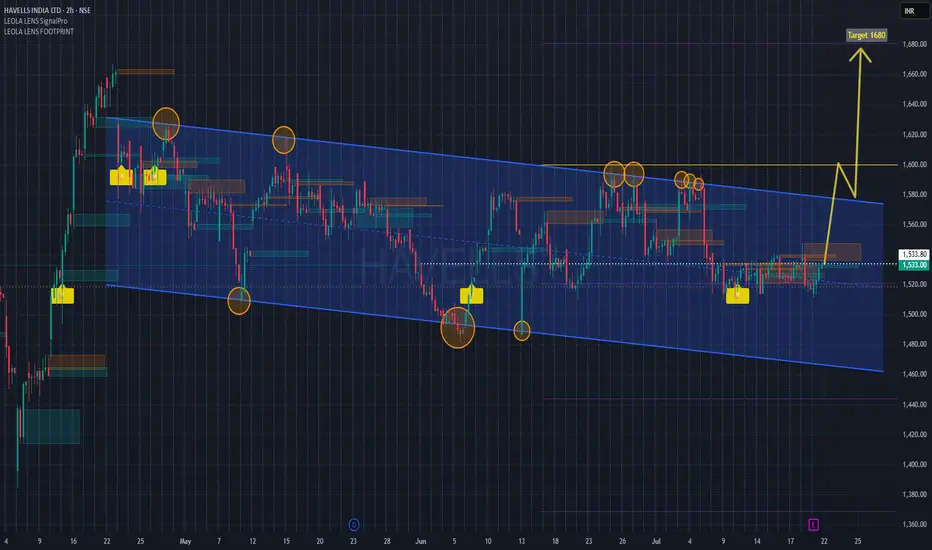
HAVELLS Channel Breakout Setup with Earnings Ahead Havells is approaching a crucial resistance trendline within a well-defined downward sloping channel. Price currently tests mid-channel and historical supply zones, with multiple Leola Lens SignalPro yellow caution labels plotted—historically seen before directional reversals.
📌 Structure Highlights:
Clear channel formation since April
Multiple resistance rejections near 1580 zone
Buy interest seen near lower boundary with SignalPro confirmation
Breakout projection suggests target zone near 1680, aligning with prior volume gap
📅 Earnings event likely to be a catalyst. Monitor price behavior post-results for potential breakout confirmation above 1580.
🧠 Leola Lens™ SignalPro Notes:
Yellow caution labels have repeatedly appeared near key turning points within the channel, suggesting possible trend transition zones. These zones highlight moments of institutional activity, where smart money behavior often shifts.
The yellow caution markers indicate potential trend change zones, based on historical conditions where price has shown institutional interest or liquidity shifts. These zones are not direct buy/sell signals, but highlight areas to monitor closely for structural confirmation.
🧠 This chart is intended for educational and structural analysis only. No financial advice.
Swingtrading
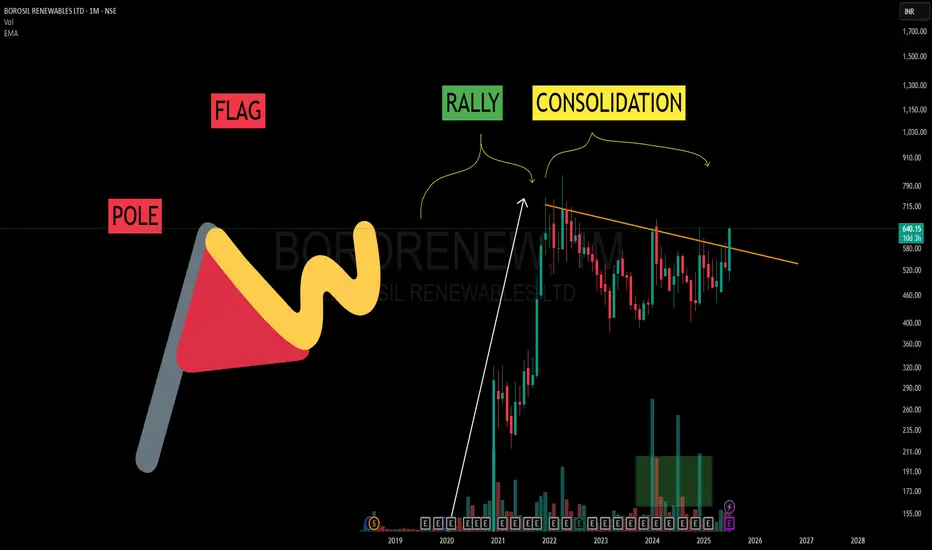
Flag, Pole and Patience– Learning from the Bigger TimeframeIn trading, patterns on higher timeframes often carry deeper meaning.
What you’re seeing in this chart isn’t a forecast — it’s a learning opportunity.
Let’s break this down:
🔺 POLE:
This sharp rally from 2020–2022 represents a strong burst of momentum. That’s your Pole — it shows clean directional intent from market participants.
🏁 FLAG:
After the rally, price didn’t crash — it started consolidating. This sideways or slightly downward structure is known as the Flag.
It often appears as a phase of “cooling off” — traders taking profits, new buyers waiting.
📈 RALLY + CONSOLIDATION = Classic Flag & Pole
A rally followed by consolidation = textbook flag structure.
⏳ And here’s the takeaway:
When viewed on a Monthly (WTF - Way Too Far 😅) timeframe, these patterns take years to form. But that also means they carry weight.
No predictions here. Just learning.
Understanding market rhythm through structure > outcome can be your edge.
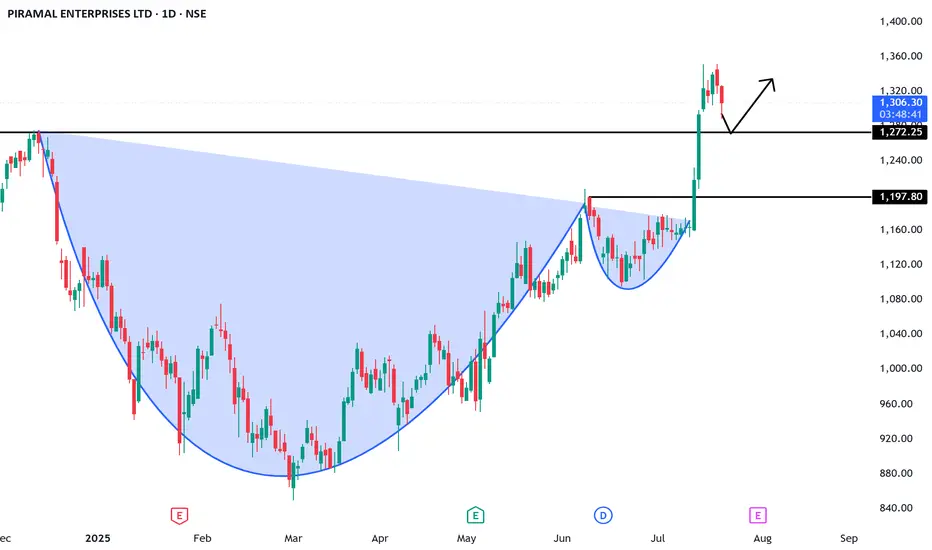
PEL : Is this just a breakout… or start of a multi-bagger move?NSE:PEL
🔍 Technical Analysis (Chart-Based)
📌 Pattern:
Cup and Handle Breakout clearly visible
Strong breakout above ₹1,197.80 neckline
Brief retracement after rally, likely testing ₹1,272.25 as support
📊 Key Levels:
Immediate Support: ₹1,272.25 (could act as a bullish retest)
Major Support: ₹1,197.80 (neckline of the cup and handle)
Resistance Zone: ₹1,360–1,400 (potential target zone post breakout)
🔄 Indicators & Momentum:
A strong bullish trend confirmed with higher highs and higher lows
Volume during breakout likely high (needs confirmation)
If price respects ₹1,272 and reverses, fresh upmove possible
🎯 Technical Summary:
Trend: Bullish
Bias: Buy on dips near support zones
Targets: ₹1,360, then ₹1,420
Stop Loss: Below ₹1,197
========================================
🧮 Fundamental Analysis (PEL - 2025 Outlook)
========================================
🏢 About the Company:
Piramal Enterprises Ltd operates mainly in:
Financial services (retail and wholesale lending)
Recent demerger of pharma business (PEL is now a pure NBFC)
📈 Key Financials (FY24–FY25E):
Metric Value
Market Cap ~₹30,000+ Cr
Revenue (FY24) ₹8,200+ Cr
Net Profit (FY24) ₹900+ Cr
P/E Ratio ~28–30x
Book Value ~₹1,300+
Price-to-Book (P/B) ~1.0x
ROE 6–8%
Debt/Equity ~0.8–1.0x
🔍 Key Positives:
Strong book value support
Low P/B indicates undervaluation vs peers
Cleaned-up balance sheet after pharma demerger
Focus on retail lending (more stable than wholesale)
⚠️ Risks to Watch:
Still consolidating after business restructuring
NBFC sector sensitive to interest rate cycles & RBI regulation
ROE still on the lower side compared to peers
=====================================
📌 Investment View (Short + Long-Term)
=====================================
✅ Short-Term View (1–3 months):
Technicals favor continuation of uptrend
Momentum can take it to ₹1,360–1,400 if support holds
✅ Long-Term View (6–18 months):
Strong restructuring play post-demerger
Clean balance sheet and pivot to retail NBFC is positive
Long-term target can be ₹1,600–1,800 if execution remains strong
========================================
⚠️ Disclaimer:
This analysis is for educational and informational purposes only.
We are not SEBI-registered analysts or advisors.
This is our personal view based on available data and market trends.
Please consult your SEBI-registered investment advisor before making any investment or trading decisions.
You are solely responsible for any financial decisions you make based on this content.
========================
Trade Secrets By Pratik
========================
Big Move Coming? Watch This Classic VCP Setup on Shriram FinanceHello everyone, i hope you all will be doing good in your trading and your life as well. Today i have brought a setup which name is VCP (Volatility Contraction Pattern) is one of the most powerful base setups, where the price contracts in multiple tight ranges, showing controlled strength. It signals that supply is drying up and the stock is getting ready for a strong move, usually a breakout. What makes it special is the combination of tightening price with lowering volume , and that's exactly what we can observe in Shriram Finance right now.
The stock has taken multiple supports from key EMAs like 9, 21, and 50 during this entire consolidation, a classic VCP sign. With each dip being bought quickly and bounce getting tighter, the stock is preparing for a potential breakout move.
Keep this one on radar , structure is clean, volume behavior is ideal, and if momentum comes, VCP patterns don’t disappoint.
For levels and risk-reward, please refer the chart above.
Disclaimer: This analysis is for educational purposes only. Please consult a financial advisor before making investment decisions.

Aether Industry — 92% profit growth and zero debt NSE:AETHER
A silent specialty chemical beast—92% profit growth and zero debt...!
🏢 **Company Overview:**
Aether Industries is a Surat-based specialty chemical manufacturer focused on high-margin, research-driven intermediates used in pharmaceuticals, agrochemicals, coatings, and oil & gas. It is known for proprietary process chemistry and niche product innovation.
📈 Fundamental Analysis:
✅ Key Financials (FY25 Estimates):
Market Cap: ₹10,900 Cr
Revenue: ₹838 Cr (+40% YoY)
Net Profit: ₹158 Cr (+92% YoY)
EBITDA Margin: ~32%
Net Profit Margin: ~19%
ROE / ROCE: ~7.4% / ~6%
P/E Ratio: ~70x
Debt to Equity: ~0.06 (Debt-free)
🧩 Strengths:
Fast-growing specialty chemical company with proprietary products.
Debt-free and financially stable.
High-margin CRAMS and contract manufacturing model.
⚠️ Risks:
Valuation is rich, pricing in future growth.
Return ratios (ROE/ROCE) are modest compared to peers.
📊 Technical Analysis (As of July 2025):
CMP: ₹823
52-Week Range: ₹725 – ₹1,071
Moving Averages: Price above 50/100-day MAs; approaching 200-day MA
RSI: ~65 (Neutral–Bullish)
MACD: Neutral to Mild Bullish
Support: ₹780 – ₹800
Resistance: ₹832 – ₹840
📉 Short-Term Outlook:
A breakout above ₹840 may trigger upside to ₹900+. A close below ₹800 could lead to short-term weakness.
🚀 Future Growth Prospects:
High-Margin Niche Leadership: Focused on low-volume, high-value intermediates with global demand.
Strong Financial Performance: Consistent revenue and profit growth; scalable R&D-driven model.
Export & Global Pharma Exposure: Major clients across US, EU, and Japan.
New Capacity Expansion: Setting up new manufacturing blocks to double capacity over the next 2 years.
📝 Conclusion:
Parameter Verdict
Fundamentals 🔵 Strong – R&D-led growth with clean balance sheet
Technicals 🟠 Mixed – needs breakout above key resistance
Valuation 🟠 Expensive – high P/E, growth priced in
Long-Term View ✅ Positive – niche specialty play
Short-Term View 🔄 Wait for breakout or accumulate on dips
==========================================================
==========================================================
⚠️ Disclaimer:
This analysis is for educational and informational purposes only.
We are not SEBI-registered analysts or advisors.
This is our personal view based on available data and market trends.
Please consult your SEBI-registered investment advisor before making any investment or trading decisions.
You are solely responsible for any financial decisions you make based on this content.
========================
Trade Secrets By Pratik
========================

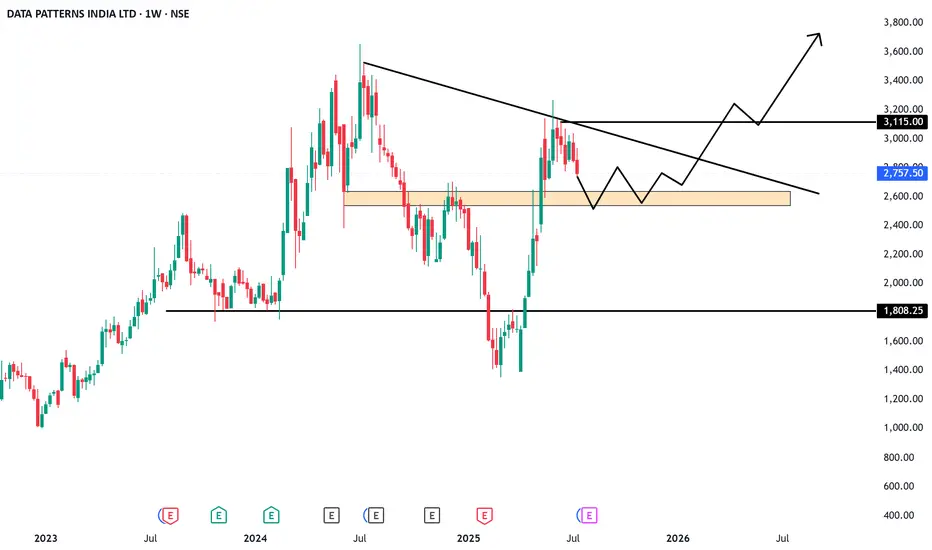
Data Patterns: Brain behind India’s missile, radar & ISRO tech.NSE:DATAPATTNS
🏢 Company Overview:
Data Patterns is a vertically integrated defense and aerospace electronics solutions provider. It designs, develops, manufactures, and tests advanced electronic systems used in:
Radar, Electronic Warfare
Avionics, Missile Systems
Satcom, Communication & Surveillance
It’s one of the few Indian defense electronics companies with end-to-end capabilities—from design to delivery.
📈 Fundamental Analysis:
✅ Key Financials (FY24-25 Estimates):
Market Cap ₹13,000+ Cr
Revenue (FY24) ₹480–500 Cr
EBITDA Margin ~38%
PAT Margin ~28–30%
ROE / ROCE 25%+ / 30%+
Debt to Equity 0 (Debt-free)
P/E Ratio ~70x (Premium)
🧩 Strengths:
Strong order book visibility with over ₹900 Cr+ backlog.
In-house R&D and full control over hardware + software.
Supplied systems to ISRO, DRDO, BEL, HAL — proven credibility.
High margin & asset-light business model.
⚠️ Risks:
Heavy dependency on government contracts (lumpy revenue).
High valuations — pricing in future growth.
Competition from global defense OEMs and local PSU giants.
📊 Technical Analysis (As of July 2025):
🧾 Price Action Summary:
CMP: ₹2,880 (Example)
52-Week Range: ₹1,650 – ₹2,980
Trend: Strong uptrend since Jan 2025
Support Zone: ₹2,550 – ₹2,650
Resistance: ₹3,000 (psychological and technical resistance)
🔍 Indicators:
200 EMA: ₹2,200 (Stock trading well above long-term average)
MACD: Positive with histogram expanding
RSI: 71 – Overbought, watch for pullbacks
Volume: Spikes near breakout levels – confirms strength
📉 Short-Term View:
Likely to consolidate near ₹2,800–₹3,000
Fresh breakout above ₹3,000 may lead to ₹3,400–₹3,600 zone
🚀 Future Growth Prospects:
🛰️ 1. Defense Capex Boom:
Indian Government’s “Atmanirbhar Bharat” push & higher defense budget directly benefits defense tech firms like Data Patterns.
🧠 2. R&D & IP-Led Growth:
Owns IP of most products – high operating leverage and export potential.
🌍 3. Export Market Entry:
Partnering with foreign OEMs; growing traction in South-East Asia, Middle East.
🛠️ 4. Order Book Strength:
High-margin orders across radar, avionics, and missile sub-systems.
Client base includes DRDO, BrahMos, BEL, ISRO, HAL – strong pipeline ahead.
📝 Conclusion:
Parameter Verdict
Fundamentals 🔵 Very Strong (Debt-free, high ROCE)
Technicals 🟢 Bullish (Watch ₹3,000 zone)
Valuation 🟡 Expensive but justified by moat
Long-Term View ✅ Positive – IP-driven defense electronics play
Short-Term View 🔄 Wait for breakout or buy on dips near ₹2,600
=====================================================
=====================================================
⚠️ Disclaimer:
This analysis is for educational and informational purposes only.
We are not SEBI-registered analysts or advisors.
This is our personal view based on available data and market trends.
Please consult your SEBI-registered investment advisor before making any investment or trading decisions.
You are solely responsible for any financial decisions you make based on this content.
========================
Trade Secrets By Pratik
========================
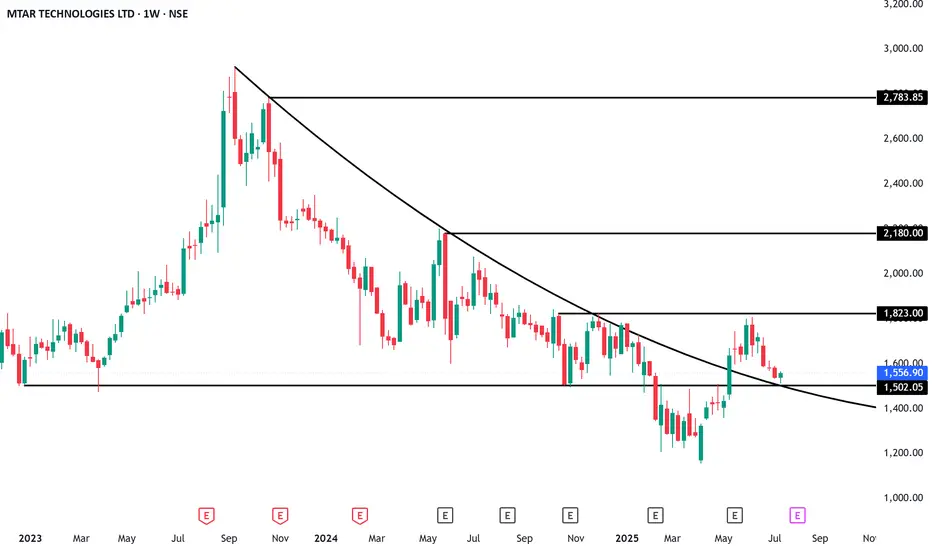
MTAR Technologies: The hidden giant behind space & clean Energy NSE:MTARTECH
🏢 Company Overview:
MTAR Technologies Ltd is a precision engineering company catering to high-value, mission-critical sectors such as:
Clean Energy (Hydrogen, Nuclear, etc.)
Space & Defence
Aerospace
They manufacture critical components like fuel cells, nuclear reactor parts, aerospace engines, and satellite launch system parts.
📈 Fundamental Analysis:
✅ Key Financials (FY24-25 Estimates):
Market Cap : ₹6,500+ Cr
Revenue (FY24) : ₹650 Cr+
EBITDA Margin : ~28-30%
PAT Margin : ~15%
ROE / ROCE : 15-18% / 20%+
Debt to Equity : 0.1 (Very low)
P/E Ratio : ~45x (Premium)
🧩 Strengths:
Strong order book from ISRO, DRDO, BHEL, and international clean energy players like Bloom Energy.
Technological moat in nuclear & space-grade precision engineering.
Low debt, high return ratios—financials are robust.
Entering Hydrogen & Fuel Cell space—a big long-term catalyst.
⚠️ Risks:
Dependency on a few clients (Bloom Energy being a major one).
Volatility in clean energy adoption pace.
High valuation – priced for growth.
📊 Technical Analysis (As of July 2025):
🧾 Price Action Summary:
CMP: ₹2,050 (Example)
52-Week Range: ₹1,250 – ₹2,150
Trend: Bullish continuation from March 2025
Support Zone: ₹1,860 – ₹1,950
Resistance: ₹2,150 (all-time high breakout zone)
🔍 Indicators:
200 EMA: ₹1,620 (Stock trading well above 200 EMA)
MACD: Bullish crossover on daily chart
RSI: ~67—momentum strong but near overbought zone
Volume: Rising steadily with price—confirms strength
📉 Short-Term View:
Healthy consolidation expected around ₹2,000–₹2,150
A breakout above ₹2,150 could lead to ₹2,400–₹2,600 zone
🚀 Future Growth Prospects:
🔬 1. Clean Energy Boom:
Supplying parts to Bloom Energy (US-based Fuel Cell firm).
India’s green hydrogen policy and PLI schemes can benefit MTAR.
🛰️ 2. Space & Defense:
Increasing budgets in defense, ISRO’s new missions, and India’s entry into private space programs can drive long-term orders.
💹 3. Export Potential:
MTAR is entering global markets for nuclear and aerospace precision components.
USD-denominated revenues provide a hedge and higher margins.
🌱 4. Capex & Expansion:
New manufacturing facility in Adibatla, Telangana.
Capex being done to triple capacity in the coming 3–5 years.
📝 Conclusion:
Parameter Verdict
Fundamentals 🔵 Strong (Clean Balance Sheet, Healthy Margins)
Technicals 🟢 Bullish (But Near Resistance)
Valuation 🟡 Slightly Overvalued (but justified by growth)
Long-Term View ✅ Positive – Multiyear structural story
Short-Term View 🔄 Wait for consolidation or breakout above ₹2,150
⚠️ Disclaimer:
This analysis is for educational and informational purposes only.
We are not SEBI-registered analysts or advisors.
This is our personal view based on available data and market trends.
Please consult your SEBI-registered investment advisor before making any investment or trading decisions.
You are solely responsible for any financial decisions you make based on this content.
========================
Trade Secrets By Pratik
========================
Tools
MAHLIFEMAHLIFE looks good.
Small pullback for the Entry will be good. Keep eyes on it.
✅ If you like my analysis, please follow me as a token of appreciation :)
in.tradingview.com/u/SatpalS/
📌 For learning and educational purposes only, not a recommendation. Please consult your financial advisor before investing.

BLUEJETBLUEJET looks strong.
It gave breakout, a small pullback will be good for the Entry as it is bit far away from 20ema, once it touches the 20ema then we may expect a good upside move.
Keep eyes on it.
✅ If you like my analysis, please follow me as a token of appreciation :)
in.tradingview.com/u/SatpalS/
📌 For learning and educational purposes only, not a recommendation. Please consult your financial advisor before investing.

PVRINOXPVRINOX is looking good.
Making VCP pattern, equal highs and HL formation and good volume. Keep eyes on it.
✅ If you like my analysis, please follow me as a token of appreciation :)
in.tradingview.com/u/SatpalS/
📌 For learning and educational purposes only, not a recommendation. Please consult your financial advisor before investing.

Nifty 50 - 1D Timeframe📊 Nifty 50 – Daily Chart Overview (1D Timeframe)
Current Close (July 18): Around 24,968
Change: Down ~143 points (–0.57%)
Intraday Range: High ~25,145 | Low ~24,918
52‑Week Range: 21,744 to 26,277
YTD Performance: Approximately +5.6%
📈 Technical Indicators
RSI (14-day): ~32.5
This shows that the market is entering bearish territory, but not yet oversold.
MACD: Below signal line, value ~–67
A clear sell signal, confirming negative momentum.
Stochastic Oscillator: Above 98
Indicates that the index is overbought, and a correction may be due.
ADX (Average Directional Index): ~48
Signifies a strong trend—right now, it’s favoring bearish movement.
Other Oscillators (CCI, ROC, Ultimate): Mostly giving sell signals
🧠 Market Sentiment & Context
Nifty has been bearish for the third straight week
Trading is happening below the 20-day EMA, suggesting downward pressure
Overall tone is range-bound and lacking momentum due to:
Weak quarterly earnings
Foreign investor selling
Global market uncertainty
📉 Volatility & Risk Gauge
India VIX: ~11.2 to 11.4
This is the lowest in 15 months, signaling low market fear
Low VIX often means sideways consolidation and narrow movement
📊 Put-Call Ratio (PCR) & Options View
PCR (based on open interest): ~0.80
Indicates a bearish bias
More calls being written compared to puts
🏦 Bank Nifty Overview (for Comparison)
Close: ~56,283
Drop: ~1%
RSI: ~28 (Bearish)
MACD: Sell signal
Resistance: 57,200 – 57,600
Support: 56,300 – 55,800
Bank Nifty is also showing bearish momentum and mirrors Nifty’s structure.
📅 What to Watch Next
Corporate Q1 results – especially from large caps like Reliance, HDFC, ICICI
Global cues – US inflation, interest rate decisions, global markets
India VIX – If it spikes above 14–15, market fear might return
FIIs activity – Any strong buying/selling can swing the market
✅ Summary (Daily Timeframe)
Nifty is currently weak and range-bound
Key level to hold: 24,900
Key level to break: 25,250
Momentum is with sellers; cautious approach recommended
If no trigger appears, expect sideways movement or slow decline

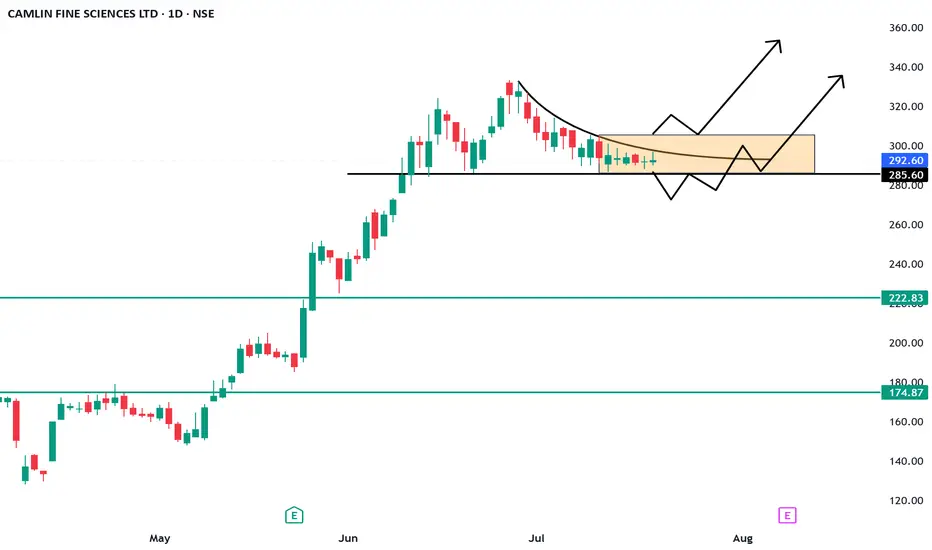
CAMLINFINE Very high Potential ScriptNSE:CAMLINFINE
Stock has given Very strong move in weekly chart from 130 to 330 within just 5-6 weeks
It shows the strength now it's consolidating with low volume.
High potential of Flag and pole setup
Good to keep on the radar
Always respect SL & position sizing
========================
Trade Secrets By Pratik
========================
Disclaimer
NOT SEBI REGISTERED
This is our personal view and this analysis
is only for educational purposes
Please consult your advisor before
investing or trading
You are solely responsible for any decisions
you take on basis of our research.
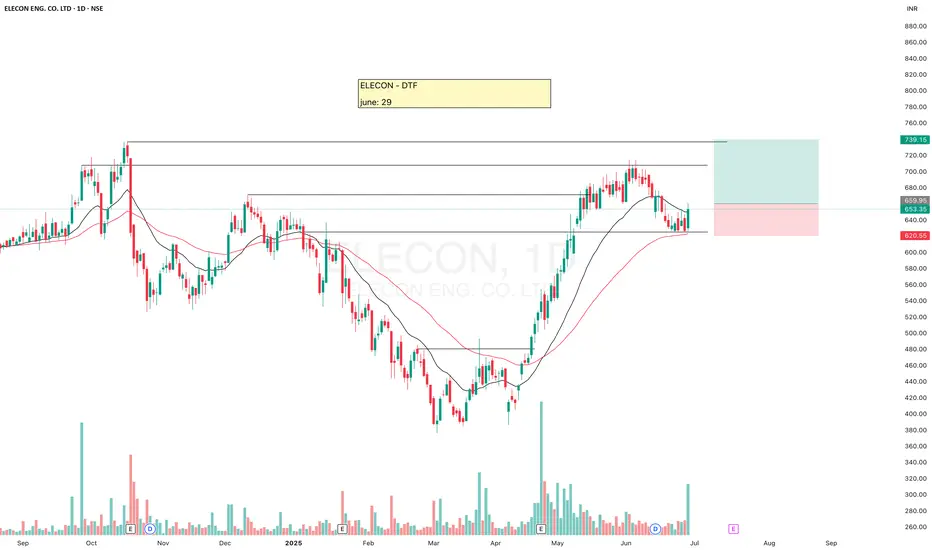
ELECONELECON seems to be ready to give an upside move.
Good volume may push it, above 20ema.
✅ If you like my analysis, please follow me as a token of appreciation :)
in.tradingview.com/u/SatpalS/
📌 For learning and educational purposes only, not a recommendation. Please consult your financial advisor before investing.
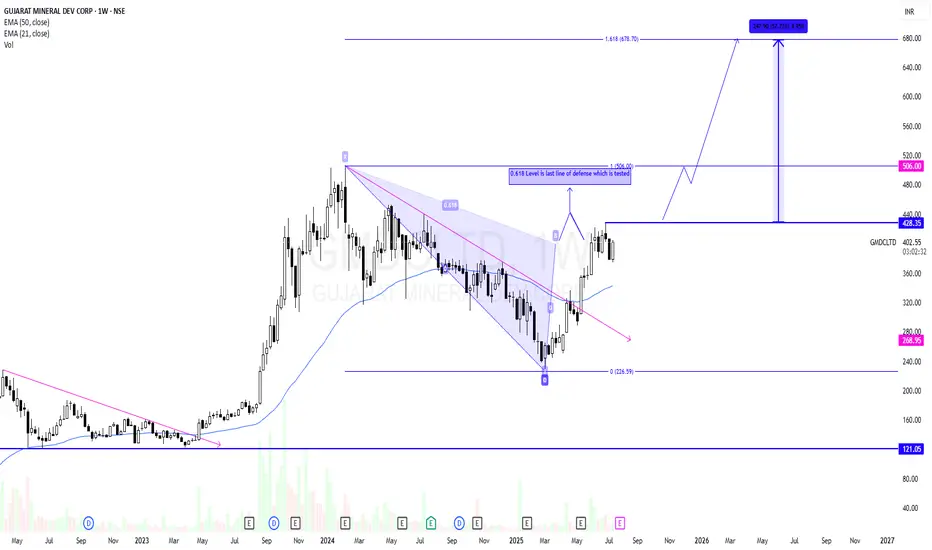
GMDCLTD - Potential Swing CandidateGMDCLTD has recently ended its correction phase and reversed. It has retraced till 0.618 level and has got a small rejection. 0.618 is last line of defence for sellers in many cases. Above 0.618 level a strong momentum likely to come.
Risk will be previous swing low after breakout.
As per price structure 430 is the last swing high. Breakout will start a strong momentum towards ATH and above that it is likely to test 678 as per Fib extension.
So put an alert to track this for your learning.
Learning Part :-
A rise in price then a correction in a channel formation is good to buy on breakout.
I am Not SEBI Registered
This is my personal analysis for my personal trading. Kindly consult your financial advisor before taking any actions based on this.
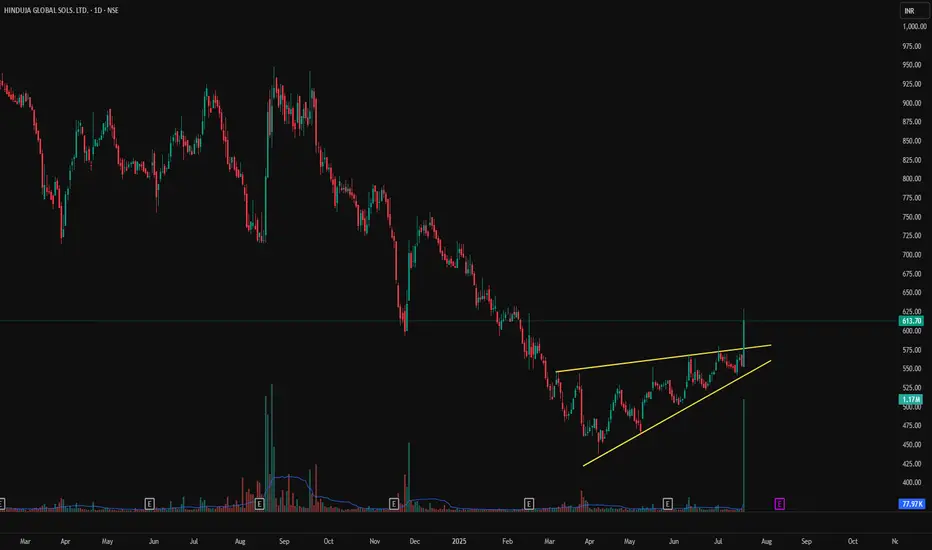
HGS - Rising Wedge Breakout on Volume Spike | Daily Chart📊 HGS – Rising Wedge Breakout on Volume Spike | RSI Above 70 | Fresh Bullish Momentum
📅 Chart Date: July 17, 2025
📍 CMP: ₹613.70 (+10.72%)
📈 Symbol: NSE:HGS | 1D Timeframe
🔍 Technical Analysis Breakdown
🔺 Rising Wedge Breakout
Price broke above the upper resistance of a rising wedge pattern.
Strong confirmation with a wide bullish candle and volume spike.
📊 Volume Surge
Volume: 1.17M against average volume of ~78K
Sudden institutional interest or news-based momentum likely behind the move.
📉 RSI (14, close): 73.03
RSI crossed into overbought territory, showing strong bullish momentum but could warrant caution or consolidation soon.
📌 Support & Resistance Levels
Breakout Zone: ₹580–₹590
Next Resistance: ₹650+ (gap-fill zone from earlier breakdown)
Support: ₹560 (upper trendline of broken wedge)
📌 Key Observations
First strong breakout since months of sideways to bullish accumulation.
Sustained close above ₹590–₹600 will confirm continuation.
Caution if price retraces inside wedge again.
🏁 Trade Setup
Entry: On Retest of ₹590–₹600
Target: ₹650 / ₹675
Stoploss: Below ₹560
Risk Level: Moderate (due to overbought RSI)
⚠️ Disclaimer: This is an educational chart setup and not trading advice. Please conduct your own research and risk management.
📣 Follow @PriceAction_Pulse for more such clean breakouts and chart pattern analysis!
🔁 Drop a comment if HGS is on your radar for the next breakout rally 📈
Radhika Jeweltech – Classic Contraction PatternTimeframe: Weekly
Structure Observed: Contraction Pattern between Trendlines
Volume: Significant recent uptick 📊
Key Zones:
🔴 Supply Zone above 123
🟢 Dynamic Support from ascending trendline
🟠 Active counter-trendline now breached
After months of lower highs and higher lows, the price has been squeezing into a classic contraction pattern between a descending orange trendline (acting as counter-trendline resistance) and a rising green trendline providing consistent support.
This week’s candle has decisively broken above the descending trendline on strong relative volume.
With the weekly close due tomorrow, all eyes remain on how the candle settles — will it sustain this breakout structurally or retreat below the trendline?
📌 Important Note: This is a technical observation — not a trade recommendation.

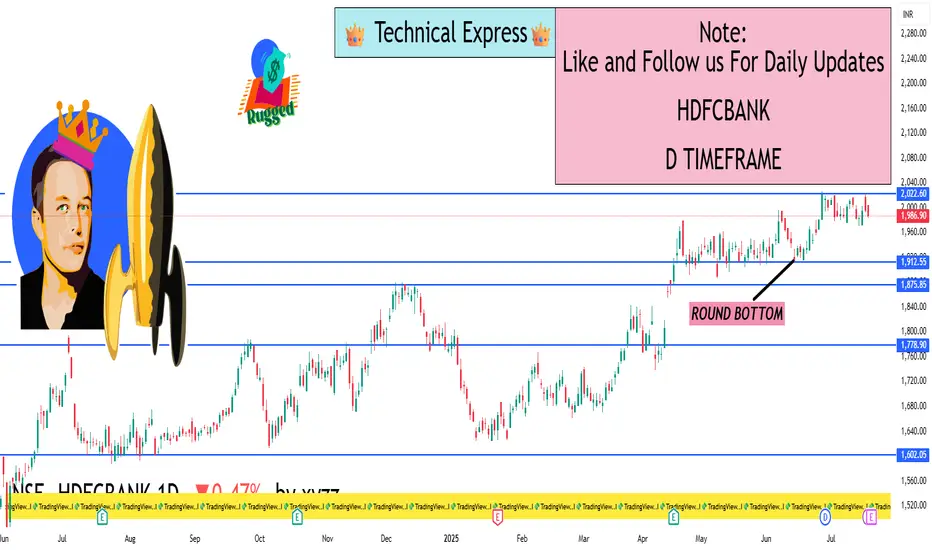
HDFCBANK 1d investment levelKey Support (Buy-on-Dip) Levels
(Where buyers tend to show up)
₹1,985 – ₹1,986 (S1 – Classic Pivot)
First support zone based on classic pivot calculations
₹1,973 – ₹1,974 (S2 – Fibonacci Pivot)
Stronger cushion in case of deeper pullbacks
₹1,954 – ₹1,955 (S3 – Classic Pivot)
Final buffer zone—breaking it may signal deeper weakness
🚧 Key Resistance (Profit-Taking) Levels
(Where selling might appear)
₹2,015 – ₹2,016 (R1 – Classic/Fibonacci Pivot)
Immediate resistance and possible profit-booking zone
₹2,033 – ₹2,034 (R2 – Classic/Fibonacci Pivot)
Next hurdle; be prepared to take partial profits
₹2,045 (R3 – Classic Pivot)
A stronger resistance zone; breaking it could signal fresh upside
🎯 Action Tips
Buying: Enter around ₹1,985, and add at ₹1,973 if dip deepens. Use ₹1,954 as a stop-loss trigger.
Selling (Profit Booking): Trim part of your position near ₹2,015, and more near ₹2,033–₹2,045 if momentum slows.
Breakout Strategy: A clean daily close above ₹2,045 with volume may trigger fresh upside moves.
Risk Control: If price dives below ₹1,954, re-evaluate—broader market risk may be rising.
🧠 Why These Levels Matter
Pivot levels are watched closely by traders and algorithms, making them natural turning points in daily price action
HDFC Bank’s technical signals are currently neutral to slightly bearish, making dip-buying near supports more advantageous than chasing highs .
✅ Final Word (Plain Language)
Look to buy dips in the ₹1,985–1,974 range with a tight stop below ₹1,954.
Take profits around ₹2,015 and ₹2,033–₹2,045 based on your risk appetite.
Watch closely above ₹2,045—that’s your breakout level for potential new highs
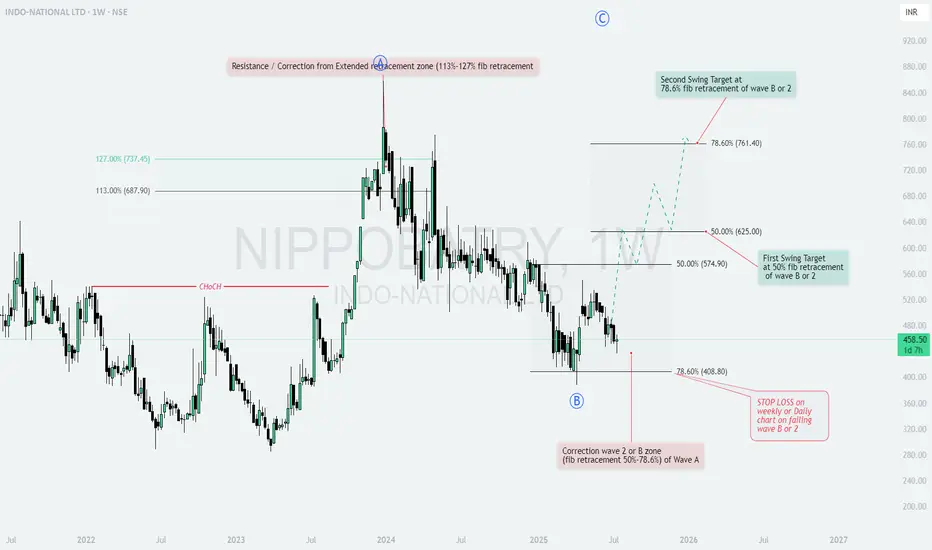
NIPPONIND : is correction over on Wave 2 or B?INDO-NATIONAL LTD (NSE: NIPPONIND) 🚀
Weekly Chart Analysis – Potential Swing Opportunity!
1. Structure & Setup
The stock has completed a major correction in the zone of 50%-78.6% Fibonacci retracement of Wave A (408.80–458.50).
Wave B or 2 seems to be in place, setting up for a potential bullish move.
Previous resistance and correction occurred from the extended retracement zone (113%-127% fib).
2. Key Levels & Targets
First Swing Target: 50% fib retracement of Wave B or 2 at ₹574.90–625.00 🥇
Second Swing Target: 78.6% fib retracement of Wave B or 2 at ₹761.40 🥈
Support: 78.6% fib retracement of Wave A at ₹408.80
3. Risk Management
STOP LOSS: On weekly or daily close below the correction zone (failing Wave B or 2), i.e., below ₹408.80 🚨
4. Observations & Strategy
1️⃣ Chances of a bullish reversal are high from the current zone, supported by fib retracement confluence.
2️⃣ Watch for a breakout above ₹500 for confirmation of momentum.
3️⃣ Risk/Reward is favorable for positional swing traders.
Summary:
A strong setup for a multi-month swing! Monitor price action near support and trail your stop as the move unfolds. 📈
Like & Follow for more setups! 👍✨
#NIPPONIND #SwingTrade #TechnicalAnalysis #Fibonacci #TradingView #Stocks #NSE
NAZARA TECHNOLOGIES LTD | Monthly Chart Breakout📊 NAZARA TECHNOLOGIES LTD (NSE: NAZARA) | Monthly Chart Breakout
📅 Date: June 1, 2025
📈 CMP: ₹1,295.10 (+28.04%)
📌 Ticker: NSE:NAZARA
📉 Chart Pattern Insight
🔥 Cup & Handle + Falling Wedge Breakout
Nazara Tech has broken out of a strong Cup & Handle pattern, reinforced by a Falling Wedge breakout — a powerful confluence suggesting a major trend reversal.
🎯 Breakout is confirmed with high volume and a clean monthly candle close above key resistances.
📐 Fibonacci Retracement Levels (From High ₹1678 to Low ₹477)
🔸 38.2% – ₹935.85 (was resistance, now flipped to support)
🔸 50% – ₹1,077.55
🔸 61.8% – ₹1,219.25 (just surpassed – strong bullish confirmation)
🧭 100% – ₹1,678 (All-Time High)
📊 Indicator: RSI + Moving Average Cross (Icon shown)
🔍 RSI is at 71.63 and rising sharply, indicating strong momentum
🔺 RSI crossover above MA confirms bullish strength and trend continuation
🧱 Volume Spike
📈 Volume this month is multi-month high, validating the breakout
🔑 Key Levels
Support: ₹935 (prior resistance, now retest zone)
Immediate Resistance: ₹1,300 (psychological), ₹1,400
Target Zones:
Short-Term: ₹1,450
Medium-Term: ₹1,600+
Long-Term: Retest of All-Time High ₹1,678+
🛡️ SL: ₹935 (monthly close basis)
📌 Trading Plan
Entry: Pullback near ₹1,220–₹1,250 or breakout retest
SL: ₹935 (below 38.2%)
Target: ₹1,450 / ₹1,600+
Time Frame: Positional – Multi-week to multi-month
⚠️ Disclaimer
This analysis is for educational purposes only. Please do your own research or consult a SEBI-registered advisor before investing.

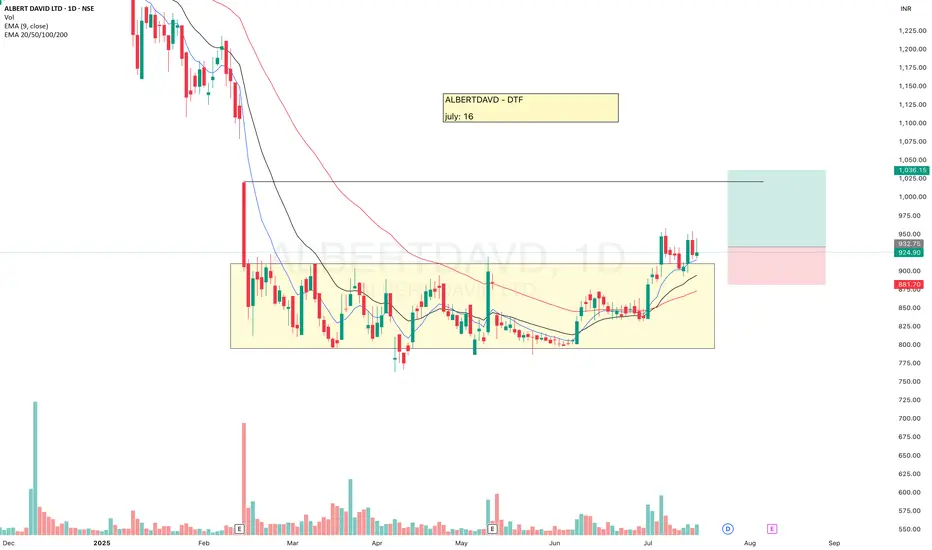
ALBERTDAVDAfter a long consolidation ALBERTDAVD has given breakout, now we may expect a good move from here.
Keep eyes on it.
✅ If you like my analysis, please follow me here as a token of appreciation :)
in.tradingview.com/u/SatpalS/
📌 For learning and educational purposes only, not a recommendation. Please consult your financial advisor before investing.
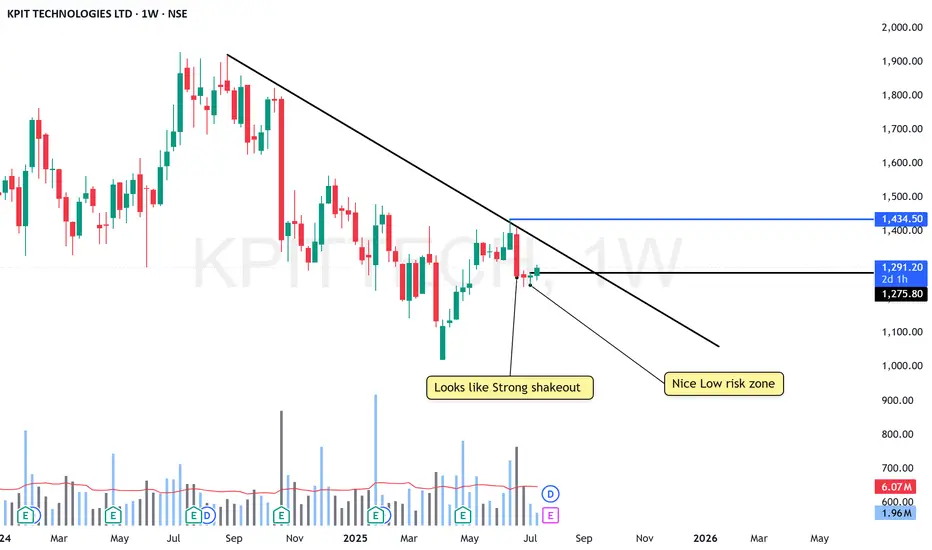
KPIT At low risk Zone - Getting ready to BlastNSE:KPITTECH
Its at Nice low risk Zone
KEEP IN MIND: The 6Rs Dividend Announced at QTR is on 28th JULY
Good to keep on the radar
Always respect SL & position sizing
========================
Trade Secrets By Pratik
========================
Disclaimer
NOT SEBI REGISTERED
This is our personal view and this analysis
is only for educational purposes
Please consult your advisor before
investing or trading
You are solely responsible for any decisions
you take on basis of our research.
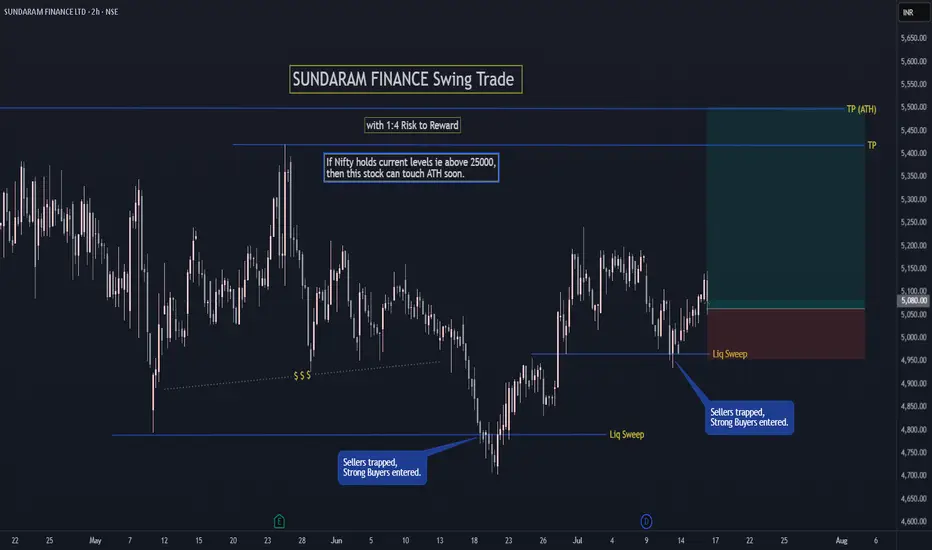
SUNDARAM FINANCE Swing TradeIf Nifty holds current levels ie above 25000,
then SUNDARAM FINANCE can touch ATH soon.
FOLLOW for more such simple swing setups.
Let me know in comments if you have any doubt or questions.
Swing trading opportunity with good risk : reward in GOKULAGROAgain coming up with swing trade idea. tight consolidation in range of 2-4% within last 5-6 days. Price is hovering around short term EMA. Looks like weak hands are exiting. Breaking above the pivot line could lead to significant push when crossing with good volume.
SL is somewhere around 3% (Refer the long position drawn over the chart).
One can invest 10% portfolio size as per following calculations
Position sizing and managing risk is the key.
Portfolio is: 1,00,000
Position size: 10,000
Risk 3%: 300. Which means only 0.3% of overall portfolio value is under risk.
Stay connected for commentary for coming days.
Disclaimer:
The information provided herein is for educational and informational purposes only and should not be construed as investment advice. The stock analysis and recommendations are based on publicly available information, data sources believed to be reliable, and our interpretation at the time of writing.
Investing in equities involves risks, including the risk of loss of capital. Past performance is not indicative of future results. Readers and investors are advised to conduct their own research or consult a qualified financial advisor before making any investment decisions.
The author(s), affiliates, or associated entities may hold positions in the stocks mentioned, and such positions are subject to change without notice.
We do not guarantee the accuracy, completeness, or timeliness of any information presented, and we disclaim any liability for financial losses or damages resulting from the use of this content.
