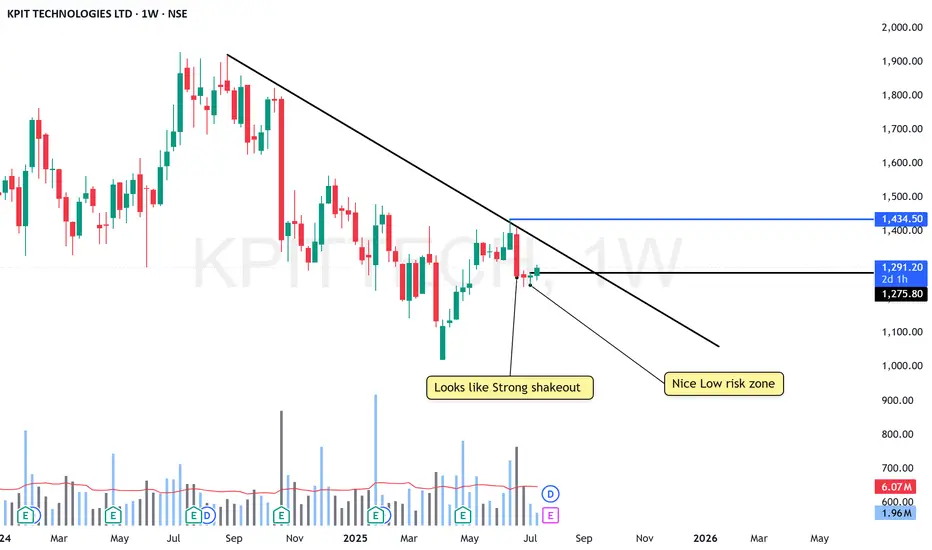
KPIT At low risk Zone - Getting ready to BlastNSE:KPITTECH
Its at Nice low risk Zone
KEEP IN MIND: The 6Rs Dividend Announced at QTR is on 28th JULY
Good to keep on the radar
Always respect SL & position sizing
========================
Trade Secrets By Pratik
========================
Disclaimer
NOT SEBI REGISTERED
This is our personal view and this analysis
is only for educational purposes
Please consult your advisor before
investing or trading
You are solely responsible for any decisions
you take on basis of our research.
Swingtrading
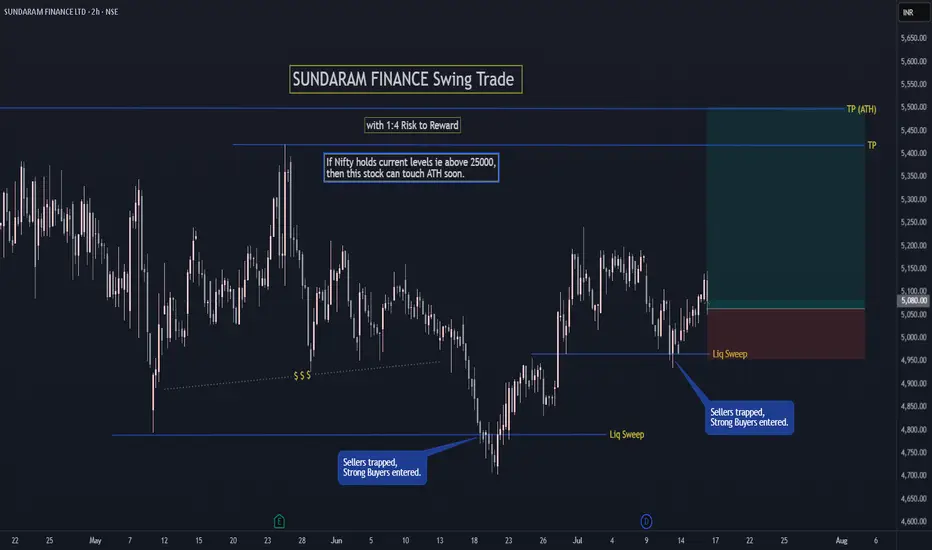
SUNDARAM FINANCE Swing TradeIf Nifty holds current levels ie above 25000,
then SUNDARAM FINANCE can touch ATH soon.
FOLLOW for more such simple swing setups.
Let me know in comments if you have any doubt or questions.
Swing trading opportunity with good risk : reward in GOKULAGROAgain coming up with swing trade idea. tight consolidation in range of 2-4% within last 5-6 days. Price is hovering around short term EMA. Looks like weak hands are exiting. Breaking above the pivot line could lead to significant push when crossing with good volume.
SL is somewhere around 3% (Refer the long position drawn over the chart).
One can invest 10% portfolio size as per following calculations
Position sizing and managing risk is the key.
Portfolio is: 1,00,000
Position size: 10,000
Risk 3%: 300. Which means only 0.3% of overall portfolio value is under risk.
Stay connected for commentary for coming days.
Disclaimer:
The information provided herein is for educational and informational purposes only and should not be construed as investment advice. The stock analysis and recommendations are based on publicly available information, data sources believed to be reliable, and our interpretation at the time of writing.
Investing in equities involves risks, including the risk of loss of capital. Past performance is not indicative of future results. Readers and investors are advised to conduct their own research or consult a qualified financial advisor before making any investment decisions.
The author(s), affiliates, or associated entities may hold positions in the stocks mentioned, and such positions are subject to change without notice.
We do not guarantee the accuracy, completeness, or timeliness of any information presented, and we disclaim any liability for financial losses or damages resulting from the use of this content.

Nifty 50 – Intraday Plan for July 16, 2025📊 Intraday Key Levels & Strategy:
🔺 Upside Zones (CE Bias):
25,270 – Above 10M hold = Positive Trade View
25,390 – Above 10m hold CE by entry level
25,478 – Above 10m closing = Shot Cover Level
⚠️ Neutral to Mixed Zones:
25,120 – Above Opening S1: 10m Hold CE Buy Level
25,100 – Below Opening R1: 10m Hold PE Buy Level
25,070 – Below 10M = Negative Trade View
🔻 Downside Zones (PE Bias):
24,990 – Below 10m hold PE by level
24,920 – Below 10m hold PE = Risky Zone
24,880 – Above 10M = CE Safe Zone
24,860 – BELOW 10M = UNWINDING zone.
✅ Suggested Intraday Plan:
Bullish Scenario (CE Trades):
Buy CE above 25,120 (Only if 10 min candle holds).
Add on breakout & hold above 25,270.
Target zone: 25,390–25,478.
SL: Below 25,070.
Bearish Scenario (PE Trades):
Sell/Buy PE below 25,100 (Only if 10 min candle sustains).
Confirm further weakness if below 24,990 or 24,920.
Target zone: 24,880–24,860.
SL: Above 25,120.

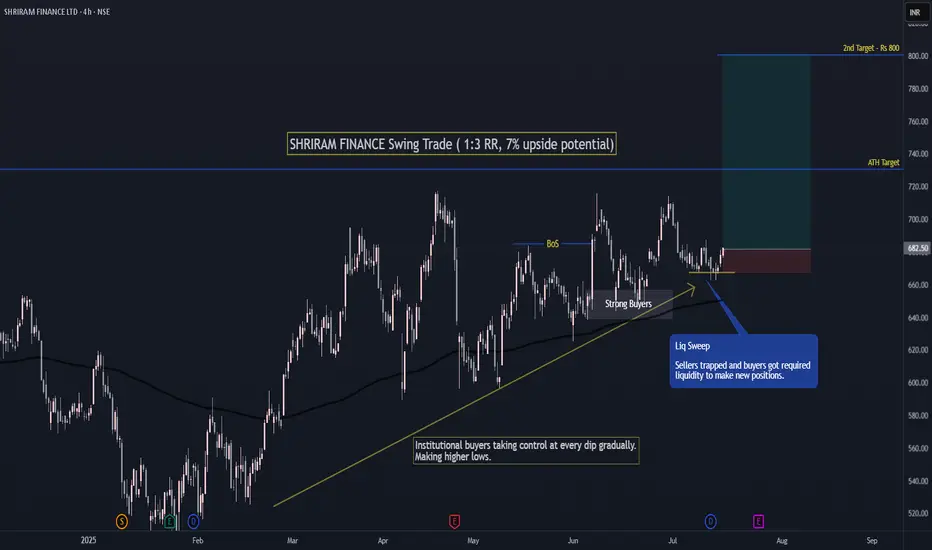
SHRIRAM FINANCE Swing Trade ( 1:3 RR, 7% upside potential)1st Target at ATH with 1:3 RR and 7% upside.
2nd Target at psychological level of 800.
If Nifty holds current level of 25000 then Shriram Finance can make a new ATH.
Institutions have gradually bought the stock at every dip making higher lows continuously.
Recently sellers got trapped which can start a new up-move.
Follow me for more such simple trades.
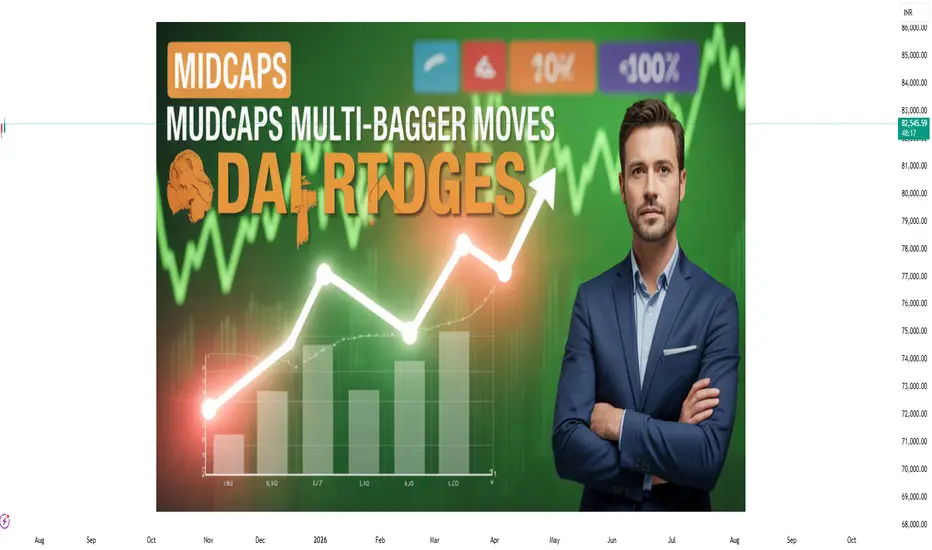
Midcaps & Smallcaps Giving Multi-Bagger Moves🔍 What’s Going On in the Market?
If you’ve been watching the Indian stock market lately, you’ve probably noticed a massive rally in midcap and smallcap stocks. Stocks that were quietly trading in the background are now suddenly up 50%, 100%, or even 200% within months. Investors who took early positions in these counters are sitting on multi-bagger returns — and everyone wants a piece of the action.
You may have heard of recent examples like:
Suzlon Energy – up over 200% in a year
JTL Infra – up 5x in 2 years
Taneja Aerospace, Tata Tele, Lloyds Metals, Zen Tech, and others doubling in months
So, what’s behind this mega rally?
Should you join now or stay cautious?
Let’s break it all down — without jargon, just real talk.
💼 First, What Are Midcaps and Smallcaps?
These terms refer to the market capitalization (total value of a company’s shares).
Category Market Cap (Approx) Example Stocks
Large Cap ₹50,000 Cr+ Reliance, HDFC Bank, Infosys
Mid Cap ₹10,000 Cr to ₹50,000 Cr Cummins India, PI Industries
Small Cap Below ₹10,000 Cr Suzlon, JTL Infra, RCF
📌 Multi-bagger = A stock that gives 2x, 5x, or 10x returns on your investment
🔥 Why Are Midcaps & Smallcaps Flying in 2025?
Let’s look at the real reasons behind this boom.
1. Strong Economic Growth
India is projected to grow over 7%+ GDP in FY26, highest among large economies.
Sectors like defence, infra, power, and manufacturing are booming — and many mid/smallcap companies are direct beneficiaries.
2. Government Push for Capex & Manufacturing
Schemes like PLI (Production Linked Incentive), ‘Make in India’, and massive infrastructure spending have boosted earnings for niche companies.
Railways, roads, power, and defence see record budget allocations.
3. Retail Participation at All-Time High
More retail investors are trading and investing via Zerodha, Groww, Upstox, etc.
They’re moving beyond large caps and discovering low-priced high-potential stocks.
4. FIIs & DIIs Entering Midcaps Again
Big institutions avoided smallcaps for years due to volatility.
Now, even they are entering quality midcaps, fueling fresh momentum.
5. Technical Breakouts & Volume Surge
Chart patterns (like cup & handle, breakouts) are visible on hundreds of smallcap charts.
Delivery volumes (not just intraday) are rising — a bullish sign.
📈 Real Examples: 2023–2025 Multi-Bagger Stories
🌀 Suzlon Energy
Old wind energy player that was almost bankrupt.
Made a comeback with debt restructuring + clean energy narrative.
Went from ₹5 to ₹40+ in 2 years = 700%+ returns
🛠️ JTL Infra
Steel tube manufacturer for infra and construction.
Strong earnings, high promoter holding, and exports rising.
Stock gave 5x return from 2022 to 2025.
💣 Taneja Aerospace
In the aerospace + defence theme, a lesser-known player.
Low float, strong niche, government defence deals.
Stock moved from ₹90 to ₹500+ in less than 18 months.
These are just a few names. There are dozens of smallcap stocks giving 50–200% returns within 6–12 months.
🧠 The Psychology Behind the Rally
Retail Investors: "Small stocks are cheaper, I can buy 1000 shares instead of 5 of Reliance!"
Traders: "Breakouts with volume? Let’s ride it!"
Institutions: "Let’s grab quality midcaps before they become large caps."
This creates a self-fulfilling cycle:
Rising prices → More buzz → More buyers → Higher prices
🧭 But Is It Safe to Enter Now?
This is where you need clarity and discipline. Not all smallcap stocks are worth buying. Some are quality businesses growing fast. Others are just hype, junk, or operator-driven.
Here’s how to approach the current market:
✅ Smart Strategy to Ride the Rally
1. Focus on Fundamentals First
Ask:
Is the company profitable?
Is debt under control?
Are revenues & profits growing YoY?
Is promoter holding strong?
If yes, it's worth tracking.
2. Use Technical Confirmation
Look for:
Breakouts with volume
Sustained uptrends
Support-retest-bounce zones
Avoid chasing gaps blindly!
3. Track Themes That Are in Focus
Current hot mid/smallcap themes in 2025:
Theme Stock Examples
Defence Zen Tech, BEL, Taneja
Railway Infra RVNL, IRFC, Titagarh
Green Energy Suzlon, IREDA, KPI Green
Capital Goods JTL Infra, KEI, KEC
Fertilizers/Chem RCF, NFL, Deepak Nitrite
These themes are backed by government policy + earnings visibility.
4. Avoid Pump & Dump
Stay away from low-volume, “Telegram tip” kind of stocks.
Check if delivery % is high — if not, it’s probably a trap.
💡 Quick Checklist Before Buying a Smallcap
Question Good Sign?
Promoter Holding > 50%? ✅ Yes
Debt-to-Equity < 1? ✅ Yes
Consistent Profit Growth? ✅ Yes
Trading Above 200 EMA? ✅ Yes
Mentioned in Annual Budget/Sector News? ✅ Yes
If 4–5 of these match, it’s worth researching deeper.
🧾 What to Avoid
Stocks with huge moves but no earnings to justify it
“Operator stocks” — low float, sudden spikes, suspicious circuits
Tips from WhatsApp/Telegram without any proof
Stocks hitting back-to-back upper circuits without volume
These often crash when the tide turns.
🛡️ Risk Management Matters More Than Ever
Midcaps and smallcaps are high-return, high-risk areas.
You must:
Never put more than 10–20% of your portfolio in smallcaps
Use a stop-loss for every trade
Book partial profits on every 20–30% move
Don’t marry any stock — even the good ones fall eventually
📊 Long-Term vs. Short-Term Approach
If You’re a Long-Term Investor:
Stick to quality smallcaps with strong business models.
SIP method works well during volatile phases.
Great time to build wealth if you stay patient.
If You’re a Swing Trader:
Use technical setups: cup & handle, breakouts, flag patterns.
Trade 2–4 week timeframes.
Use position sizing — don’t go all in on one stock.
🔮 Outlook for 2025–26
With elections approaching and strong GDP, midcaps/smallcaps may continue to lead.
But correction or volatility is expected — markets don’t rise in a straight line.
Use dips to add, avoid panic exits.
✍️ Final Words
The midcap and smallcap rally in 2025 is not just a bubble — it’s being driven by real growth, real earnings, and massive retail interest. However, not every rising stock is worth chasing. Be selective, research-driven, and disciplined.
“Everyone wants multi-baggers. But only the patient and the smart ones actually catch them.
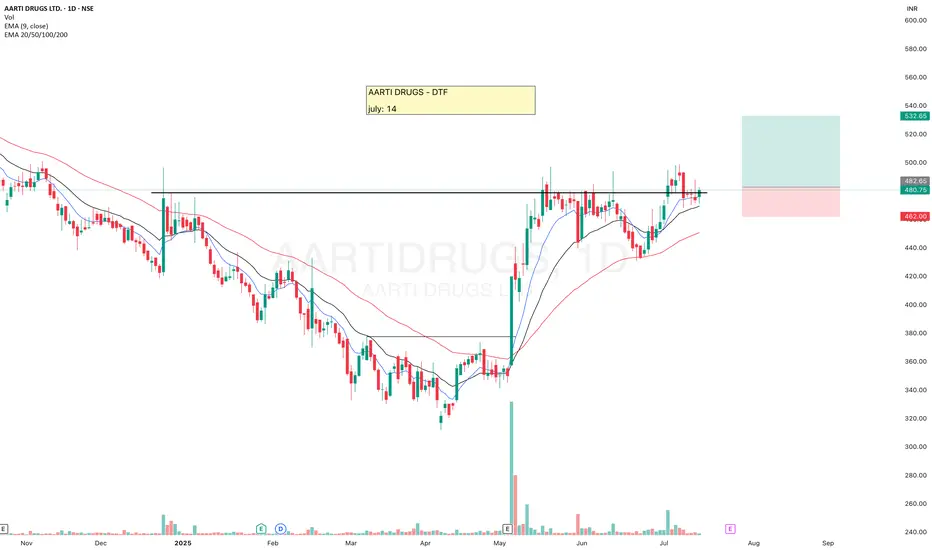
AARTIDRUGSAARTIDRUGS is crossing the resistance, moving above 9-20EMAs.
Now there is probability of an upside move, keep watching.
✅ If you like my analysis, please follow me as a token of appreciation :)
in.tradingview.com/u/SatpalS/
📌 For learning and educational purposes only, not a recommendation. Please consult your financial advisor before investing.
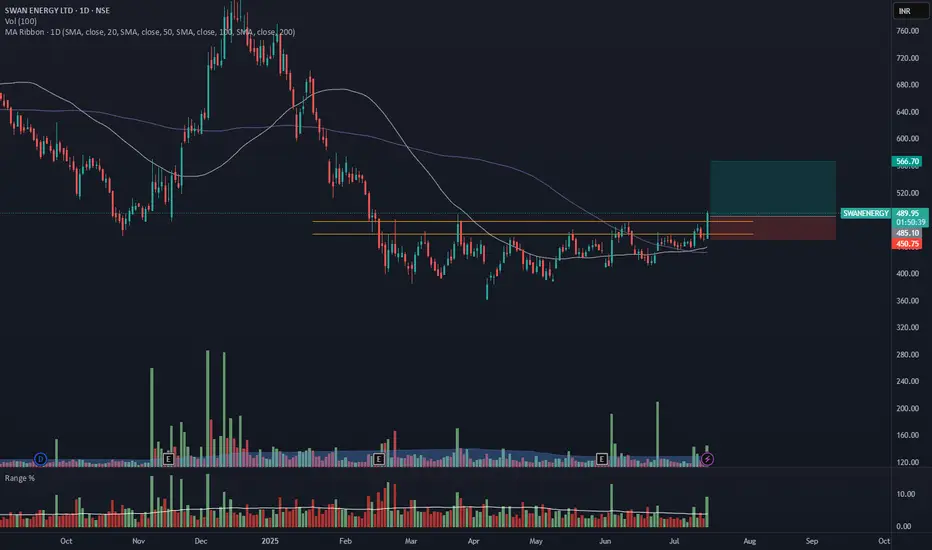
SWANENERGY - Daily Timeframe Breakout (Resistance Zone Break)SWAN ENERGY has shown a breakout above a key horizontal resistance level on the daily chart, accompanied by a nearly 2.5 times volume surge near the breakout zone, as seen earlier, supported by strong momentum.
🔍 Breakout Context:
- Price might break above the ~₹484 horizontal resistance, which had held for over 6 months.
The breakout zone has been supported by 2.5X volume and a range 3X of average near the resistance zone.
- The price is also trading above both the 50- and 100-day SMAs, indicating strong trend continuation.
- This aligns with a bullish continuation setup.
📉 Trade Plan:
- CMP: ₹485.2
- Entry: Near ₹484
- Target: ₹566 (~16.5% upside from CMP)
- Stop-Loss: ₹450
- Risk-Reward Ratio: ~ 1 : 2.3
📌 Note:
- Wait for the closing of this candle, enter the trade near 3:20 PM, or get confirmation on 75min/1Hr TF.
- Avoid chasing the extended move unless confident in intraday momentum.
⚠️ Disclaimer: This post is for educational purposes only and not financial advice. Always do your research or consult a financial advisor before trading.
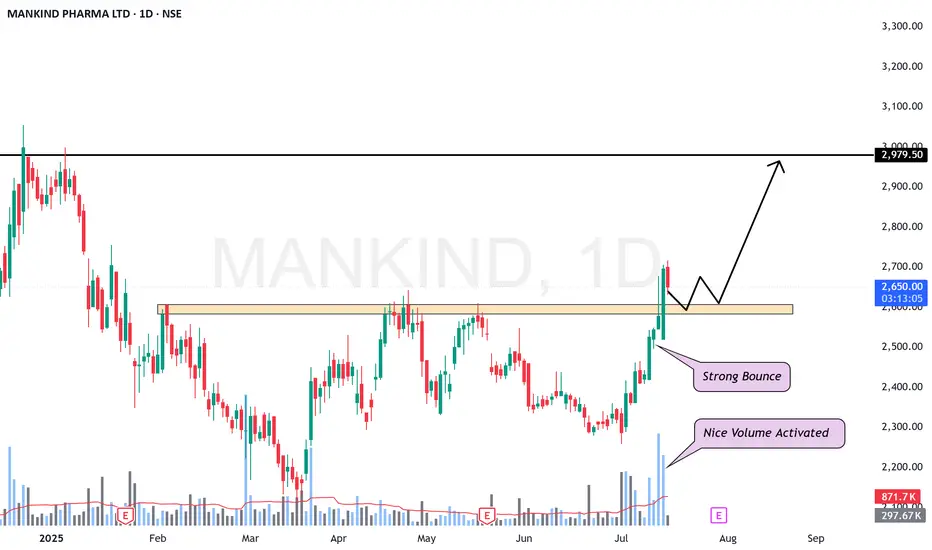
MANKIND Pharma Ready to blastNSE:MANKIND
Nice breakout, with volume surges.
Now trying to retest Support.
Good to keep on the radar
Always respect SL & position sizing
========================
Trade Secrets By Pratik
========================
Disclaimer
NOT SEBI REGISTERED
This is our personal view and this analysis
is only for educational purposes
Please consult your advisor before
investing or trading
You are solely responsible for any decisions
you take on basis of our research.
BAJAJ FINSERV Swing Trade ( 1:3 RR )If Nifty holds current levels ie. 25000, then Bajaj Finserv will continue its sideways-uptrend.
Sellers have recently got trapped by the buyers in the buying zone which can fuel next up-move.
With 1:3 RR, trade setup is simple and looks good if overall market is not bearish.
Thanks and let me know in comments if you have any questions.
Follow for more such simple swing trade setups.

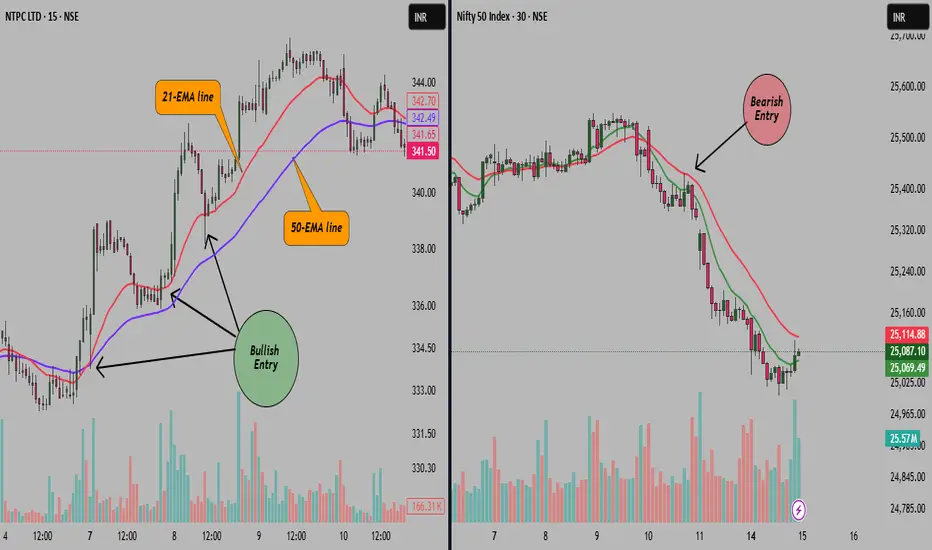
EMA Pullback Entry – The Cleanest Setup for Trend Followers!Hello Traders!
In today’s post, let’s explore one of the most reliable and beginner-friendly setups — the EMA Pullback Entry . If you’re a trend follower looking for clear, rule-based entries , this strategy will become a go-to in your toolkit. It helps you avoid chasing breakouts and instead ride strong trends with precision entries during pullbacks .
What is EMA Pullback Entry?
It’s a trend continuation strategy where traders use Exponential Moving Averages (EMAs) — typically the 21 EMA and 50 EMA — to identify the trend and wait for the price to retrace (pull back) into the moving average zone before continuing in the direction of the trend.
How to Trade the EMA Pullback Setup
Identify the Trend: Use a 21 EMA and 50 EMA on your chart. A bullish trend is confirmed when 21 EMA is above 50 EMA and price stays above both. Opposite for bearish.
Wait for a Pullback: Let the price retrace toward the EMAs without breaking below/above them significantly.
Look for Confirmation Candle: Wait for a bullish (or bearish) confirmation candle near EMAs — like a Pin Bar, Engulfing, or Doji rejection.
Entry & Stop Loss: Enter after confirmation. Place a stop-loss just below the pullback low (for long) or high (for short).
Target: Aim for previous swing high/low or use 1:2 risk-reward ratio.
Why It Works
Trend Is Your Friend: You’re trading with the trend, not against it.
Clear Visual Clarity: EMAs help you spot dynamic support/resistance zones.
Disciplined Entry: You wait for price to come to you, not chase it.
Rahul’s Tip
“The best trades often come to those who wait.” Don’t jump on every candle — let the price respect your EMAs, then strike.
Conclusion
The EMA Pullback Entry is a simple yet powerful setup that can give you high-probability trades in trending markets. Whether you trade intraday or swing, this strategy can help you time entries better and stay disciplined.
Have you tried this setup? Share your experience or ask questions in the comments – let’s grow together!
NATCOPHARMANATCOPHARMA gave BO of long time resistance, looking in a good position.
Now there is probability of an upside move.
✅ If you like my analysis, please follow me as a token of appreciation :)
in.tradingview.com/u/SatpalS/
📌 For learning and educational purposes only, not a recommendation. Please consult your financial advisor before investing.

Nifty 50 Intraday Trade Plan July 15, 2025🔴 Upper Resistance Levels:
25,430.00
🔺 Above 10m closing: Short Cover Level
🔻 Below 10m: Hold PE (Safe Zone)
25,280.00
🔺 Above 10m: Hold CE (Entry Level)
25,240.00
🔻 Below 10m: Hold PE (Risky Zone)
25,160.00
🔺 Above 10M: Hold Positive Trade View
🔻 Below 10M: Hold Negative Trade View
🟢 Current Zone:
Market is trading near 25,087.10
Watch levels:
25,030.00 – Above Opening S1: Hold CE by level
25,000.00 – Below Opening R1: Hold PE by level
🟠 Lower Support Levels:
24,960.00
🔺 Above 10m: Hold CE by level
24,920.00
🔻 Below 10m: Hold PE by level
24,800.00
🔺 Above 10M: Hold CE by Safe Zone
24,760.00
🔻 Below 10M: UNWINDING Level
🔍 Strategy Suggestions:
✅ Bullish Bias:
If price sustains above 25,160, consider Call Option Buy (CE) or bullish trades.
❌ Bearish Bias:
If price fails below 25,030 or 24,920, consider Put Option Buy (PE) or short positions.

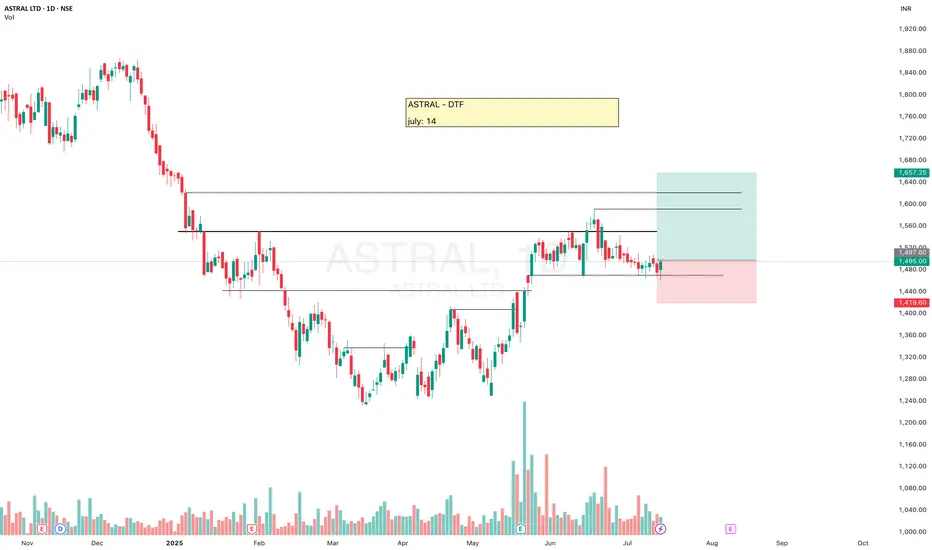
ASTRALASTRAL looks good, has been taking support near 1470 level - above 50ema, and today formed a Hammer candle. Now there is probability of it going up.
✅ If you like my analysis, please follow me as a token of appreciation :)
in.tradingview.com/u/SatpalS/
📌 For learning and educational purposes only, not a recommendation. Please consult your financial advisor before investing.
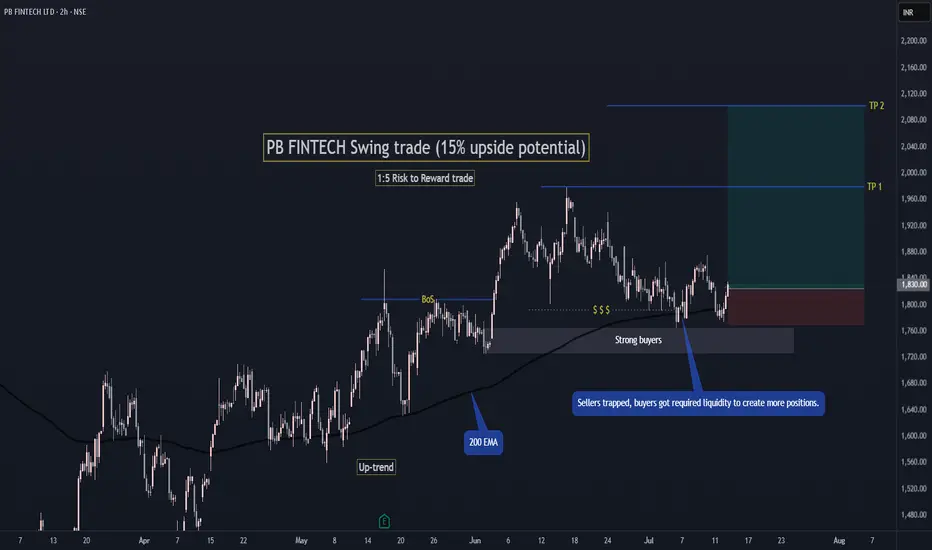
PB FINTECH Swing Trade (15% upside)If Nifty holds current levels ie. 25,000 then there are high chances that PB FINTECH will continue its uptrend and will make a new high.
Currently it is at a buying zone, you can make positions as per your risk.
Sellers are also trapped recently which can start next up-move.
With 1:5 RR and >15% upside potential.
Thanks and let me know if you have any questions regarding this setup in comments.
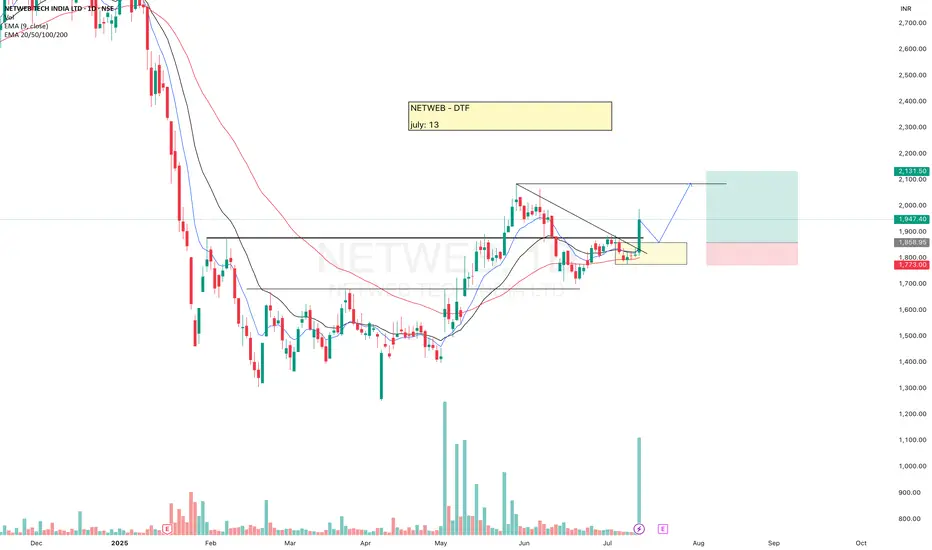
NETWEBNETWEB looks good, it already gave BO then re-tested it, now seems to be getting ready for another move.
Volume + Strong green candle, now need some retracement for entry.
Keep eyes on this.
✅ If you like my analysis, please follow me as a token of appreciation :)
in.tradingview.com/u/SatpalS/
📌 For learning and educational purposes only, not a recommendation. Please consult your financial advisor before investing.
Axis Bank Looking good on weekly chartNSE:AXISBANK
Expecting to form nice pattern of HnS in weekly chart.
Good to keep on the radar
Always respect SL & position sizing
========================
Trade Secrets By Pratik
========================
Disclaimer
NOT SEBI REGISTERED
This is our personal view and this analysis
is only for educational purposes
Please consult your advisor before
investing or trading
You are solely responsible for any decisions
you take on basis of our research.

Supply Zone Trading Explained from Scratch | Master it todayA complete beginner-to-pro guide on supply zones — learn why they matter, how to draw them, and how traders can use them for smart decisions.

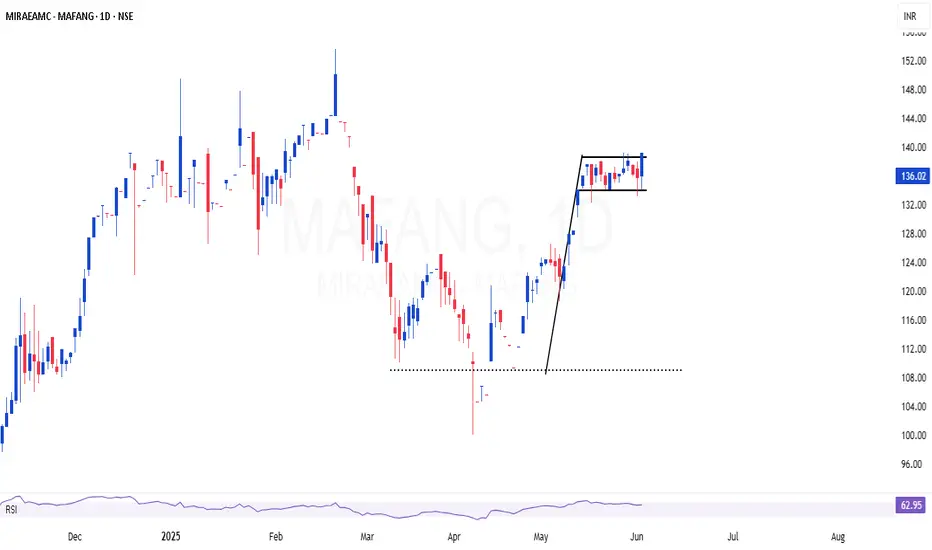
MAFANG | Excellent bull flag setup in top class index fundMAFANG 🏁| Strong buy in top class index fund 👌
-Strong uptrend supported by volume
-Consolidation near all-time highs — bullish structure
-Global tech dominance + AI tailwinds
MAFANG (Meta, Apple, Facebook, Amazon, Netflix, Google) is showing solid momentum and forming a strong technical base in a top-tier index fund.
SUPREME INDUSTRIESSUPREME INDUSTRIES seems to be ready.
Making HH-HL formation, breakout from here may give a good upside move.
✅ If you like my analysis, please follow me as a token of appreciation :)
in.tradingview.com/u/SatpalS/
📌 For learning and educational purposes only, not a recommendation. Please consult your financial advisor before investing.

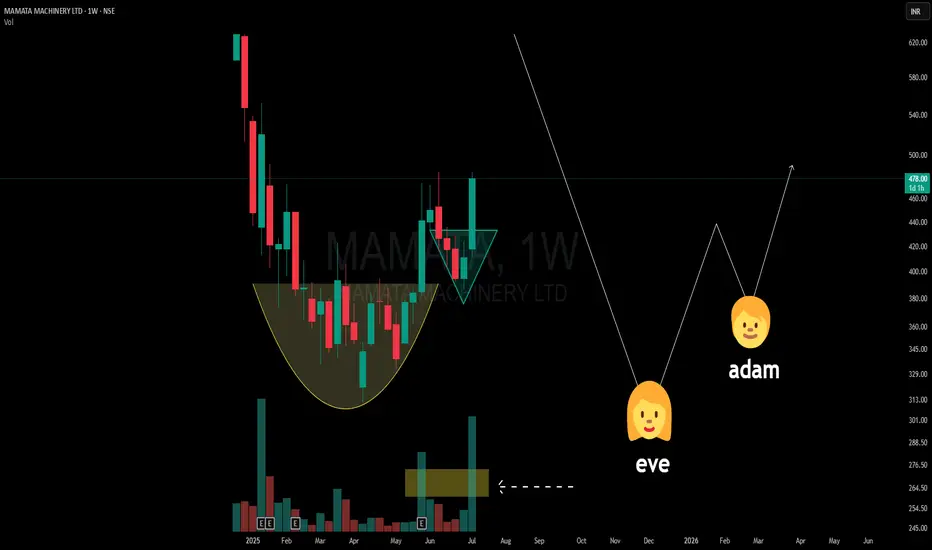
Eve-Adam Pattern Forming? A Rare Double Bottom Pattern Explained📉 Pattern Study (Not a Buy/Sell Tip/Not Forecasting anything)
On the weekly chart of Mamata Machinery Ltd, we’re potentially witnessing a classic yet uncommon pattern — the Eve-Adam Double Bottom.
🔍 What is the Eve-Adam pattern?
🧑🦰 Eve Bottom: Broad, rounded, and forms slowly with increased volume — showing gradual accumulation.
👦 Adam Bottom: Sharp, V-shaped recovery with relatively lower volume — a quick retest signaling renewed demand.
📈 What makes this setup notable?
-A clear Eve structure formed over several weeks.
-Volume started rising visibly into the breakout, especially during the right-side thrust.
-A possible Adam leg is being projected based on the symmetry of the pattern.
🟡 Additionally, a rounding base / cup-like structure preceded this, which may act as a broader accumulation phase.
🔄 This isn’t a forecast or trade call. It’s simply a chart observation intended for pattern study and educational analysis.
📚 Patterns like these are rare — but when supported by volume confirmation, they deserve attention from a learning standpoint.
PVR Channel Break out - Upside 5% Gain (short term)PVR INOX: Setting the Stage for a 5% Upside?
PVR INOX Ltd is showing signs of a potential breakout, with technical indicators aligning for a short-term upside of around 5%. On the hourly chart, the stock is consolidating above key EMAs (968–970 zone), forming a bullish structure supported by a rising trendline.
Current Price: ₹974.50
Upside Target: ₹1,020+
Indicators: EMA confluence, breakout from descending channel, volume uptick
Morning Doji Star - Bullish (Emerging) 1 day Time frame
What’s fueling the optimism?
- 🔥 Strong box office performance in early 2025, with collections up 39% YoY in Jan–Feb
- 🎟️ Highest-grossing February since COVID, led by hits like Chhaava
- 💼 Promoter stake increase and bullish brokerage calls (ICICI Securities sees up to 100% long-term upside)
With a robust content pipeline and improving fundamentals, PVR INOX might just be ready for its next act.

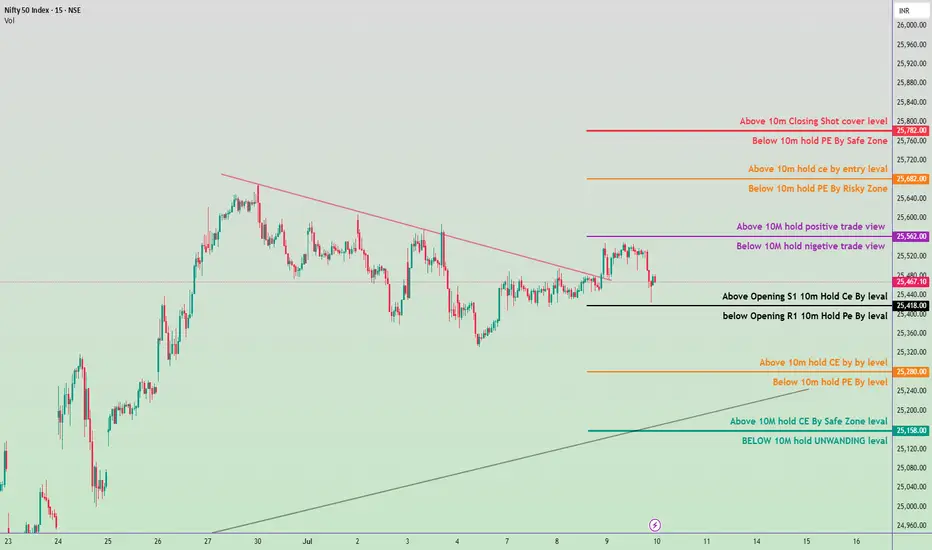
Nifty 50 Intraday Trade Plan 10 july 2025🟣 1. Trend Confirmation Zone (Level: 25,562.00)
Above 25,562.00 → Positive View Active
If Nifty sustains above this level for more than 10 minutes, it indicates bullish momentum. Call Option (CE) traders can stay in the trade or consider new entries.
Below 25,562.00 → Negative View Active
If Nifty stays below this level, bearish momentum is likely. Put Option (PE) trades are favorable.
⚫ 2. Opening Range Levels
Above 25,467.10 (Opening S1) → Hold CE (Call Option)
If the market holds above this after the opening 10-minute candle, you can go long (buy CE).
Below 25,418.00 (Opening R1) → Hold PE (Put Option)
If Nifty breaks this level on the downside, and sustains for 10 mins, it suggests weakness – PE trade is favorable.
🟠 3. Entry-Level Zone
Above 25,682.00 → Entry for CE (Call Option)
Bullish breakout level – good for fresh buying positions if sustained above.
Below 25,682.00 → Risky PE (Put Option) Zone
Aggressive traders may consider short trades, but this is a risky area.
🔴 4. Safe Zone for Positional Traders
Above 25,782.00 → Closing Shot / Cover Level
Indicates overbought or strong bullish continuation – exit PE positions if short.
Below 25,760.00 → Safe Zone for PE
A good place to hold PE (put) positions, as the market is weak below this.
🟠 5. Support Resistance Flip Zone
Above 25,280.00 → CE Hold Level
Support for intraday buyers. A bounce from here can give a CE opportunity.
Below 25,280.00 → PE Hold Level
Breaking this means more downside is likely – favorable for PE.
🟢 6. Strong Support / Breakdown Level
Above 25,158.00 → CE Safe Zone Level
Indicates strong buying support. If held, expect intraday recovery.
Below 25,158.00 → Unwinding Level
Panic selling or unwinding of long positions may start. Avoid CE, prefer PE.