Reading Price action and Candlesticks like a PROI make educational content videos for Trading
In this video I have used charts older than 3 months to share my experience in the markets by sharing my thinking and chart skills - I hope you will learn something out of it
Swingtrading

NIFTY – Bearish Structure Playing Out as AnticipatedIn my previous posts, I had clearly highlighted the possibility of a trend shift and warned that the ongoing price action could resolve to the downside. Over the last few sessions, price has started to play out exactly along those lines.
1. Bearish crossover (mini death cross)
A bearish crossover between the short-term and medium-term moving averages has now occurred. This was already anticipated and mentioned in earlier posts, and it marks a loss of bullish momentum after the ATH zone.
2. Clean breakdown below key support
Price has decisively broken below an important support and trendline structure. This confirms the bearish bias and strengthens the view that the broader market is under distribution rather than accumulation.
3. Next immediate support zone
The marked zone below acts as the next immediate support, where we may expect temporary consolidation or a technical bounce. However, unless there is strong follow-through buying, this should be treated cautiously.
4. Caution on bullish moves
Any signs of bullishness from here are likely to be temporary retracements, which may eventually trigger further sell-offs.
➡️ Avoid fresh swing longs until overall market sentiment turns favorable.
➡️ Existing positions should be managed with strict stop-losses and disciplined risk management.
The market is behaving in line with what was discussed earlier. Until structure changes and strength is proven, the risk remains on the downside. Patience and capital protection are more important than chasing trades in such phases.
📢📢📢
If my perspective changes or if I gather additional fundamental data that influences my views, I will provide updates accordingly.
Thank you for following along with this journey, and I remain committed to sharing insights and updates as my trading strategy evolves. As always, please feel free to reach out with any questions or comments.
Other posts related to this particular position and scrip, if any, will be attached underneath. Do check those out too.
Disclaimer : The analysis shared here is for informational purposes only and should not be considered as financial advice. Trading in all markets carries inherent risks, and past performance is not indicative of future results. It’s essential to conduct your own research and assess your risk tolerance before making any investment decisions. The views expressed in this analysis are solely mine. It’s important to note that I am not a SEBI registered analyst, so the analysis provided does not constitute formal investment advice under SEBI regulations.

Hidden Channels & Fib Golden Zone : Beauty of Price ActionObservational Post only Showcasing how price action works using historical price points only
Observe how price elegantly respects this counter trendline on the weekly chart (red line), forging consistent lower highs through precise rejections. A subtle parallel channel lurks beneath, acting as a hidden guardian. Channels like these shield against fakeouts, confirming pure breakouts only when breached alongside key lines.
Shifting to the monthly view, the Fib retracement from swing low to high highlights the golden zone (50 to 61%, white shaded), a magnet for retracements where price often pauses or reverses with stunning symmetry.
This interplay reveals price action's beauty: layers of structure working in harmony, rewarding patient observers.
Disclaimer: This is for educational purposes only, showcasing historical price action observations. Not financial advice. Always conduct your own analysis and manage risk appropriately.

BANK NIFTY - Technical Analysis Bank Nifty is showing an interesting setup on the weekly chart.
After breaking out above its previous all-time high, the index has started contracting in a tight range, indicating healthy consolidation.
On the daily timeframe, it continues to take support near the 9 EMA, and during minor dips, it has also reversed from the 20 EMA, reflecting strong buying interest.
If Bank Nifty breaks out of this range with momentum, the upside potential remains open, sky’s the limit.
In case of a pullback, watch these key support zones:
🟩 57,500 – first immediate support
🟩 57,160 – secondary support
🟩 56,600 – third support
🟩 56,000 – major support zone if deeper retracement occurs
Overall market structure is Bullish, and a bit more consolidation or a short pullback will only strengthen the base for a sustained breakout.
✅ If you like my analysis, please follow me here as a token of appreciation :)
in.tradingview.com/u/SatpalS/
📌 For learning and educational purposes only, not a recommendation. Please consult your financial advisor before investing.

HEGHEG - The structure remains bullish.
The stock recently broke above a year-long resistance around 617 and then pulled back for a healthy retest. It found support near the 550 zone and around the 50 EMA, followed by a clear reversal.
Price has also respected the 0.618 Fibonacci (golden ratio) level, which adds strength to the setup. A breakout from the current range could lead to a fresh upside move.
Keep it on your watchlist.
✅ If you like my analysis, please follow me here as a token of appreciation :)
in.tradingview.com/u/SatpalS/
📌 For learning and educational purposes only, not a recommendation. Please consult your financial advisor before investing.

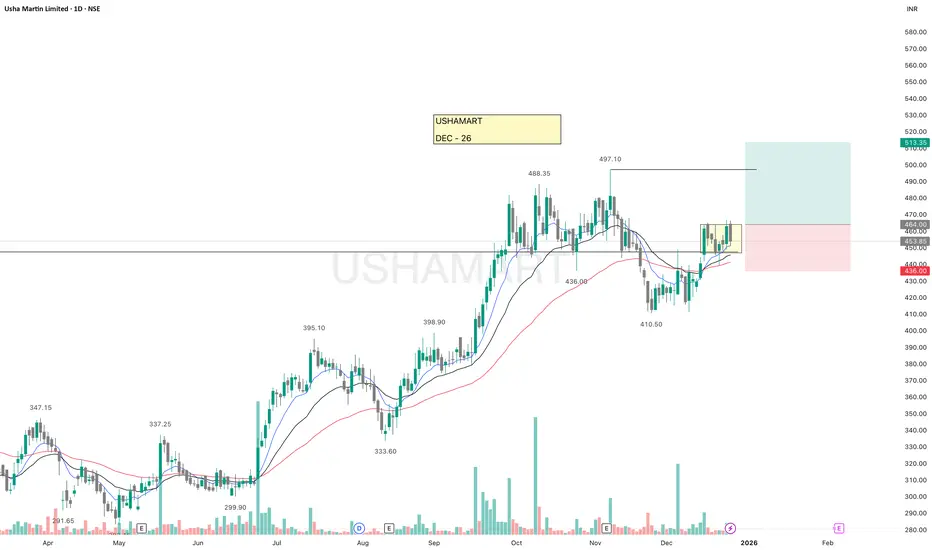
USHAMARTUSHAMART is looking good.
It recently broke above a key resistance and successfully retested the breakout zone. Since then, price has been consolidating in a tight range above all major EMAs and resistance, indicating strength.
The overall market structure remains bullish, suggesting a higher probability of further upside.
Keep this on your watchlist for paper trading and observation.
✅ If you like my analysis, please follow me here as a token of appreciation :)
in.tradingview.com/u/SatpalS/
📌 For learning and educational purposes only, not a recommendation. Please consult your financial advisor before investing.
L & T (Larsen & Toubro) – 4H | From Breakdown to Bounce?L & T has delivered a sharp corrective move from the upper supply zone, flushing out weak hands and reaching a well-defined higher-timeframe demand area. This zone previously acted as strong support and is now being retested under pressure.
The reaction from this area will decide the next big move.
🔹 Market Structure: Higher-timeframe uptrend intact
🔹 Current Phase: Deep pullback into demand
🔹 Key Zone: Marked support area (buyers’ battlefield)
🔹 Trade Idea: Long only if price holds and stabilizes
🔹 Invalidation: Clean break below demand
📌 What makes this interesting:
Strong uptrend before correction
Fast sell-off into support (possible exhaustion)
Defined risk with clear invalidation
Attractive reward if trend resumes
📈 A sustained hold above support can trigger a mean reversion move back towards the supply zone.
⚠️ Failure to hold support may open the door for deeper correction.
💡 Sometimes the best trades appear when fear is loud and risk is clear.

What is the Best Location / Area to Take a trade in the Markets I make educational content videos for trading
In this video I am sharing my experience on which areas are the best to trade with simple Price action using older than 3 months charts

BNBUSDT.P – 1D | High RR Trend-Continuation SetupBNB is forming a higher-low structure after a prolonged correction and is now reacting from a key demand / flip zone aligned with the ascending trendline. Price acceptance above this level can lead to a strong upside expansion.
🔹 Market: BNBUSDT Perpetual (Bitget)
🔹 Timeframe: 1 Day
🔹 Bias: Bullish continuation
🔹 Entry Zone: Demand / Structure support
🔹 Stop Loss: Below invalidation level
🔹 Targets:
TP1: Previous supply / range high
TP2: Major resistance zone
TP3: Higher-timeframe liquidity area
📌 Confluence Factors:
Higher-low market structure
Trendline support
Previous resistance turned support
Clean risk-to-reward profile
📈 As long as price respects the marked demand zone and holds the trendline, upside continuation remains favorable.
⚠️ A daily close below support invalidates the setup.
💡 Trade with strict risk management. This chart reflects technical analysis, not financial advice.

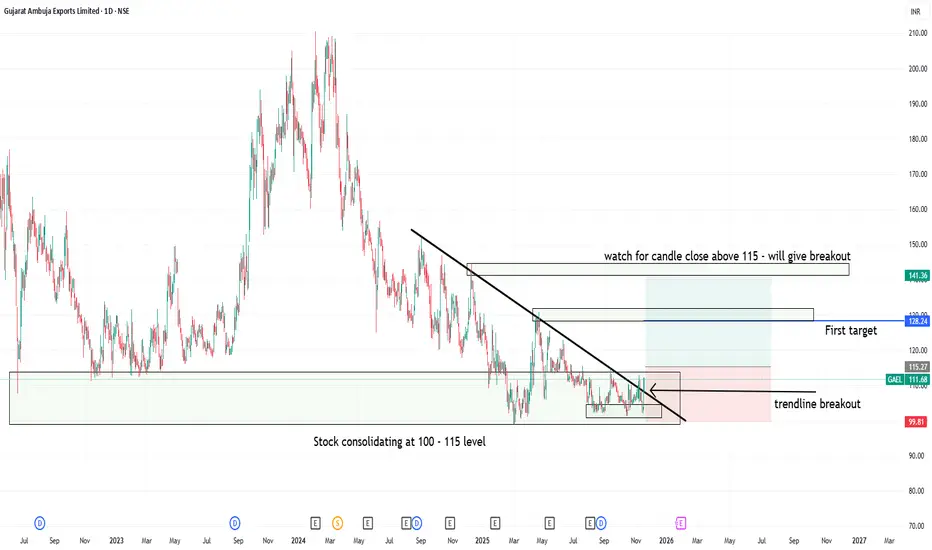
Trendline breakout at support level in GAEL1. Gujrat ambuja export lt- showing consolidation at 100 to 115 levels
2. Candle close above 115 can trigger consolidation breakout at strong support zone
3. Trendline breakout has already happend but above 115 close will be safe and logical
4. Good Risk:Reward one can watch for upside movement with strict sl level
MMTC: Looks Good For 30% Upside potential🚀 MMTC Ltd (NSE: MMTC): Bullion Surge Triggers Breakout Momentum
As of January 15, 2026, MMTC is showing strong technical momentum, surging over 12.6% in a single session to close at ₹71.58. The move is primarily fueled by a sharp rally in gold and silver prices, which directly impacts MMTC’s significant bullion trading operations.
🏦 Technical Snapshot (3D Chart Analysis)
Current Price: ₹71.58.
Breakout Zone: The stock has decisively cleared the ₹65.60 – ₹68.00 horizontal resistance with a massive volume spike.
Support: Immediate support now sits at the ₹65.00 level (the breakout neckline), with major trendline support near ₹55.00.
Resistance: The next significant hurdle is the psychological and historical supply zone at ₹85.00 – ₹88.00 (52-week high).
RSI: Currently at 60.96, signaling strong bullish momentum without being overbought.
💡 AI-Powered & Macro Insights
Bullion Correlation: MMTC's performance is currently detached from its internals and is tracking the bull run in precious metals. Silver hit a lifetime high of ₹2,86,790/kg this week, acting as a major tailwind.
Institutional Footprint: Trading volumes on Jan 14 were nearly 10.5x the 30-day average, indicating massive retail and potential early institutional participation.
Financial Growth: Q2 FY26 saw a significant 255% jump in net profit to ₹170.81 Cr, providing a fundamental backdrop to the current technical strength.
🎯 What I'm Watching
Sustenance above ₹70: A 3-day close above the ₹70 mark is critical for momentum acceleration toward the ₹80+ zone.
Volume Confirmation: Continued high delivery volume will confirm that this isn't just a speculative "gap-and-crap" move.
Bullion Prices: Any cooling off in global gold/silver prices will likely lead to a retest of the ₹65 support.
Risk/Reward: Favorable for swing traders while the stock holds above ₹70.00.
⚠️ Disclaimer: For educational purposes only. PSU stocks can be highly volatile. Please do your own research or consult a certified advisor before taking any positions. (#DYOR)

ASTRALASTRAL – Market structure remains bullish.
The stock has held above the previous low near 1348 and showed a clear reversal from the 1350 zone, maintaining a higher high–higher low structure since forming the bottom around 1260.
Price is currently trading above all key EMAs, indicating improving momentum and underlying strength. A breakout from the current consolidation zone could lead to a fresh upside move.
The next major resistance to watch is around 1590.
✅ If you like my analysis, please follow me here as a token of appreciation :)
in.tradingview.com/u/SatpalS/
📌 For learning and educational purposes only, not a recommendation. Please consult your financial advisor before investing.

INDIAN HOTELS (INDHOTEL) – Swing Trade SetupINDIAN HOTELS (INDHOTEL): CMP: 748.65; RSI: 51.47
✅ Trend: Strong Bullish (Weekly Golden Cross)
📐 Pattern: Flag consolidation → Breakout setup
🔔 Entry:
• Above ₹770 (weekly close / breakout confirmation)
⛔ Stop Loss:
• ₹700 (below flag support & recent swing low)
🎯 Targets:
• T1: ₹820–830 (partial profit)
• T2: ₹880–900 (flag pole projection / Wave-V zone)
📌 Risk–Reward: ~1:2.5 to 1:3
⚠️ Note:
• Enter only on breakout with volume
• Trail SL once T1 is achieved
📈 Trend is up. Consolidation is healthy. Breakout can lead to next expansion leg.
📌 Thanks a ton for checking out my idea! Hope it sparked some value for you.
🙏 Follow for more insights
👍 Boost if you found it helpful
✍️ Drop a comment with your thoughts below!

INDUSTOWERINDUSTOWER is showing a positive setup with an overall bullish structure. Price is trading above all key EMAs, and the stock has been in an uptrend for some time.
It recently broke above the 430 resistance and moved up to 454, but the move didn’t sustain, likely due to short-term profit booking. Importantly, the stock found support near the 9 EMA and managed to close back above 430, which is a constructive sign.
If it forms a strong green candle from here, the probability of a fresh upside move increases.
Keep it on your watchlist for paper trading.
✅ If you like my analysis, please follow me here as a token of appreciation :)
in.tradingview.com/u/SatpalS/
📌 For learning and educational purposes only, not a recommendation. Please consult your financial advisor before investing.

BALKRISIND | Support Trendline + Demand Zone ConfluenceDISCLAIMER: This is NOT a trade recommendation, but only my observation. Please do your own analysis before entering your trades.
Points to note:
------------------
1. A Support trendline of 3 years is being respected by price
2. There is tightness since Oct 2025, on the said trendline, indicating accumulation.
3. A Higher High, Higher Low formation is being seen.
------------------
Keeping in mind the above points, the following trade:
Entry CMP, SL 2220, TGT 2525, 2750

KIRLOSENGKIRLOSENG moved out of a nearly 6-month consolidation phase in November and began showing strength on the upside.
Recently, the stock broke above the resistance near 1185, followed by a healthy retest of that level, which is often seen in strong trends.
The overall market structure is bullish, with price trading above all key EMAs and consistently holding above the 20 EMA since 12th November.
If this structure sustains, the price action suggests the probability of further upside continuation.
This setup highlights the importance of structure, retest, and EMA alignment in trend-following trades.
Keep it in your watchlist.
✅ If you like my analysis, please follow me here as a token of appreciation :)
in.tradingview.com/u/SatpalS/
📌 For learning and educational purposes only, not a recommendation. Please consult your financial advisor before investing.

NIFTY : Bearish Territory - Caution AdvisedA potential bearish crossover between the 20-day and 50-day EMAs signals weakness. If this crossover confirms, deeper downside levels cannot be ruled out.
The market is currently about to test an important support zone. A decisive breakdown below this level could open the door for further selling pressure.
Any short-term bullish move should be approached with caution. These may not be true reversals but retracements within a broader downtrend, potentially leading to renewed sell-offs.
A sustainable bullish move can only be confirmed if:
The 20-day EMA moves above the 50-day EMA, and
Price breaks and closes above both EMAs with strong momentum
Until these conditions are met, it’s prudent to avoid fresh swing positions.
🔒 Risk Management First
For existing positions, maintain strict stop losses and manage risk proactively. Capital protection should remain the priority in such volatile conditions.
📌 Market is offering clarity — patience and discipline will be rewarded.
📢📢📢
If my perspective changes or if I gather additional fundamental data that influences my views, I will provide updates accordingly.
Thank you for following along with this journey, and I remain committed to sharing insights and updates as my trading strategy evolves. As always, please feel free to reach out with any questions or comments.
Other posts related to this particular position and scrip, if any, will be attached underneath. Do check those out too.
Disclaimer : The analysis shared here is for informational purposes only and should not be considered as financial advice. Trading in all markets carries inherent risks, and past performance is not indicative of future results. It’s essential to conduct your own research and assess your risk tolerance before making any investment decisions. The views expressed in this analysis are solely mine. It’s important to note that I am not a SEBI registered analyst, so the analysis provided does not constitute formal investment advice under SEBI regulations.

What exactly you have to do when the Markets are REDI make educational content videos for swing trading basis
Charts used are older than 3 months in this video

NIFTY : 50 D EMA Breach – A Key Level to Track📊 NIFTY – Technical View
• Nifty has closed below the 50-Day EMA, signalling short-term trend weakness.
• The previous 50 D EMA breach occurred around 25th September 2025.
• Notably, during that phase, the critical swing low formed just before the EMA breach was respected, acting as a strong base for the subsequent rally.
• A similar structure is visible now — the recent critical low before the current 50 D EMA breach becomes a key level to track.
• Price rejection near the upper channel / ATH zone highlights distribution at higher levels.
• As long as Nifty trades below the 50 D EMA, rallies are likely to face selling pressure.
I currently hold a position in NIFTYBEES. If the market fails to recover from current levels, there is a high probability that the stop-loss on this position may get triggered. I will continue to manage the trade strictly based on price action and risk parameters.
🧠 Market Character: Transitioning from buy-the-dip to selective, risk-managed trades.
⚠️ Focus: Protect capital, track the marked critical low, and stay reactive.
📢📢📢
If my perspective changes or if I gather additional fundamental data that influences my views, I will provide updates accordingly.
Thank you for following along with this journey, and I remain committed to sharing insights and updates as my trading strategy evolves. As always, please feel free to reach out with any questions or comments.
Other posts related to this particular position and scrip, if any, will be attached underneath. Do check those out too.
Disclaimer : The analysis shared here is for informational purposes only and should not be considered as financial advice. Trading in all markets carries inherent risks, and past performance is not indicative of future results. It’s essential to conduct your own research and assess your risk tolerance before making any investment decisions. The views expressed in this analysis are solely mine. It’s important to note that I am not a SEBI registered analyst, so the analysis provided does not constitute formal investment advice under SEBI regulations.

Northern Arc Capital | Daily Chart | Consolidation Price is consolidating between ₹250–270 after a strong recovery, indicating absorption near resistance rather than weakness.
🔹 Resistance: ₹270–275
🔹 Support: ₹250–255
🔹 Structure: Falling channel / flag after upmove
🔹 EMA Zone: Price holding near EMAs → volatility compression
👉 Sustained breakout above ₹275 with volume can trigger the next leg towards ₹300+.
👉 Breakdown below ₹245 will weaken the bullish structure.

NIFTY 2Hr ChannelNSE:NIFTY
NIFTY 50 – 2H Structure Update
Nifty is trading within a well-defined rising channel, indicating an intact medium-term bullish structure.
Price has taken support from the demand zone (blue zone) and bounced strongly, confirming buyers’ presence at lower levels.
Currently, price is consolidating above the previous breakout zone (~26,100), which now acts as an important support.
As long as this support holds, the higher-high higher-low structure remains valid.
🔹 Immediate Support: 26,100–26,000
🔹 Resistance / Supply: Near upper channel zone
🔹 Trend Bias: Buy on dips while above demand
🔹 Risk Area: Sustained breakdown below the blue zone can invite deeper retracement
Market is in a healthy pause after a sharp rally, not weakness.
Patience and level-based trading is the key here.
==============
⚠️ Disclaimer:
==============
This content is shared strictly for educational and informational purposes.
We are not SEBI-registered investment advisors or analysts.
The views expressed are personal opinions, based on publicly available data and market observations.
Please consult a SEBI-registered investment advisor before taking any investment or trading decisions.
Any actions taken based on this content are entirely at your own risk and responsibility.
========================
Trade Secrets By Pratik
========================

SRF LTD: Price Compression at Key Resistance|Clean Breakout Play📌 Structure: Daily Timeframe
SRF has been consolidating inside a clean descending channel, printing lower highs while demand holds near the channel base.
Price is now pressing against well-tested channel resistance — a clear decision zone.
🔴 Key Reads
Descending resistance respected multiple times
Tight price compression near supply → volatility contraction
Buying interest visible near demand
Muted volume during consolidation → pre-expansion behaviour
This is structure-led, not momentum-driven.
🟢 Breakout Rules (Strict)
Trade triggers only if:
Strong green Marubozu / near-Marubozu
Daily close above descending resistance
Clear volume expansion
No close above resistance = no trade.
🎯 Trade Plan
Entry: Breakout close
SL: Low of breakout candle
Target 1: ₹3300, then trail
Management: Trail via higher lows / structure
Defined risk. Reward from range expansion, not prediction.
🧠 Why It Works
- Long consolidation builds energy
- Repeated rejections weaken supply
- Channel breakouts often expand fast
Clean price + volume = institutional participation
⚠️ Invalidation
Weak breakout
Low volume
Rejection wick with close back inside channel
→ No trade
📊 Final Word
SRF is coiled, not weak.
Patience first. Execution only on confirmation.
➡️ Let price prove strength. 👍 Appreciate if this helps.
⚠️ Disclaimer
This is a technical study for educational purposes only, based purely on price action and volume.
Not financial advice. Please manage risk as per your own trading plan.
🔔 Follow
If you like clean, no-indicator, price–volume based setups,👉 Follow for more structure-led trade ideas and chart studies.
💬 Your Turn
Have a stock you want analysed using pure price action & volume?
Drop the name in the comments — I’ll pick a few and share clean charts.

Buy APL Apollo TubesShort Term Trading Advice by Goodluck Capital
Buy APL Apollo Tubes
● Buy Range- 1940 - 1960
● Target- 2060 - 2080
● StopLoss- below 1890
● Upside Potential- 6% -7%
● Approx trade duration 12 - 14 days
