Mastering Market Structure: The Perfect Swing Trade SetupUnderstanding actionable areas is the key to profitable trades. This chart shows how to identify a strong zone and apply your setup at the right time rather than chasing trades blindly.
A Resistance Identified: A breakout attempt, but this is a strong resistance.
B Breakout Confirmed & Sustained: The price successfully sustains above the resistance.
C Reversal Signal: The price starts falling, hinting at a correction.
D Breakdown or Fake Breakdown? The whole level is broken, but this could be a trap.
E Regaining the Zone: The price reclaims the level, signaling a potential high-probability trade setup.
The Strategy?
A failed breakout followed by a sustained breakout.
A retest of the support zone and a breakdown.
A strong comeback reclaiming the level, making it a perfect swing/positional trade opportunity IF your setup aligns.
🔥 Actionable Insight: Don't just enter at any breakout or breakdown—wait for confirmation in key zones. If your setup matches, this is where the best trades happen!
Swingtrading

Senores Pharma: Cup & Handle - Ready for Some Action?NSE:SENORES
Senores Pharma is forming a potential cup and handle on the daily timeframe. A breakout attempt on Feb 6, 2025, failed to sustain above ₹607.35 as selling pressure came in second half.
Now, the cup and handle pattern is progressing, making next week crucial. A close above ₹607.35 is the key level to watch for confirmation.
Volumes are rising, with today's volume (Feb 21, 2025) nearly 5x yesterday's. The stock's resilience despite market pressure indicates strength.
Cup and Handle pattern usually don't disappoint so would be interesting to watch.
Senores Pharmaceuticals is a research-driven company focused on developing specialty pharmaceutical products for regulated markets. The company has shown impressive financial performance:
Recent Financials (Q3 FY25):
Net Sales: ₹106.4 crore (up 35% YoY from ₹78.7 crore in Q3 FY24)
QoQ Performance: Increased from ₹104.4 crore in Q2 FY25 (up 1.92%)
EBITDA: ₹29.1 crore (up 92% YoY)
PAT: ₹17.2 crore (up 142% YoY from ₹7.1 crore in Q3 FY24)
9MFY25 Performance:
Total Revenue: ₹288.1 crore (up 157% YoY from ₹112.1 crore in 9MFY24)
PAT: ₹40.7 crore (up 162% YoY)
Market Position : The stock has outperformed its sector and the broader Sensex, achieving consecutive gains over the past month and trading above multiple moving averages.
Future Projections : Management anticipates a top-line growth of 50%-60% for FY26, with plans to launch five new products in the current quarter.
Strategic Focus : Continued investment in R&D and infrastructure development is expected to enhance manufacturing capabilities and expand product offerings.

Amazing swing trading idea in UPLI daily make educational content videos for swing / positional trading

MAHARASTRA SEAML - Aggressive Reversal Bet!Price Analysis & Overview:
1. EMA support taken.
2. Strong Fib support zone.
3. Blast above 900
4. 100%+ Potential
5. Need good volumes
6. Entry above 710 post confirmations
7. Strong buying candle formation is needed.
- Stay tuned for further insights, updates and trade safely!
- These are my personal views.
- If you liked the analysis, don't forget to leave a comment and boost the post. Happy trading!
Disclaimer: This is NOT a buy/sell recommendation. This post is meant for learning purposes only. Please, do your due diligence before investing.
Thanks & Regards,
Anubrata Ray

How to Trade Parallel Channels Like a Pro | Intra & Swing TradesLearn how to trade parallel channels effectively in this detailed breakdown. I cover two types of parallel channels:
Up trending Parallel Channel – Enter at higher lows for a long position.
Downtrending Parallel Channel – Short at lower highs for intraday trades or wait for a breakout at resistance for swing/positional trades.
Master risk-reward strategies and improve your trade setups today!

"Crucial Neckline Breakout Ahead for Ashiana Housing LtdHello everyone, today i have brough a news base trade setup of Ashiana Housing Ltd. and it is showing an exciting setup on the charts as it approaches a neckline breakout level at ₹368. This is a critical resistance zone, and if the stock sustains above this level, it could mark the beginning of a strong upward move.
Here’s why this is interesting:
Technical Setup: After a period of consolidation, the stock is attempting to break out of a well-defined neckline. This kind of breakout often signals the start of a new trend.
Volume is Key: A breakout supported by higher volumes would confirm strong buying interest, which is exactly what traders want to see.
Recent News Adds to the Momentum:
Ashiana Housing recently launched the final phase of its luxury residential project, Ashiana Ekansh, in Jaipur's Mansarovar Extension. This has been well-received and could boost the company’s fundamentals.
While the stock faced some selling pressure recently, the current setup indicates the potential for a turnaround.
Key Levels to Watch:
Entry Point: ₹368 – Breakout confirmation is crucial.
Stop Loss: ₹344 – To manage risk effectively.
Targets:
1st Target: ₹413
2nd Target: ₹438
3rd Target: ₹468
Why This Matters:
A breakout from this level could provide a solid risk-reward opportunity for traders. However, patience is key – wait for confirmation before jumping in. Also, keep an eye on the broader market sentiment and any updates related to the company.
Final Thought:
Ashiana Housing is at a pivotal point. If the breakout happens, this could be an exciting ride to the targets. Stay alert, manage your risks, and let the market guide you.
Disclaimer:- Please always do your own analysis or consult with your financial advisor before taking any kind of trades.
If you found this analysis insightful, don’t forget to hit like and follow for more such content!
For related trading ideas and educational posts, check out our profile TraderRahulPal Let’s learn and grow together!

"Budget 2025: Don’t Miss This High-Potential Railway Stock!"Hello Everyone, I hope you all are doing great! Today, I’ve brought you a stock that’s catching my attention both technically and fundamentally . This setup looks solid for short-term opportunities and has the potential to deliver significant gains over the long term as well. Stock name is RVNL and it is trading in a Descending Channel Pattern , and the price is currently near a critical support zone around 395-415 . This level is supported by a Bullish Harami candlestick pattern , which is a strong reversal signal. Additionally, the previous resistance zone has turned into support , adding credibility to the bullish outlook.
Last breakout above 355 resulted in an 83% rally to 647. If history repeats, a breakout above 510 could trigger a similar 83% move, targeting 947 in the long term. This aligns with strong fundamentals and Budget 2025’s expected focus on infrastructure spending.
Volume and Indicators:- Significant volume spikes at the support zone indicate institutional buying interest , which adds strength to the current level.
MACD is in the negative zone but showing signs of flattening, which could indicate a potential momentum reversal.
Fundamental Catalyst:- RVNL holds a pivotal role in transforming India's railway infrastructure , making it a prime beneficiary of Budget 2025 . The government ’s focus on infrastructure spending is likely to act as a positive catalyst, supporting the stock’s long-term growth potential.
Conclusion:- A breakout above 510 could unlock significant upside potential, aligning with both technical and fundamental perspectives. Traders should watch for a sustained move above 510 for confirmation of bullish momentum.
Disclaimer:- This analysis is for educational purposes only. Please trade responsibly and consult a financial advisor before making any decisions.
If you found this analysis helpful, don’t forget to like, follow, and share your thoughts in the comments below! Your support keeps me motivated to share more insights. Let’s grow and learn together—happy trading!

LODHA: Chart and Fundamentals Align for a Promising MoveHello everyone, Happy Republic Day to all my followers, I hope you all will be doing good in your life and your trading as well. Today i have brought a stock which name is Macrotech Developers (LODHA) and it has delivered an exceptional quarterly performance, reflecting robust financial strength and promising growth. Here’s the detailed breakdown:
Quarterly Financial Highlights
Revenue from Operations: 4083 crore, a substantial rise compared to 2931 crore in the same quarter last year.
Net Profit: 944.8 crore, showing strong growth compared to 505.2 crore in Q3 FY24.
EBITDA Margins: Improved significantly, showcasing efficiency in operations.
Pre-sales: 2570 crore for the quarter, with collections reaching 2280 crore.
Net Debt: Reduced to 6240 crore, highlighting financial discipline and a stronger balance sheet.
Technical Analysis
Strong Support Zone: The price has bounced from the ₹1125-1075 support zone, a proven demand area.
Morning Star Pattern: A bullish candlestick pattern near the support zone signals a potential reversal.
Oversold RSI: RSI recently dipped into the oversold region, further indicating a likely bullish move.
Falling Resistance Trendline: The stock is nearing a critical resistance trendline. A breakout above this level could confirm upward momentum.
With a strong financial performance in Q3 FY25, including a sharp rise in revenue and net profit, coupled with a favorable technical setup, LODHA looks promising for swing traders. Watch for a breakout above the falling resistance trendline for further confirmation.
Disclaimer:- This analysis is for educational purposes only. Please trade responsibly and consult a financial advisor before making any decisions.
If you found this analysis helpful, don’t forget to like, follow, and share your thoughts in the comments below! Your support keeps me motivated to share more insights. Let’s grow and learn together—happy trading!

Polycab India Ltd – A Strong Technical and Fundamental Setup!Hello Everyone, i hope you all will be doing good in your life and your trading as well. Today i have brough a stock which name is Polycab India Ltd and it is currently testing a crucial support zone after a sharp correction. The previous resistance has turned into support, and a Morning Star candlestick pattern is forming, indicating a potential reversal. This setup aligns well with the stock’s long-term growth story.
From a technical perspective, a breakout from this support zone could lead to strong upside momentum. The entry zone is 5850-5750, with targets at 6333, 6955, and 7550, while a stop-loss at 5450 ensures risk management.
On the fundamental side, Polycab remains a market leader in the wires & cables industry, backed by strong revenue growth, profitability, and a solid order book. With the government's focus on electrification and infrastructure development, the stock has promising long-term potential.
Fundamental Ratio:
Market Cap
₹ 87,699 Cr.
Current Price
₹ 5,830
High / Low
₹ 7,607 / 4,236
Stock P/E
47.7
Book Value
₹ 571
Dividend Yield
0.51 %
ROCE
31.3 %
ROE
23.2 %
Face Value
₹ 10.0
Industry PE
31.9
Debt
₹ 193 Cr.
EPS
₹ 122
Promoter holding
63.0 %
Intrinsic Value
₹ 2,329
Return over 5years
43.3 %
Debt to equity
0.02
Net profit
₹ 1,865 Cr.
Disclaimer:- This analysis is for educational purposes only. Please trade responsibly and consult a financial advisor before making any decisions.
If you found this analysis helpful, don’t forget to like, follow, and share your thoughts in the comments below! Your support keeps me motivated to share more insights. Let’s grow and learn together—happy trading!

Bharti Airtel – Strong Setup for Short-Term & Positional HoldingHello everyone! Hope you're all doing great in life and in trading. Today, I bring you a stock that has not only given a strong breakout but also delivered exceptional Q3 FY25 results stock name is Bharti Airtel Ltd. and it is the world’s leading providers of telecommunication services with presence in 18 countries representing India, SriLanka, 14 countries in Africa.
After breaking out of a descending trendline , Bharti Airtel is now retesting the 1630-1600 support zone . If this level holds, we could see a strong upside move in the coming sessions. The technical structure remains bullish, with an entry zone between 1630-1600 , and targets at 1688, 1736, and 1778 , while the final positional target is set at 1955 . For risk management, a short-term stop loss at 1570 and a positional stop loss at 1520 should be considered. RSI is showing strong momentum , and volume confirmation on the breakout strengthens the bullish case
.
Latest Q3 FY25 results highlight consistent revenue and profit growth . The company’s standalone revenue surged 19.1 percent YoY to 45,129 crore , with its India business growing 24.6 percent YoY . ARPU has increased to 245 , boosting overall profitability. EBITDA came in at 24,880 crore , with a 55.1 percent margin , showing strong operational efficiency. On the expansion front, 5G rollout is progressing aggressively, with 5.2K new towers added , and the subscriber base has grown by 25.2 million users . Additionally, Bharti Airtel has significantly improved its financial position, having prepaid 36,263 crore in spectrum dues , further strengthening its balance sheet.
Market Cap
₹ 9,70,118 Cr.
Current Price
₹ 1,620
High / Low
₹ 1,779 / 1,098
Stock P/E
48.5
Book Value
₹ 153
Dividend Yield
0.49 %
ROCE
13.1 %
ROE
14.9 %
Face Value
₹ 5.00
Industry PE
40.9
Debt
₹ 2,25,541 Cr.
EPS
₹ 43.2
Promoter holding
53.1 %
Intrinsic Value
₹ 421
Return over 5years
25.1 %
Debt to equity
2.59
Net profit
₹ 27,074 Cr.
Disclaimer:- This analysis is for educational purposes only. Please trade responsibly and consult a financial advisor before making any decisions.
If you found this analysis helpful, don’t forget to like, follow, and share your thoughts in the comments below! Your support keeps me motivated to share more insights. Let’s grow and learn together—happy trading!

Aarti Pharmalabs | Rectangle Pattern Breakout | Big Upside AheadHello everyone! I hope you all are doing great. 😊 Today, I’ve got something interesting for you – a solid breakout in Aarti Pharmalabs! After months of going sideways, Aarti Pharmalabs has finally woken up! The stock was stuck between 555 (support) and 695 (resistance) for a long time, but now, the bulls have taken control and pushed it past this critical resistance zone.
Here’s what’s happening:
The price tested 695 multiple times but kept getting rejected. This time, it broke out with strong volume , showing that buyers mean business. This could be the beginning of a strong uptrend!
Key Levels to Watch:
🔹 Short-Term Target: 815
🔹 Final Target: 895
🔹 Best Entry Zone: 750-715 (if we get a pullback, it’s a golden chance!)
🔹 Stop Loss: 670 (always manage risk!)
Fundamental View:
Aarti Pharmalabs is growing steadily, expanding into regulated markets , and benefiting from increasing demand for specialty chemicals . The sector looks strong, but risks like raw material costs and regulatory challenges remain. Despite that, the stock is still at a reasonable valuation and has room for further upside.
What’s Next?
As long as the breakout holds above 695 , the bullish momentum should continue. If we see a retest of the breakout zone, it could be a great entry point before the next rally.
What do you think? Will Aarti Pharmalabs hit 895 soon? Drop your thoughts in the comments!
Disclaimer: This analysis is for educational purposes only . Please trade responsibly and consult a financial advisor before making any decisions.
If you found this analysis helpful, don’t forget to like, follow, and share your thoughts in the comments below! Your support keeps me motivated to share more insights. Let’s grow and learn together— happy trading!

Identical patterns in Godfrey Phillips and Swan EnergyI showcase two identical patterns in Godfrey Phillips and Swan Energy in this video. I had previously traded Swan Energy, and because I journal my trades, I remembered its price action when I spotted the same setup in Godfrey Phillips.
This is the power of journaling! By maintaining a trading journal, you track your profits and losses and improve your ability to recognize repeating patterns and backtest data effectively.
Do you maintain a trading journal? Let me know in the comments!

Scalping vs. Swing Trading: Which One is Better for You?Hello Traders!
Today’s topic is one that often sparks debate in the trading community: Scalping vs. Swing Trading. Both strategies have their unique strengths and challenges, and the choice between them largely depends on your trading style, time availability, and risk tolerance. Let’s break down the key differences to help you decide which approach may be better suited for you!
Scalping: The Fast-Paced Trading Strategy
Scalping is a trading strategy that focuses on making small profits from small price movements throughout the day. Traders who engage in scalping, also known as scalpers , typically execute multiple trades in a short period, often holding positions for just a few minutes or even seconds.
Key Characteristics of Scalping:
Short Holding Period: Scalpers hold positions for seconds to minutes, looking to capitalize on small price fluctuations.
High Frequency of Trades: A scalper executes many trades in a day, potentially dozens or hundreds, depending on market conditions.
Low Profit per Trade: While scalping, the profit per trade is small, but the cumulative returns can be substantial if executed consistently.
Requires Fast Decision-Making: Scalpers need to make quick decisions, as they operate in fast-moving markets.
Low Time Commitment per Trade: The time spent on each individual trade is short, but scalping requires constant attention to the markets throughout the trading session.
Swing Trading: The Mid-Term Strategy
Swing trading involves holding positions for a few days to weeks to capture larger price movements. Swing traders aim to take advantage of market “swings” or trends, rather than focusing on small fluctuations like scalpers.
Key Characteristics of Swing Trading:
Medium Holding Period: Positions are typically held for a few days or weeks to capitalize on medium-term price swings.
Fewer Trades per Day: Swing traders typically make fewer trades compared to scalpers, often only executing trades a few times per week.
Larger Profit per Trade: While the profit per trade is larger, swing traders can also face greater risk as positions are held for longer periods.
Trend-Following Approach: Swing traders often look to trade in the direction of the prevailing trend, using technical indicators to identify potential entries and exits.
More Time Between Trades: Swing traders don’t need to monitor the markets constantly like scalpers; they can afford to check their positions less frequently.
Which One is Better?
There is no clear-cut answer to which strategy is better—it depends on your personal preferences, lifestyle, and risk tolerance. Let’s compare them:
Scalping
Best for Active Traders: If you enjoy being constantly engaged with the market and have the time to dedicate to making quick decisions, scalping might be ideal for you .
Requires Quick Reflexes and a High Level of Focus: Scalping can be intense, as you need to react quickly to price movements.
Lower Risk per Trade, But High Frequency of Trades: While the risk per trade is small, the frequent trades can accumulate fees or slippage that impact overall profitability.
Swing Trading
Best for Less Active Traders: Swing trading is ideal if you don’t have time for constant monitoring but still want to take advantage of market movements.
Better for Those Who Can Handle Larger Price Moves: Swing traders need to be more patient and prepared for larger price swings.
More Time Between Trades, More Time for Analysis: Swing traders can dedicate more time to research and analysis before entering positions.
Conclusion:
Ultimately, scalping and swing trading are two effective strategies with their own strengths and weaknesses. Scalping suits fast-paced traders who thrive on constant action, while swing trading is better for those looking for a more relaxed, mid-term approach . Your choice should depend on your trading personality, time commitment, and comfort with risk.
What’s your preferred strategy? Scalping or Swing Trading?
Let me know your thoughts in the comments below! Happy trading!

MANAPPURAM FINANCE LTD - APPROACHING RESISTANCE AREASymbol - MANAPPURAM
Manappuram Finance Ltd. has been experiencing a recovery from lower levels in recent weeks. The stock has bounced back from support zones and is now testing key resistance areas. However, it faces considerable challenges at higher levels, showing signs of consolidation as it approaches its resistance zones.
The overall trend appears to be in recovery, following a significant dip. However, the stock is facing resistance at higher levels, indicating a potential pause or consolidation before any significant movement.
Short-term trend looks slightly bearish, as the stock has encountered selling pressure at resistance levels and is currently consolidating. Long-term trend remains positive, driven by the company’s strong fundamentals in the gold loan market.
The stock is currently trading within an ascending triangle pattern and is consolidating near key resistance levels. My personal bias is towards the downside, and we could potentially see a sell-off from the resistance zone towards the triangle support trendline, with the possibility of a move below it.
The trade strategy could involve looking for short opportunities near the resistance zone, especially if the stock fails to break out and begins to reverse. However, if the stock manages to break above the resistance trendline of the ascending triangle, the bias would shift to the upside.
Disclaimer - Do not consider this as a buy/sell recommendation. I'm sharing my analysis & my trading position. You can track it for educational purposes. Thanks!

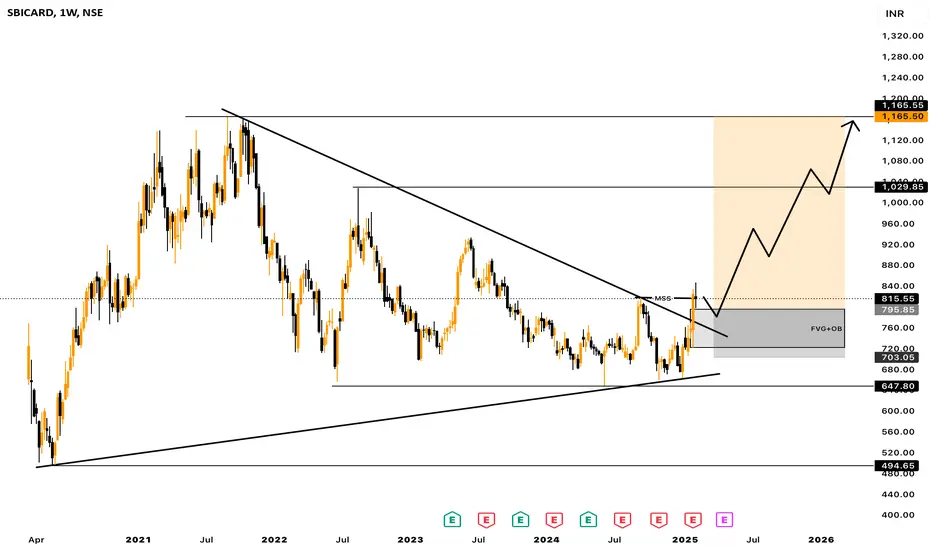
Technical Analysis: Symmetrical Triangle Breakout in SBICARD
• The weekly chart of SBI Cards (SBICARD) shows a symmetrical triangle pattern that has been forming since mid-2021.
• The stock recently broke out of this pattern, indicating a potential trend reversal or continuation move depending on broader market conditions.
• Resistance Breakout: The upper trendline, which acted as resistance, has been breached, and the stock is now retesting the breakout level (~800).
• Volume Confirmation Needed: To validate the breakout, an increase in volume would be ideal.
Fundamental Analysis: Mixed Earnings Performance
• Earnings Per Share (EPS) Trends:
• Q3 FY24 EPS came in at 4.25, missing estimates by 31.16%—a significant negative surprise.
• Q2 FY24 EPS also missed estimates by 4.51%, while Q1 FY24 had a 4.59% miss as well.
• The company has shown inconsistent earnings, which could cause volatility despite the technical breakout.
• Revenue Growth:
• Q3 FY24 revenue was ₹46.19B, exceeding estimates by 10.06%.
• Q2 FY24 revenue missed expectations by 3.01%, while Q1 FY24 was also slightly weak.
• This suggests that while top-line growth is strong, profitability (EPS) is under pressure due to either higher costs or operational inefficiencies.
Investment View: Cautious Buy with Risk Management
• Technical View: The breakout above the triangle is bullish, but the stock must sustain above 800-820 for confirmation. If it does, next resistance levels are 900 and 1000.
• Fundamental Concerns: Weak earnings growth is a risk factor. The next earnings (April 2025) will be crucial.
• Buying Strategy:
• Entry: If the stock holds above 800-820, it can be bought with a target of 900-1000.
• Stop Loss: 750-770 zone (below the breakout trendline).
• Risk Factor: If broader market sentiment weakens or earnings disappoint further, the breakout might fail.
Conclusion: A breakout trade is valid, but weak earnings make it a cautious buy with a tight stop loss. If fundamentals improve, the rally could sustain.
Eicher Motor, Swing BuyEicher Motor broke out with high Volume and retraced 61.8% fib level.
Price is moving up with RSI also Strong, It is good swing with 1:2 Risk Reward where SL is 6-7% and Target is 10-12%

Waaree Energies | Bullish SetupWaaree Energies is Either in 4th of C wave or 1/A of Reversal Wave.
In both cases price is expected to move up.
Not a buy/sell recommendation. Just an opinion or personal view based on knowledge of Elliot wave analysis. I do not guarantee and profits/returns.

NavinFlour Swing BuyNavinFlour made a breakout with Volume.
Strong RSI
Retraced till 61.8% and reversed.
Strong Momentum
SL and Target Given Chart.

Axis Bank : Swing Trade Pick#axisbank #swingtrade #momentumtrade #trendingstock
Axis Bank : Swing Trade
>> Low PE Stock
>> Banking Sector Theme, most likely to perform
>> Trending stock
>> Low Risk Trade
Swing Traders can lock profit at 10% and keep Trailing
Please Boost, comment and follow us for more Learnings.
Note : Markets are still Tricky and can go either ways so don't be over aggressive while choosing & planning your Trades, Calculate your Position sizing as per the Risk Reward you se and most importantly don't go all in
Disc : Charts shared are for learning purpose only, not a Trade recommendation. Do your own research and consult your financial advisor before taking any position.

Tata Motors-2-Chart AnalysisTata motors CMP:786.45; RSI: 36.35;
TATAMOTORS has completed 5 wave impulsive -Primary Bull cycle phase on weekly chart basis and now in corrective of ABC wave in formation . Corrective Wave-A has bottomed out and wave-B may give a swing trade opportunity for aggressive trader . This wave-B may take the Tata Motors shares at levels of 969-980 levels.
In Long term view is still avoid and fresh entry is suggested only for swing trade.
On daily chart basis, also 5 wave structure has formed as identified in chart structure, It suggest script will now reverse as it has entered wave-a formation.
Chart structure suggest a swing trade is open. The key crucial levels are listed below
Swing Trade Target 1: 969-980; Target 2: 1000-1020.
Stop Loss : 710
✅ For more trading ideas like this, please like, share, and follow my Idea Stream ✅

Pre and Post Breakout with Pattern trading I make educational content videos for swing / positional trading

#SHIVALIK - Potential Break Out / Feb'25📊 Script: SHIVALIK
Key highlights: 💡⚡
📈 IH&N Formation in Weekly chart.
📈 IH&N Formation in Daily chart also
📈 Price gave a good up move.
📈 Went into a Side Ways consolidation for over a Two months.
📈 Volume spike seen in past
📈 MACD Cross Over.
📈 One can go for Swing Trade.
🟢 If you have any questions regarding the setup, please feel free to leave your inquiries in the comments, and I will respond promptly.
BUY ONLY ABOVE 850 DCB
⏱️ C.M.P 📑💰- 783
🟢 Target 🎯🏆 – NA%
⚠️ Stoploss ☠️🚫 – NA%
⚠️ Important: Always Exit the trade before any Event.
⚠️ Important: Always maintain your Risk & Reward Ratio.
✅#Boost, #Like & #Follow to never miss a new idea! ✅
Disclaimer: I am not SEBI Registered Advisor. My posts are purely for training and educational purposes.
Eat🍜 Sleep😴 TradingView📈 Repeat 🔁
Happy learning with MMT. Cheers!🥂

#CANTABIL - Breakout Soon Candidate! /Feb'25/ 📊 Script: CANTABIL
Key highlights: 💡⚡
📈 C.E.S.T – refer image
🟢 If you have any questions regarding the setup, please feel free to leave your inquiries in the comments, and I will respond promptly.
BUY ONLY ABOVE 315 DCB
⏱️ C.M.P 📑💰- 284
🟢 Target 🎯🏆 – NA%
⚠️ Stoploss ☠️🚫 – NA%
⚠️ Important: Always Exit the trade before any Event.
⚠️ Important: Always maintain your Risk & Reward Ratio.
✅#Boost, #Like & #Follow to never miss a new idea! ✅
Disclaimer: I am not SEBI Registered Advisor. My posts are purely for training and educational purposes.
Eat🍜 Sleep😴 TradingView📈 Repeat 🔁
Happy learning with MMT. Cheers!🥂
