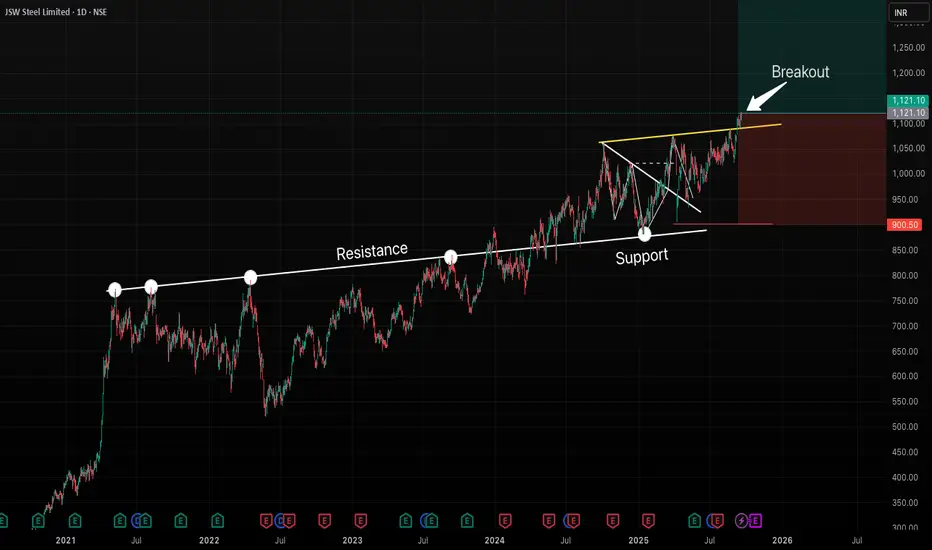
JSWSTEEL - Major Breakout After Long ConsolidationFrom May 2021 to April 2024, JSW Steel consistently faced resistance from the same trendline, rejecting multiple times.
In April 2024, price finally broke out above this resistance zone. After the breakout, the stock came down for a pullback and perfectly respected the same line, which has now flipped into support.
During this pullback, a minor downtrend was visible, but that too has been broken to the upside, showing a clear shift in momentum.
Now, the stock has given a strong breakout again (as shown in the chart). This indicates that the consolidation phase is over and it's going to give a very good rally in coming weeks/months.
Conclusion:
This looks like a good buying opportunity, both for swing trading and long-term investment, as the price action suggests strength and continuation on the upside.
Swingtrading
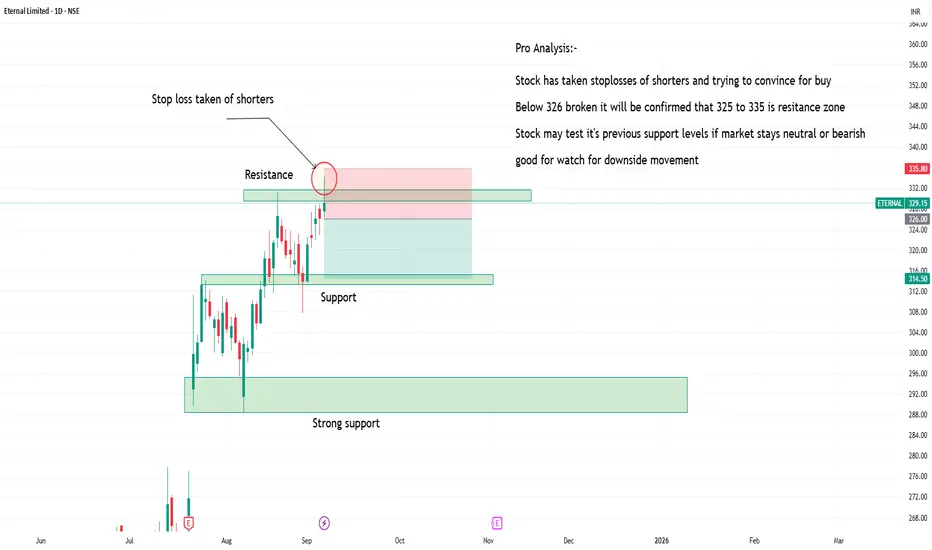
Zomato creating it's resistance zoneZomato is testing it's resistance zone.
one can watch for downside movement with stop losses above recent swing with targets of 215 levels.
it's pure price action.
stock may go in consolidate in zone for long time.
HYUNDAI : Breakout stock (Swing pick)#HYUNDAI #swingtrade #momentumtrade #breakoutstock #trendingstock
HYUNDAI : Swing trade
>> Breakout with Volume
>> Trending Stock
>> Momentum Trade
>> Volatility contraction seen
>> Good Strength in Stock
Swing Traders can lock profit at 10% and keep Trailing
Please Boost, comment and follow us for more Learnings.
Disc : Charts shared are for learning purpose only, not a Trade recommendation. Do your own research and consult your financial advisor before taking any position.

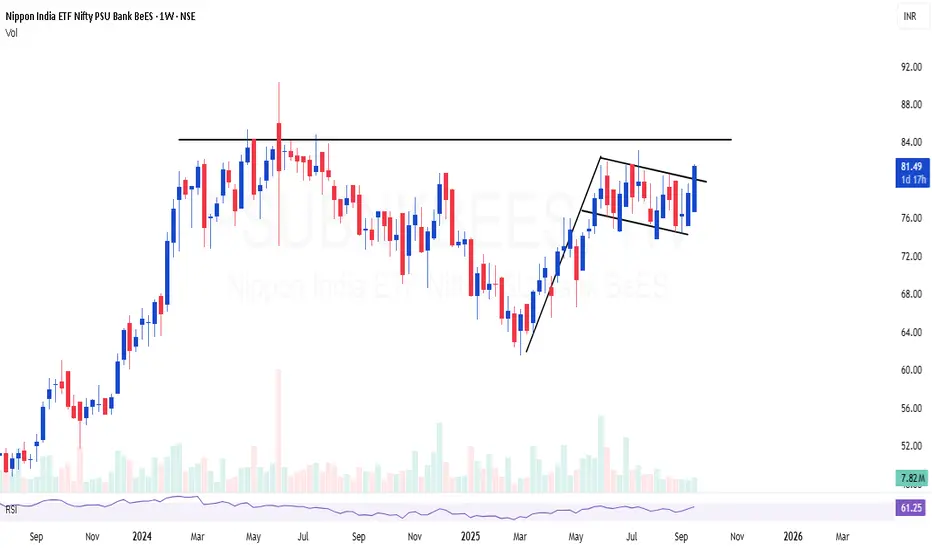
PSUBNKBEES | Excellent consolidation and flag formationPSUBNKBEES | Excellent consolidation and flag formation
Relatively safe bet on PSU Bank index, looks good for 30-40%
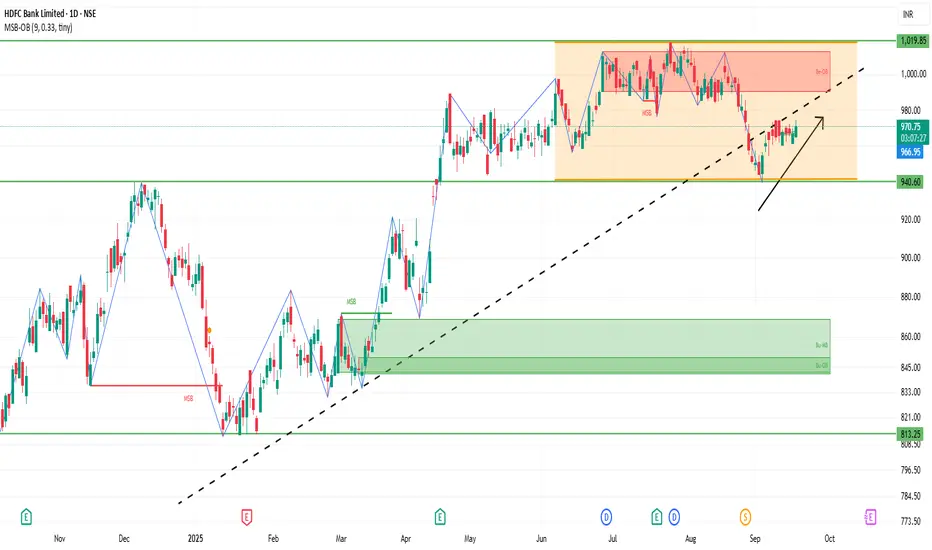
HDFCBANK 1D Time frameCurrent Stock Price
Current Price: ₹966.85
Day’s Range: ₹965.15 – ₹974.40
52-Week Range: ₹806.50 – ₹1,018.85
Market Cap: ₹14.88 lakh crore
P/E Ratio: 21.03
EPS (TTM): ₹45.97
Dividend Yield: 1.13%
Book Value: ₹339.84
📈 Trend & Outlook
Short-Term Trend: Mildly bullish; stock showing positive movement in recent sessions.
Resistance Levels: ₹974.40 (day’s high), ₹1,018.85 (52-week high).
Support Levels: ₹965.15 (day’s low), ₹950.00 (recent low).
Investor Sentiment: Positive, supported by institutional buying and favorable outlook.
🧭 Key Notes
Stock has room to move higher if it breaks near-term resistance.
If it falls below support, downside may extend to ₹950 or lower.
Overall, bulls are slightly stronger, but watch resistance for profit booking.
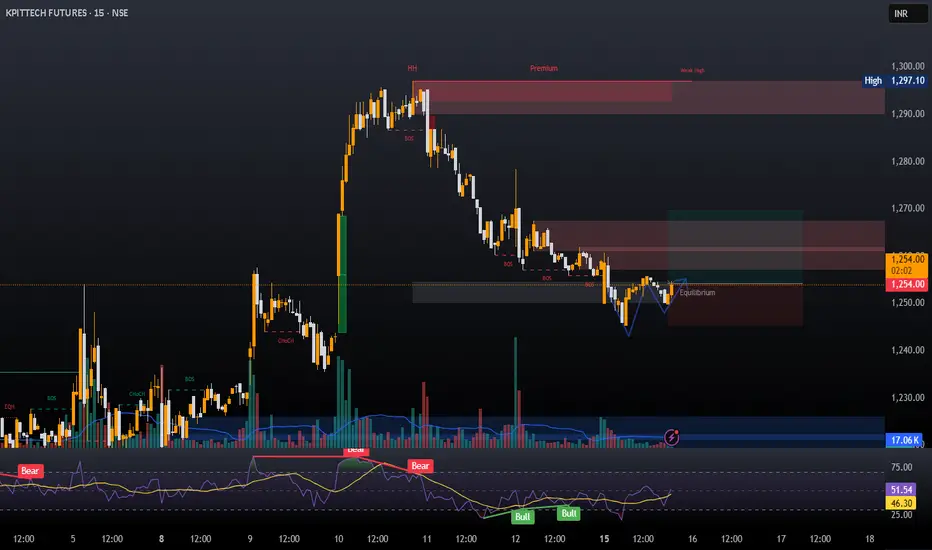
LONG IN KPITTECHA long trade can be taken in KPIT TECH. After a bullish run last week Kpit tech showed some profit booking but couldn't break the low of the candle from where it started its bullish reversal. Now it has formed a double bottom and hence a swing trade on the buy side can be taken.
Follow for more such analysis.
Entry- 1250-1254
Support- 1245-1242
Target- 1270, 1275, 1290
Disclaimer- This is just for educational purposes.
Jai Shree Ram
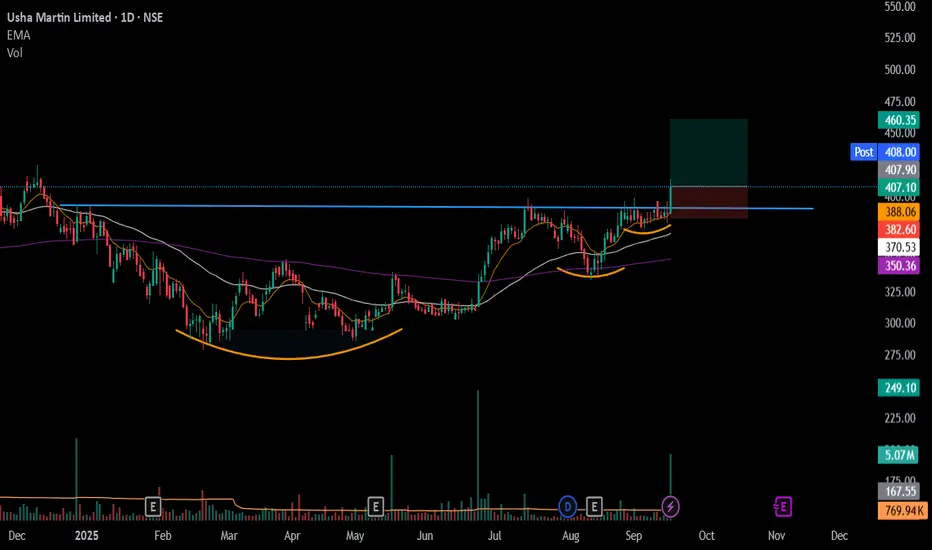
#USHAMART - VCP BreakOut in Daily Time Frame Script: USHAMART
Key highlights: 💡⚡
📈 VCP BreakOut in Daily Time Frame
📈 Price consolidated near Resistance before BO
📈 Volume spike during Breakout
📈 MACD Crossover
📈 Stock is near ATH
📈 Can go for a swing trade
BUY ONLY ABOVE 410 DCB
⏱️ C.M.P 📑💰- 407
🟢 Target 🎯🏆 – 12.90%
⚠️ Stoploss ☠️🚫 – 6.20%
⚠️ Important: Market conditions are Okish, Position size 50% per Trade. Protect Capital Always
⚠️ Important: Always Exit the trade before any Event.
⚠️ Important: Always maintain your Risk:Reward Ratio as 1:2, with this RR, you only need a 33% win rate to Breakeven.
✅Like and follow to never miss a new idea!✅
Disclaimer: I am not SEBI Registered Advisor. My posts are purely for training and educational purposes.
Eat🍜 Sleep😴 TradingView📈 Repeat 🔁
Happy learning with MMT. Cheers!🥂
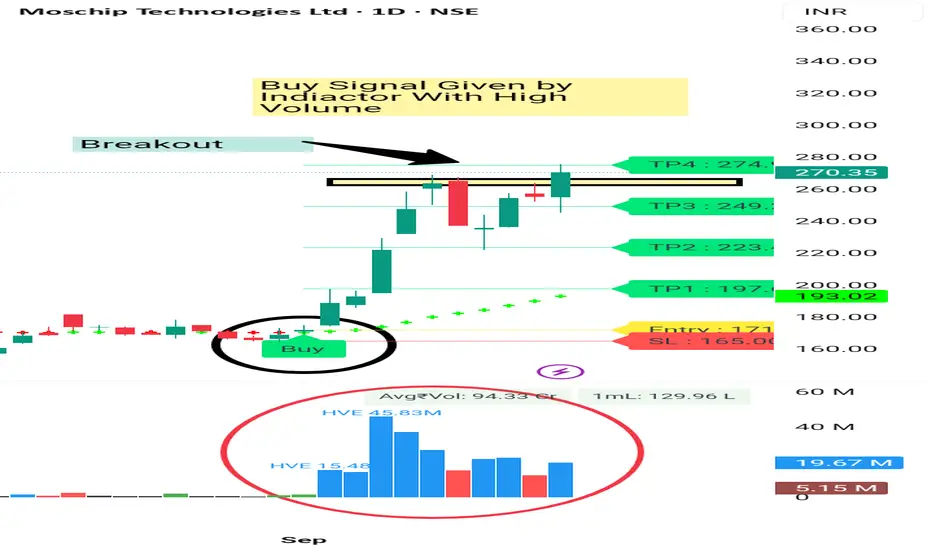
MOSCHIP BREAKOUT with Heavy Volume moschip is Given Decent Movement in past with High Volume. And now it's given good Breakout with Bullish Englulfing Candle. It's a Clear Breakout and it can give 5 -8% Quick movement from here . Keep SL 5%
Consult your financial advisor before making any position in stock market.
For More information. Visit my Tradingview Profile.
Always Trade with Stoploss.
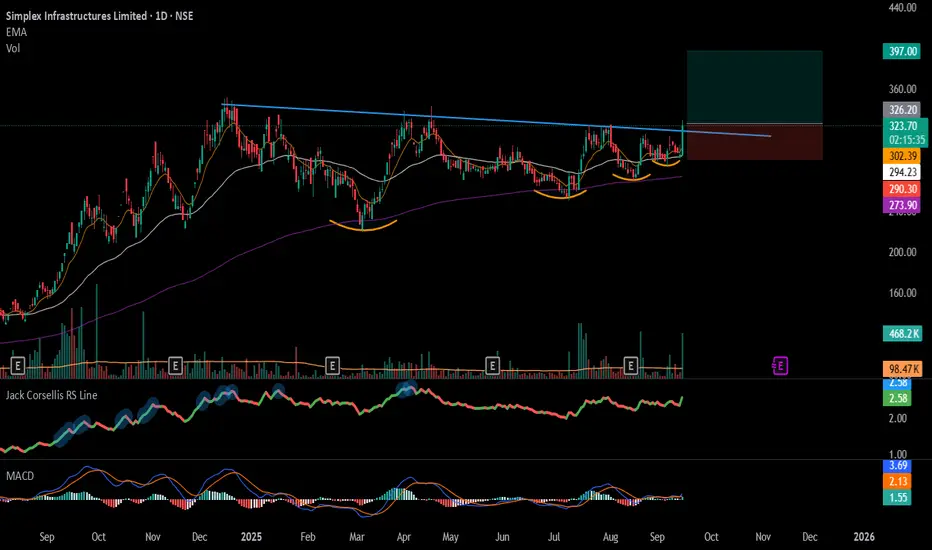
#SIMPLEXINF - TrendLine Breakout in Daily Time FrameScript: SIMPLEXINF
Key highlights: 💡⚡
📈 TrendLine Breakout in Daily Time Frame
📈 Volume spike during Breakout
📈 MACD Bounce
📈 Can go for a swing trade
BUY ONLY ABOVE 325 DCB
⏱️ C.M.P 📑💰- 322.25
🟢 Target 🎯🏆 – 22%
⚠️ Stoploss ☠️🚫 – 11%
⚠️ Important: Market conditions are Okish, Position size 50% per Trade. Protect Capital Always
⚠️ Important: Always Exit the trade before any Event.
⚠️ Important: Always maintain your Risk:Reward Ratio as 1:2, with this RR, you only need a 33% win rate to Breakeven.
✅Like and follow to never miss a new idea!✅
Disclaimer: I am not SEBI Registered Advisor. My posts are purely for training and educational purposes.
Eat🍜 Sleep😴 TradingView📈 Repeat 🔁
Happy learning with MMT. Cheers!🥂
KTKBANK Swing TradeKTKBANK Swing Trade Setup
Karnataka Bank Ltd. (NSE: KTKBANK) is showing a potential swing trade opportunity. The stock has recently taken support near ₹169 levels and is trading above key support zones.
Entry Zone: Current market price around ₹179
Target: ₹200
Stop Loss: ₹169 (closing basis)
The trade offers a favorable risk–reward setup for short- to medium-term swing traders, provided the stock sustains above the support level.

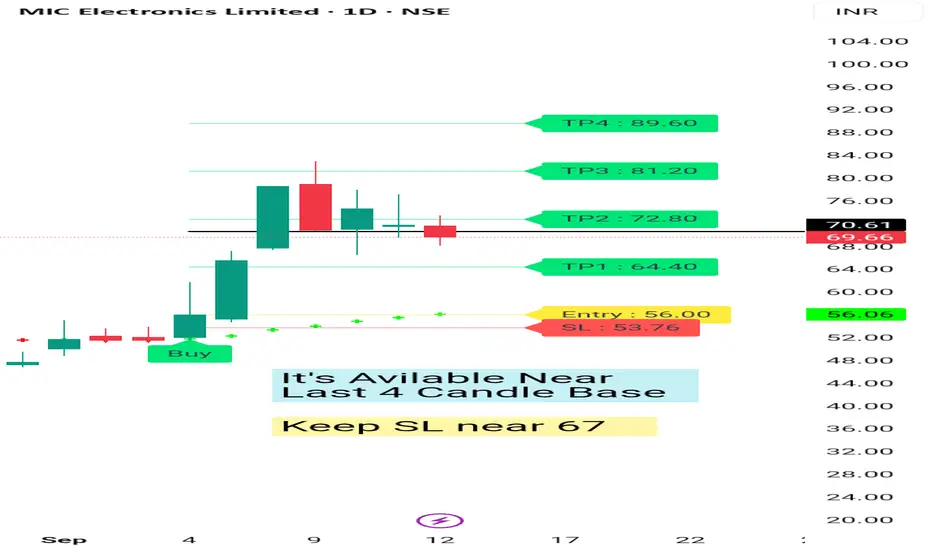
Mic Electronic Ready For Move After Retracement Mic Electronic given Buy Signal near 56 . Then it's moved to 82 .
Now again It's avilable near base level of last 4 days candle .
Keep SL 67 -66
We can Expect level of 80 , 85 -90 in next 1 -3 months max .
For more information visit my Tradingview Profile.
Consult your financial advisor before making any position in stock market. My views are for educational purposes only. Thanks 👍
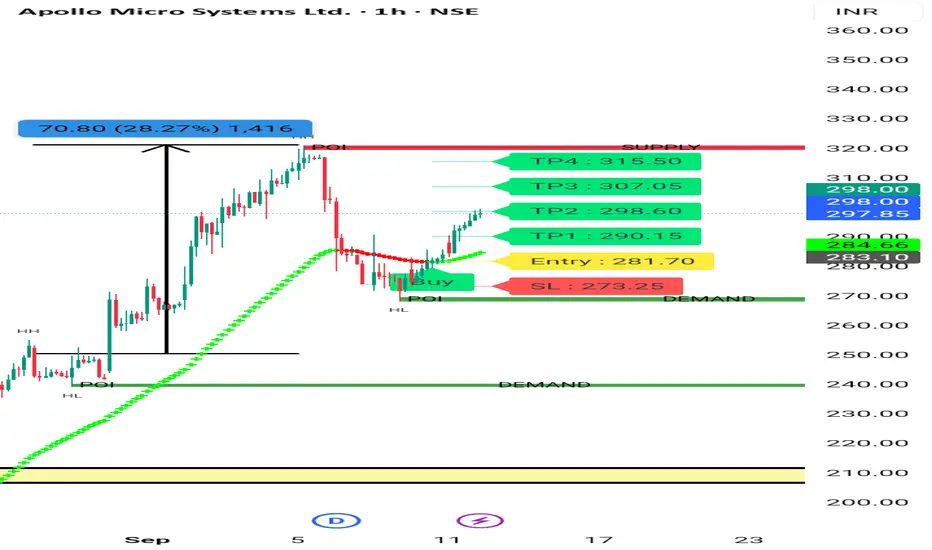
Apollo Micro System Again Upmove Apollo Micro Systems Earlier given near 250. Now Gain it's going Up after Taking Retracement. It's good sign. We can Enter at Cmp With 3 -5 % Stoploss.
It's in High Momentum.
Want to Learn more - how to Catch Such Stocks. Visit my Tradingview Profile .
Entry near 300 tgt 320 - 330 - 350 .
SL 5%
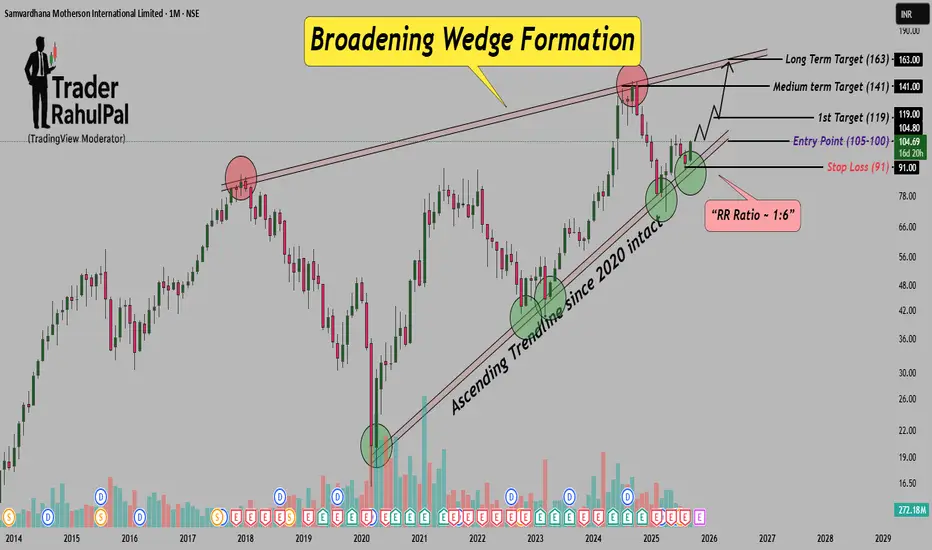
Motherson forming Broadening Wedge, Trendline support since 2020Hello Traders! Samvardhana Motherson – Broadening Wedge Breakout with Ascending Trendline Support
I hope you all are doing good in life and in your trading journey as well. Today I have brought a stock which is showing a dhamaka setup on the monthly chart – Samvardhana Motherson International . The stock is trading inside a Broadening Wedge Formation and respecting a strong ascending trendline since 2020 . Recently, it again bounced from the support zone near ₹91, which clearly shows demand and buyers’ confidence at lower levels.
The ideal entry zone lies between ₹100–₹105 with a protective Stop Loss at ₹91 . On the upside, the first hurdle is at ₹119, and once that is crossed, the stock may head towards medium-term target of ₹141 and long-term target of ₹163 . Rising volumes also indicate accumulation, and a sustained breakout above ₹119 could trigger a fresh multi-month rally.
Disclaimer: This analysis is for educational purposes only and should not be taken as financial advice. Please do your own research or consult your financial advisor before investing.
Analysis By @TraderRahulPal (TradingView Moderator) | More analysis & educational content on my profile
👉 If you found this helpful, don’t forget to like and follow for regular updates.
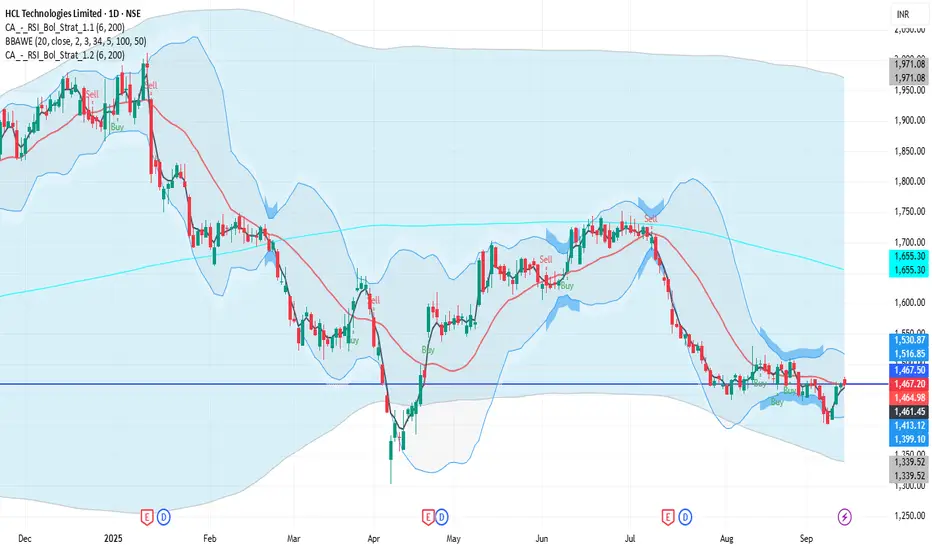
HCLTECH 1D Time frame📉 Current Market Snapshot
Current Price: ₹1,467
Previous Close: ₹1,467.20
Day’s Range: ₹1,463 – ₹1,480
📊 Key Support & Resistance Levels
Support Levels: ₹1,463, ₹1,450
Resistance Levels: ₹1,480, ₹1,500
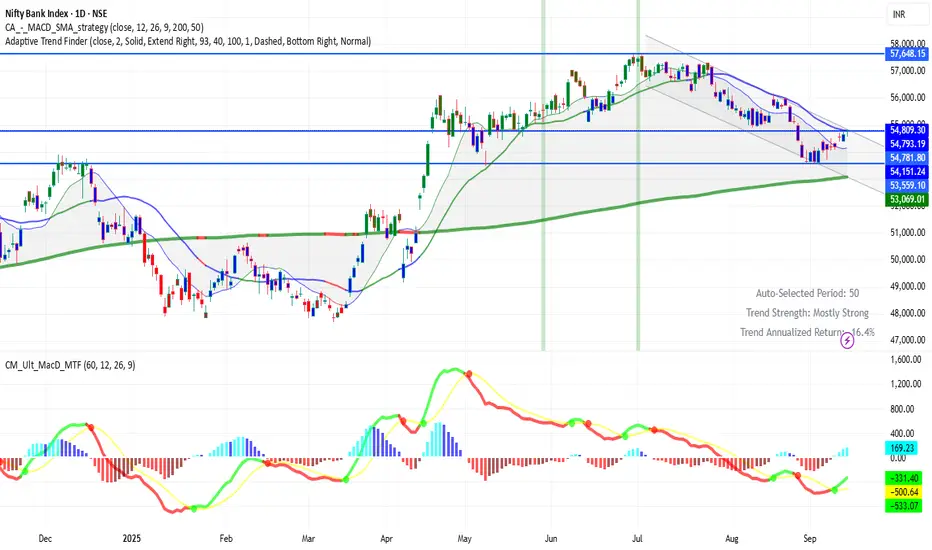
BANKNIFTY (1D timeframe)📍 Current Level
Trading around 54,809 points
🔑 Key Levels
Immediate Resistance: 55,000 → 55,200
Immediate Support: 54,400 → 54,500
Deeper Support: 53,800 → 53,500
✅ Outlook
If BankNifty breaks and holds above 55,000–55,200, more upside is possible.
If it falls below 54,400–54,500, weakness can take it down toward 53,800–53,500.
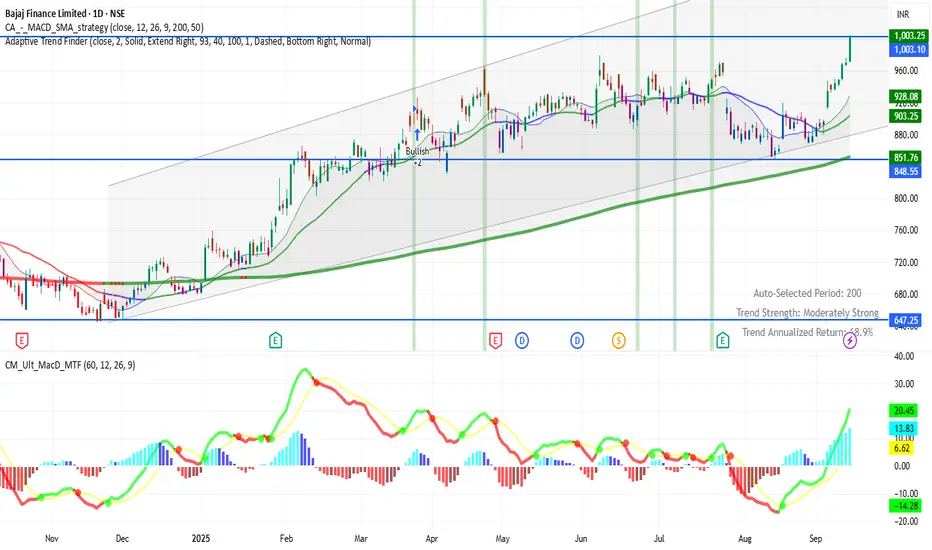
BAJFINANCE 1D Time frameCurrent Market Situation
Bajaj Finance is trading around ₹1003 in the daily chart. This level is very important because the stock has just touched its 52-week high near ₹1005. On the lower side, today’s support level is around ₹970 – ₹975, which is also close to the previous closing price.
The overall trend in the daily chart is strongly bullish, meaning buyers are in control right now.
Zota Healthcare Higher High Pattern Zota healthcare moving Up in a pattern . It's bullish Since many Months. You can Study Chart of last 2 Year. It's moving up in Pattern with Retracement. So it's very good.
You can make 5 -10% Easily in this Stocks. Keep SL 5%
It may be in Consolidation before moving up as u see same happened in last some days.
But it may move up with volume.
Visit my Tradingview Profile for more information.
Consult your financial advisor before making any position in stock market.

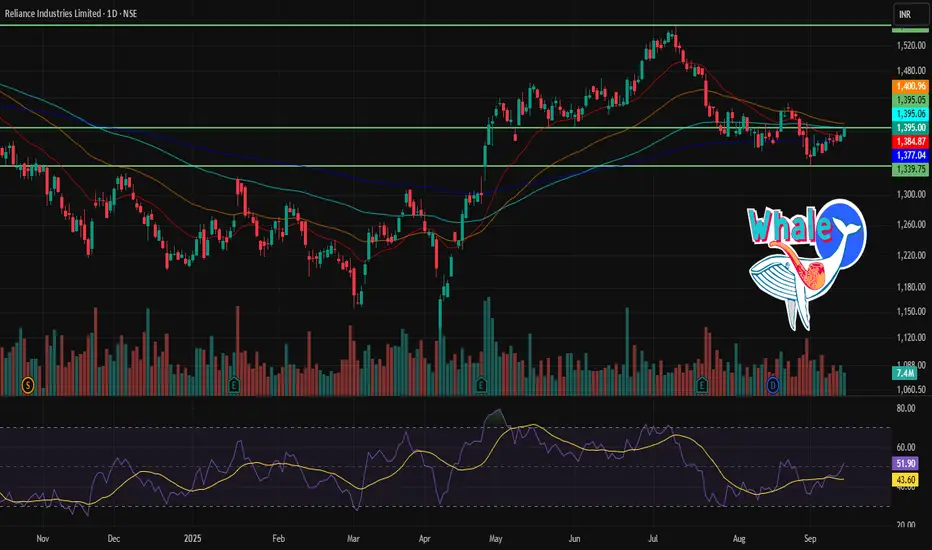
RELIANCE 1D Time frame🔢 Current Level
Trading around ₹1,395
🔑 Key Resistance & Support Levels
Resistance Zones:
~ ₹1,400 – ₹1,410 (near-term resistance)
~ ₹1,420 – ₹1,430 (stronger resistance above)
Support Zones:
~ ₹1,380 – ₹1,370 (first support)
~ ₹1,360 – ₹1,350 (secondary support)
📉 Outlook
Bullish Scenario: Holding above ₹1,400 could push price toward ₹1,420 – ₹1,430.
Bearish Scenario: A fall below ₹1,370 may drag it toward ₹1,350 or lower.
Neutral / Range: Likely to trade between ₹1,370 – ₹1,420 until a breakout or breakdown occurs.
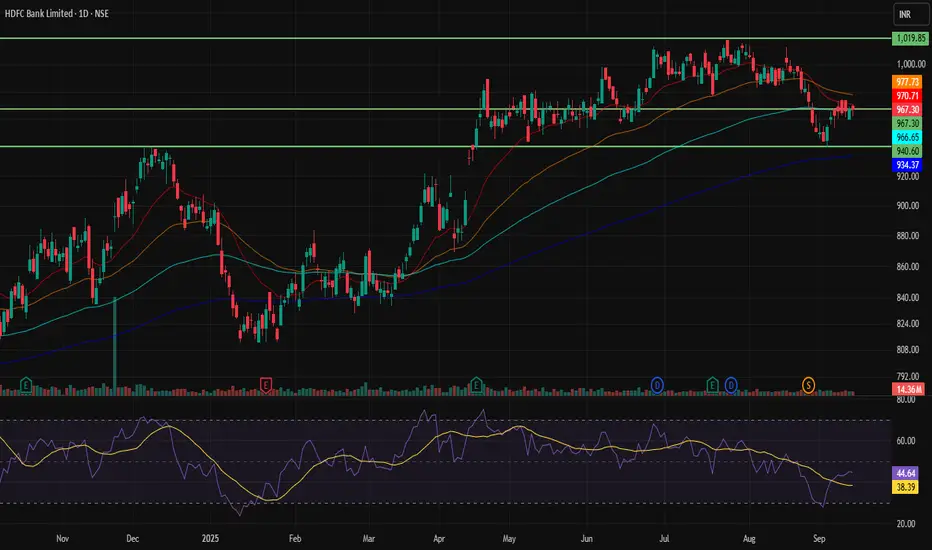
HDFCBANK 1D Time frame🔢 Current Level
Trading around ₹967
🔑 Key Resistance & Support Levels
Resistance Zones:
~ ₹970 – ₹975 (near-term resistance)
~ ₹980 – ₹985 (stronger resistance zone if it moves past the first)
Support Zones:
~ ₹962 – ₹960 (immediate support)
~ ₹955 – ₹950 (short-term support)
~ ₹945 – ₹940 (deeper support if price falls further)
📉 Outlook
Bullish Scenario: If HDFCBANK holds above ₹970 and clears resistance around ₹975, it may aim for ₹980+.
Bearish Scenario: If it drops below ₹960, it could test support in the ₹950-₹940 region.
Neutral / Range: Likely to trade sideways between ₹960-₹975 unless there’s a strong breakout or breakdown.
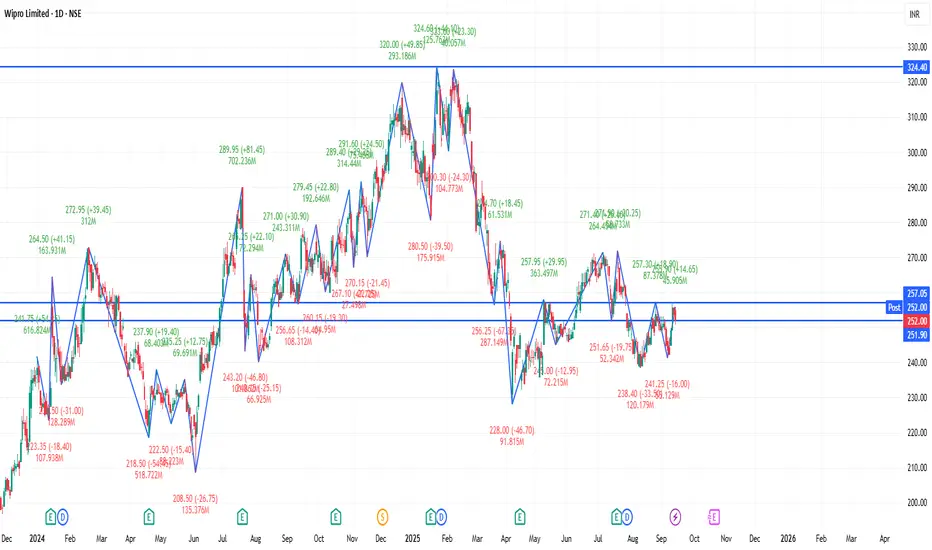
WIPRO 1D Time frame🔢 Current Level
Trading around ₹252.91
🔑 Key Resistance & Support Levels
Resistance Zones:
₹254.00 – ₹255.00 (recent highs; breakout above this may lead to further upside)
₹260.00 – ₹262.00 (stronger resistance above)
Support Zones:
₹250.00 – ₹251.00 (immediate support; failure to hold above this may lead to a decline)
₹245.00 – ₹246.00 (short-term support; a break below this could indicate weakness)
₹240.00 – ₹242.00 (deeper support zone if price dips further)
📉 Outlook
Bullish Scenario: If Wipro holds above ₹251.00, upward momentum may continue. Break above ₹255.00 can open the way toward ₹260.00+.
Bearish Scenario: If it falls below ₹245.00, risk increases toward ₹240.00 – ₹242.00.
Neutral / Range: Between ₹251.00 – ₹255.00, Wipro may consolidate before a directional move.
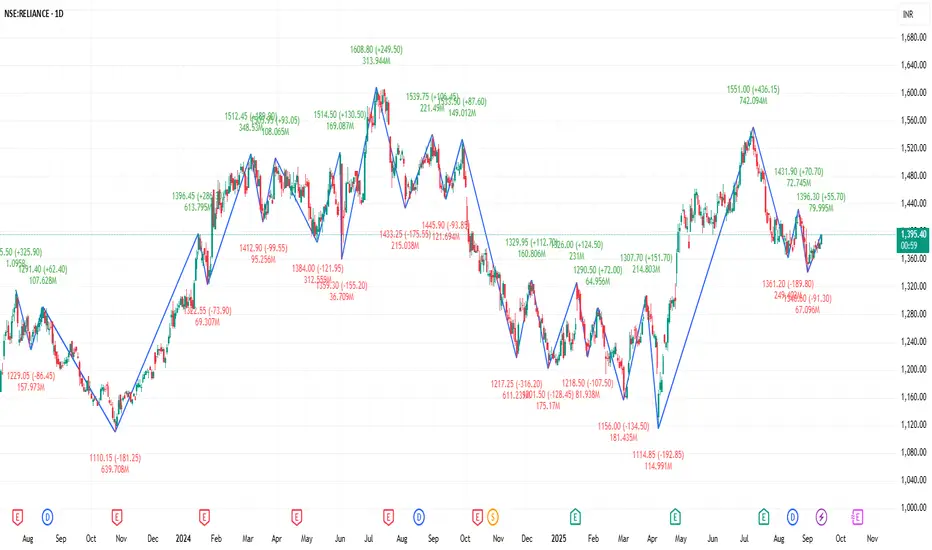
RELIANCE 1D Time frame🔢 Current Level
Trading around ₹1,393 - ₹1,395
🔑 Key Resistance & Support Levels
Resistance Zones:
~ ₹1,400 – ₹1,431 (immediate resistance band)
~ ₹1,440 – ₹1,460 (higher resistance if momentum continues)
Support Zones:
~ ₹1,380 – ₹1,370 (short-term support)
~ ₹1,360 (important support below)
📉 Outlook
Bullish Scenario: Holding above ₹1,400 and breaking past ₹1,431 can open the path toward ₹1,440–₹1,460.
Bearish Scenario: A fall below ₹1,370–₹1,360 increases risk of deeper decline.
Neutral / Range: Between ₹1,360–₹1,431, Reliance may move sideways until a clear breakout happens.
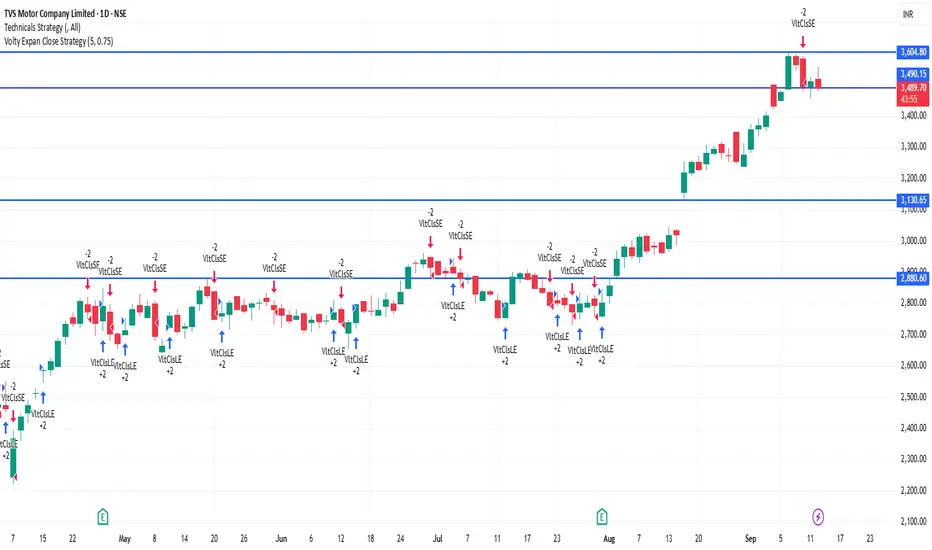
TVSMOTOR 1D Time frame🔢 Current Level
Trading around ₹3,490 – ₹3,526
🔑 Key Resistance & Support Levels
Resistance Zones:
₹3,550 – ₹3,556 (near-term resistance; breakout above this may lead to further upside)
₹3,600 (psychological resistance)
₹3,650 (stronger resistance above)
Support Zones:
₹3,510 – ₹3,520 (immediate support; failure to hold above this may lead to a decline)
₹3,480 – ₹3,490 (short-term support; a break below this could indicate weakness)
₹3,400 – ₹3,450 (deeper support zone if price dips further)
📉 Outlook
Bullish Scenario: If TVS Motor holds above ₹3,520, upward momentum may continue. Break above ₹3,556 can open the way toward ₹3,600+.
Bearish Scenario: If it falls below ₹3,480, risk increases toward ₹3,400 – ₹3,450.
Neutral / Range: Between ₹3,520 – ₹3,556, TVS Motor may consolidate before a directional move.
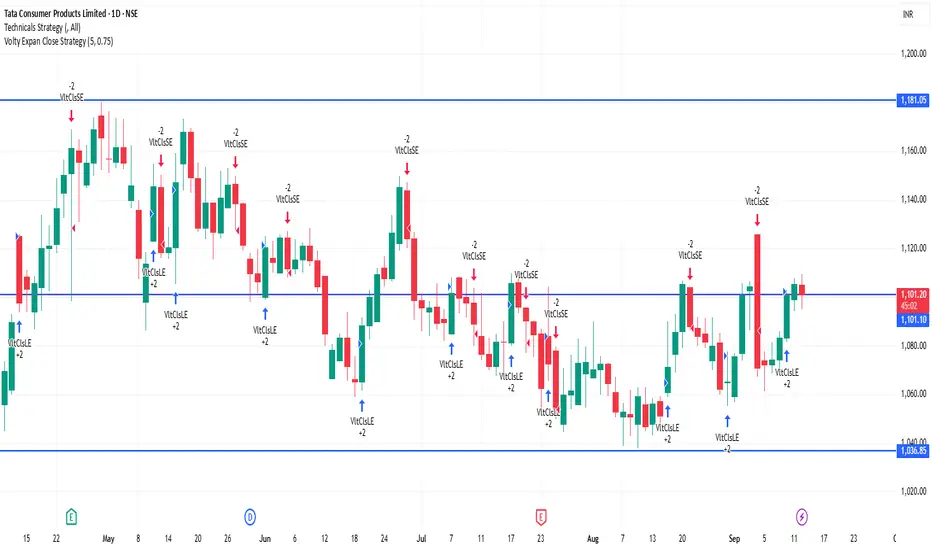
TATACONSUM 1D Time frame🔢 Current Level
Trading around ₹1,101.30
🔑 Key Resistance & Support Levels
Resistance Zones:
₹1,110 – ₹1,115 (recent highs; breakout above this may lead to further upside)
₹1,120 (psychological resistance)
₹1,130 – ₹1,140 (stronger resistance above)
Support Zones:
₹1,095 – ₹1,100 (immediate support; failure to hold above this may lead to a decline)
₹1,085 – ₹1,090 (short-term support; a break below this could indicate weakness)
₹1,070 – ₹1,080 (deeper support zone if price dips further)
📉 Outlook
Bullish Scenario: If Tata Consumer holds above ₹1,100, upward momentum may continue. Break above ₹1,115 can open the way toward ₹1,120+.
Bearish Scenario: If it falls below ₹1,085, risk increases toward ₹1,070 – ₹1,080.
Neutral / Range: Between ₹1,100 – ₹1,115, Tata Consumer may consolidate before a directional move.