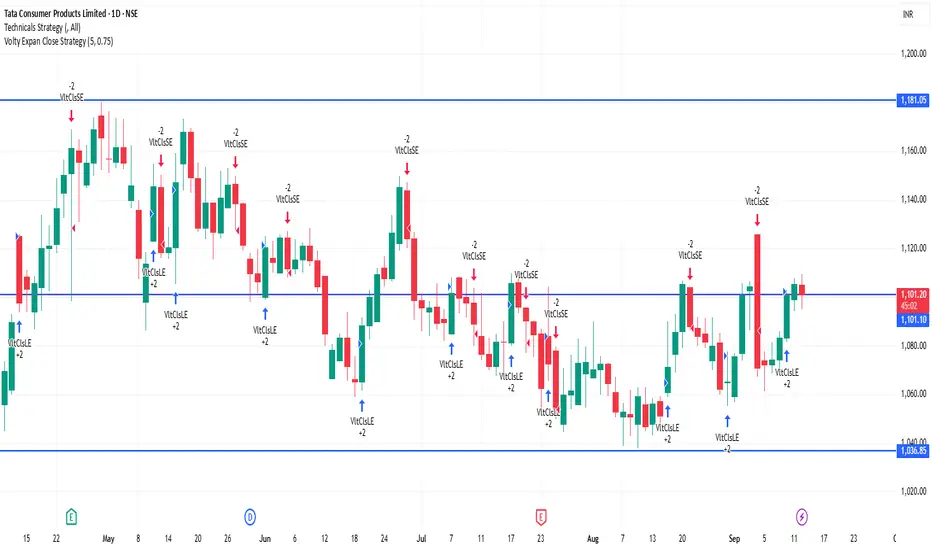
TATACONSUM 1D Time frame🔢 Current Level
Trading around ₹1,101.30
🔑 Key Resistance & Support Levels
Resistance Zones:
₹1,110 – ₹1,115 (recent highs; breakout above this may lead to further upside)
₹1,120 (psychological resistance)
₹1,130 – ₹1,140 (stronger resistance above)
Support Zones:
₹1,095 – ₹1,100 (immediate support; failure to hold above this may lead to a decline)
₹1,085 – ₹1,090 (short-term support; a break below this could indicate weakness)
₹1,070 – ₹1,080 (deeper support zone if price dips further)
📉 Outlook
Bullish Scenario: If Tata Consumer holds above ₹1,100, upward momentum may continue. Break above ₹1,115 can open the way toward ₹1,120+.
Bearish Scenario: If it falls below ₹1,085, risk increases toward ₹1,070 – ₹1,080.
Neutral / Range: Between ₹1,100 – ₹1,115, Tata Consumer may consolidate before a directional move.
Swingtrading
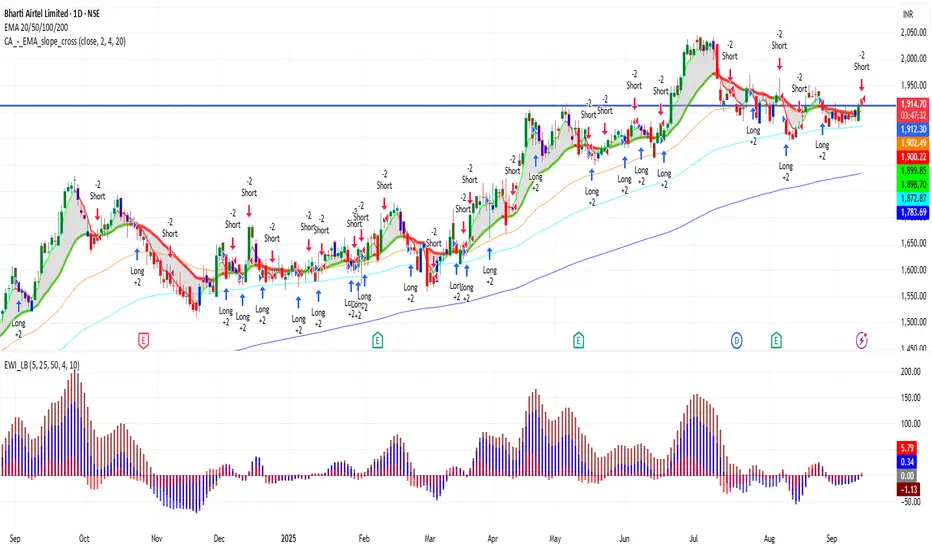
BHARTIARTL 1D Time frame🔢 Current Level
Trading around ₹1,912.00 - ₹1,914.30
🔑 Key Resistance & Support Levels
Resistance Zones:
₹1,925 – ₹1,930 (recent highs; breakout above this may lead to further upside)
₹1,950 (psychological resistance)
₹2,000 (stronger resistance above)
Support Zones:
₹1,900 – ₹1,905 (immediate support; failure to hold above this may lead to a decline)
₹1,880 (short-term support; a break below this could indicate weakness)
₹1,850 – ₹1,860 (deeper support zone if price dips further)
📉 Outlook
Bullish Scenario: If Bharti Airtel holds above ₹1,905, upward momentum may continue. Break above ₹1,930 can open the way toward ₹1,950+.
Bearish Scenario: If it falls below ₹1,880, risk increases toward ₹1,850 – ₹1,860.
Neutral / Range: Between ₹1,905 – ₹1,930, Bharti Airtel may consolidate before a directional move.
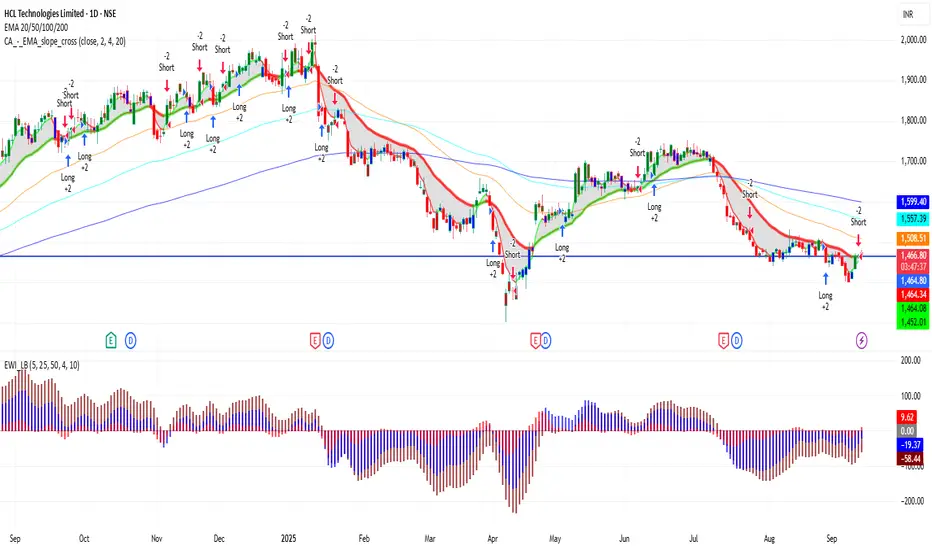
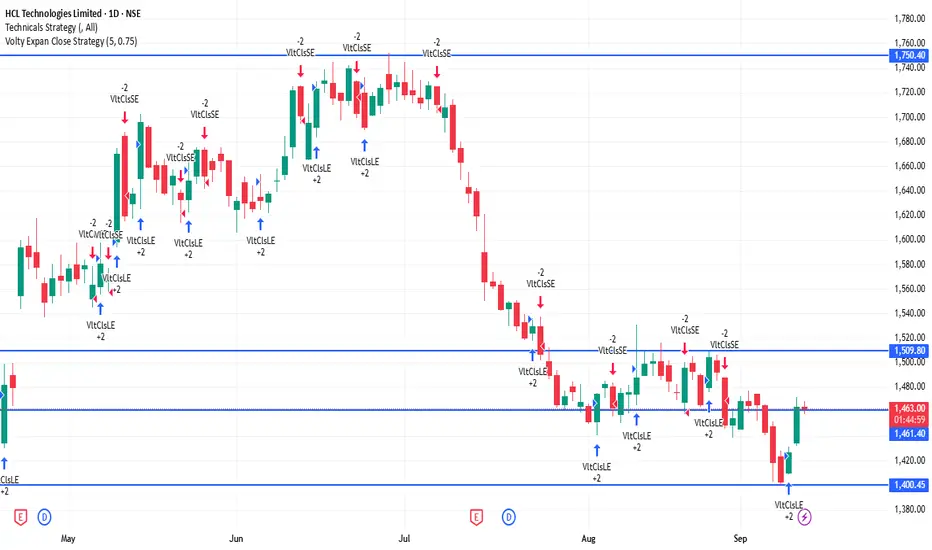
HCLTECH 1D Time frame🔢 Current Level
Trading around ₹1,465 – ₹1,470
🔑 Key Resistance & Support Levels
Resistance Zones:
₹1,476 – ₹1,480 (near-term resistance; breakout above this may lead to further upside)
₹1,494 – ₹1,520 (stronger resistance above)
Support Zones:
₹1,460 – ₹1,463 (immediate support; failure to hold above this may lead to a decline)
₹1,450 – ₹1,460 (short-term support; a break below this could indicate weakness)
₹1,431 – ₹1,440 (deeper support zone if price dips further)
📉 Outlook
Bullish Scenario: If HCL Technologies holds above ₹1,463, upward momentum may continue. Break above ₹1,480 can open the way toward ₹1,494 – ₹1,520.
Bearish Scenario: If it falls below ₹1,450, risk increases toward ₹1,431 – ₹1,440.
Neutral / Range: Between ₹1,463 – ₹1,480, HCL Technologies may consolidate before a directional move.
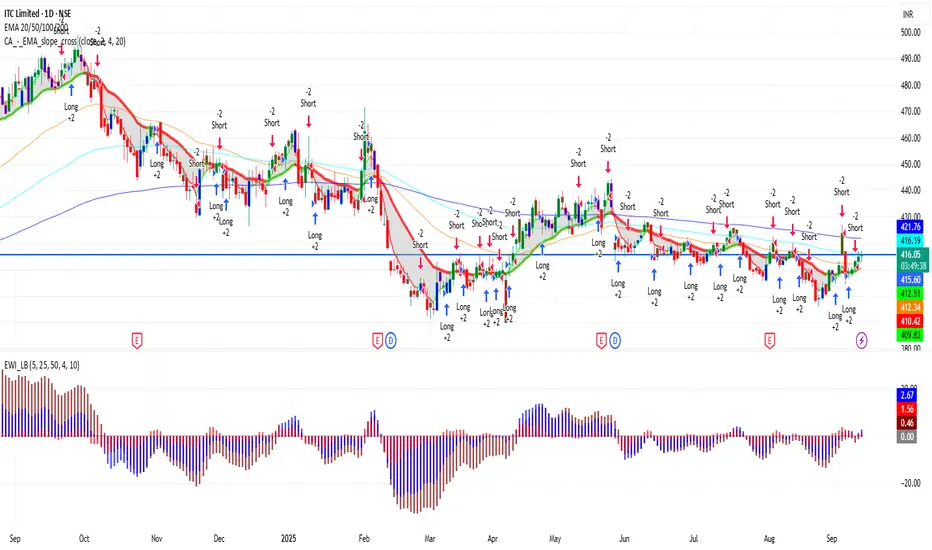
ITC 1D Time frame🔢 Current Level
ITC is trading around ₹413 – ₹416
🔑 Key Resistance & Support Levels
Resistance Zones:
₹416 – ₹421 (near-term resistance; breakout above this may lead to further upside)
₹420 (psychological resistance)
₹428 (stronger resistance above)
Support Zones:
₹412 – ₹413 (immediate support)
₹410 (short-term support; break below may indicate weakness)
₹398 – ₹400 (deeper support zone)
📉 Outlook
Bullish Scenario: If ITC holds above ₹412 – ₹413, upward momentum may continue. Break above ₹417 – ₹420 can open the way toward ₹428+.
Bearish Scenario: If it falls below ₹410, risk increases toward ₹398 – ₹400.
Neutral / Range: Between ₹412 – ₹417, ITC may consolidate before a directional move.
TVSMOTOR 1D Time frame🔢 Current Level
Trading around ₹3,525 – ₹3,530
🔑 Key Resistance & Support Levels
Resistance Zones:
₹3,550 – ₹3,560: Near-term resistance; breakout above this may lead to further upside.
₹3,600: Stronger resistance above.
Support Zones:
₹3,500 – ₹3,510: Immediate support; failure to hold above this may lead to a decline.
₹3,450: Short-term support; a break below this could indicate weakness.
₹3,400: Deeper support zone if price dips further.
📉 Outlook
Bullish Scenario: If TVS Motor holds above ₹3,510, upward momentum may continue. Break above ₹3,560 can open the way toward ₹3,600+.
Bearish Scenario: A drop below ₹3,450 may signal further downside potential.
Neutral Zone: Between ₹3,510 and ₹3,560, TVS Motor may consolidate before a directional move.

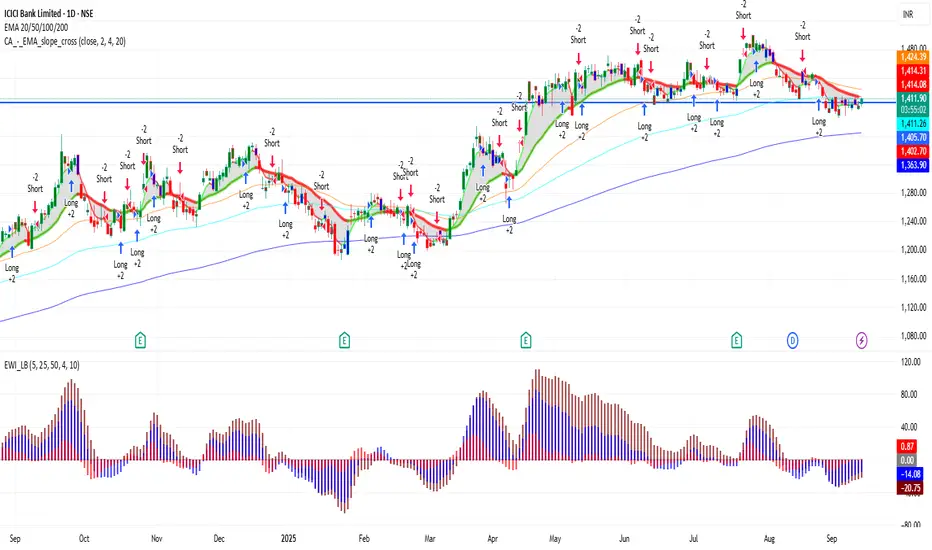
ICICIBANK 1D Time frame🔢 Current Level
ICICIBANK is trading around ₹1,401 – ₹1,412
🔑 Key Resistance & Support Levels
Resistance Zones:
₹1,407 – ₹1,415 (near-term resistance)
₹1,416 (next resistance level)
Support Zones:
₹1,390 – ₹1,392 (immediate support)
₹1,360 – ₹1,365 (stronger support if price dips further)
📉 Outlook
Bullish Scenario: If ICICIBANK holds above ₹1,392, upward momentum may continue. Break above ₹1,410 – ₹1,414 can open the way toward higher levels.
Bearish Scenario: If it falls below ₹1,360, risk increases toward ₹1,340 – ₹1,345.
Neutral / Range: Between ₹1,392 – ₹1,410, ICICIBANK may consolidate before a directional move.
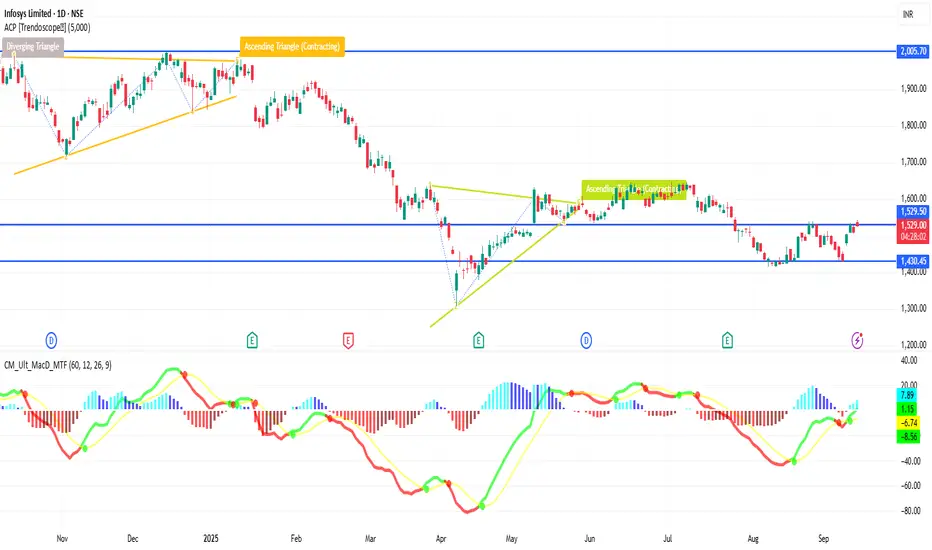
INFY 1D Time frame🔢 Current Level
INFY is trading around ₹1,510 – ₹1,529
🔑 Key Resistance & Support Levels
Resistance Zones:
₹1,518 – ₹1,520 (near-term resistance; breakout above this may lead to further upside)
₹1,530 (stronger resistance above)
Support Zones:
₹1,484 – ₹1,485 (immediate support)
₹1,481 (stronger support if price dips further)
₹1,470 – ₹1,472 (deeper support zone)
📉 Outlook
Bullish Scenario: If INFY holds above ₹1,485, upward momentum may continue.
Breakout Scenario: A move above ₹1,520 can open the way toward ₹1,530+.
Bearish Scenario: If it falls below ₹1,481, risk increases toward ₹1,470 – ₹1,472.
SENSEX 1D Time frame🔢 Current Level
Sensex is around ₹81,800 – ₹81,818
🔑 Key Resistance & Support Levels
Resistance Zones
~ ₹81,900 – ₹82,200 (recent highs / selling pressure zone)
~ ₹82,500 (stronger resistance above)
Support Zones
~ ₹81,300 – ₹81,400 (immediate support)
~ ₹81,100 (stronger support if price dips further)
~ ₹80,800 – ₹80,900 (deeper support zone)
📉 Outlook
If Sensex holds above ~ ₹81,400, bullish scenario remains alive.
Break above ~ ₹82,200 can open upside toward ~ ₹82,500+.
If it loses ~ ₹81,300, then downward risk increases, possibly toward ~ ₹81,100 or lower.

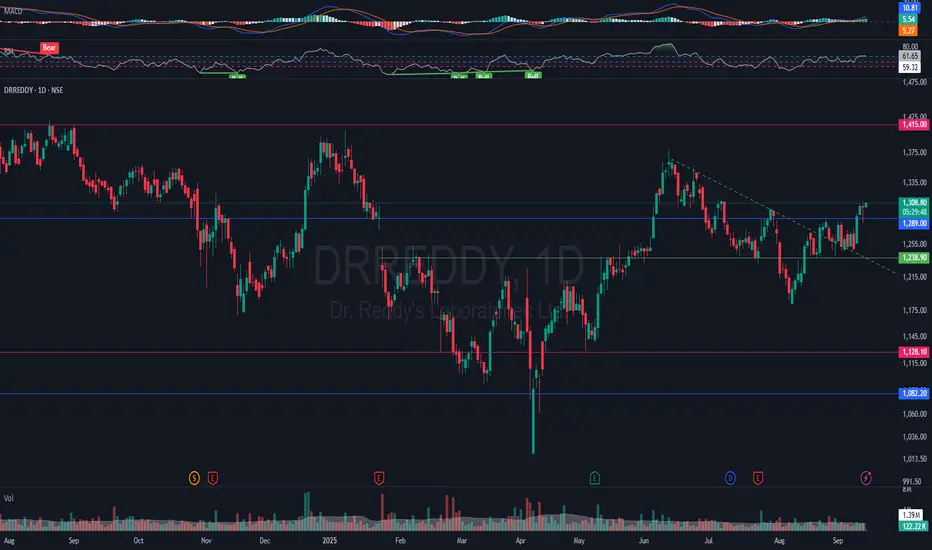
NSE:DRREDDY - Medium Term Swing Trade Opprotunity💹 Weekly Charts::
Price is consolidating around ₹1,300 after a bounce from the ₹1,150–1,180 zone (strong support zone).
Major resistance levels:
₹1,350–1,360 (R1 zone & trendline resistance)
₹1,415 (swing high and R2 zone)
Weekly RSI ~60, showing improving momentum but not yet overbought.
MACD histogram turning positive → suggests early signs of bullish momentum.
📊 Daily Charts::
Price recently broke above ₹1,244–1,250 zone, now retesting near ₹1,300–1,307 (R1 pivot resistance).
Next resistance: ₹1,350–1,360, followed by ₹1,410–1,415.
RSI ~65, bullish but near overbought → breakout confirmation is key.
ADX improving, +DI > -DI → trend strengthening.
Volume is moderate but picking up on green candles.
📈 Upside Potential::
If price sustains above ₹1,310, it can rally towards:
₹1,350–1,360 (short-term target)
₹1,415 (swing high)
Breakout above ₹1,415 on strong volume → opens potential towards ₹1,505–1,520 (weekly R2 & psychological round level).
📉 Downside / Risk Levels::
Strong support: ₹1,245–1,250 (previous breakout zone).
Deeper support: ₹1,180–1,200 (weekly support + P pivot).
If price breaks below ₹1,180, bearish momentum may resume towards ₹1,100.
✅ Conclusion
Worth initiating a long only if it sustains above ₹1,310 with good volume.
Upside potential: ~8–15% (₹1,360 to ₹1,415, and possibly ₹1,500).
Stop-loss: Below ₹1,245 on a closing basis (or tighter at ₹1,275 if risk needs to be managed).
This is a medium-term swing trade opportunity.
🛄 Disclaimer: This idea is posted solely for educational and learning purposes only and must not be construed as advice to buy or sell. Please consult your investment advisor before making any financial decision. Investments are subject to market risks.
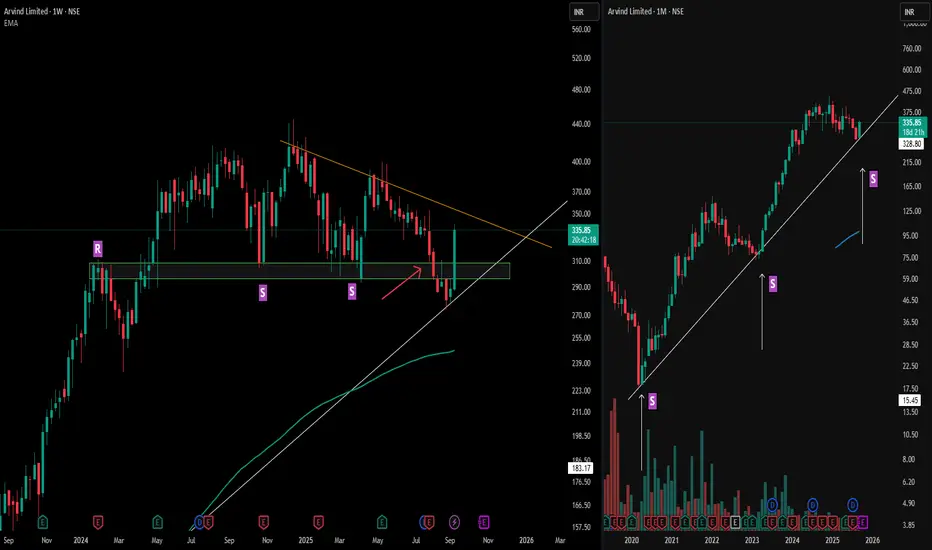
Arvind : Spotting Fake Breakdowns with Multi-Timeframe SupportArvind Limited highlights how a broader perspective can clarify deceptive price moves.
On the left (weekly), resistance ("R") flipped into support ("S") multiple times, with the orange counter trendline framing the recent structure. The red arrow marks a moment when weekly support appeared broken—a classic fake breakdown as price quickly reclaimed the zone with decisive strength.
Looking right (monthly), the MTFA view explains the recovery: a long-standing trendline support anchors the zone, helping absorb downside attempts and fueling the swift reversal. This alignment across timeframes illustrates how long-term technical structures often override short-term volatility, and why reviewing bigger picture charts is essential for pattern validation—not for prediction.
Disclaimer: This analysis is for educational purposes only and does not constitute investment advice. Always do your own research before making financial decisions.
TATACONSUM 1D Time frame📍 Current Price Action
Current Price: ~₹1,105
Day Change: +0.3% approx
52-Week Range: ₹882 – ₹1,234
⚙ Technical Indicators
RSI (14): ~62-65 → bullish momentum
MACD: Positive → upside bias intact
ADX (14): Above 50 → strong trend strength
Stochastic / Williams %R: In overbought zone → short-term pullback risk
📊 Moving Averages
Short-term (5, 10-day): Bullish, price trading above
Medium-term (20, 50-day): Bullish, trend supportive
Long-term (100, 200-day): Bullish, strong structure
📉 Support & Resistance
Immediate Support: ₹1,080 – ₹1,090
Next Support Zone: ₹1,060 – ₹1,030
Immediate Resistance: ₹1,115 – ₹1,125
Major Resistance (52-week high): ₹1,230+
🧠 Summary
Tata Consumer is bullish on the daily chart. Indicators and moving averages show strong momentum, though overbought signals suggest chances of consolidation or mild pullback. Holding above ₹1,080 keeps the uptrend intact. A breakout above ₹1,125 can open the way toward ₹1,230+.

BANKNIFTY 1D Time frame📍 Current Price Action
Level: ~54,670
Day’s Range: 54,402 – 54,757
52-Week Range: 47,703 – 57,628
⚙ Technical Indicators
RSI (14): ~60 → bullish momentum, not overbought yet
MACD: Positive → supports uptrend
Moving Averages:
Short-term (5, 10, 20-day): Bullish signals
Medium-term (50, 100-day): Supportive of trend
Long-term (200-day): Slight resistance near current level
Stochastic Oscillator: In overbought zone → strong momentum but risk of pullback
📊 Support & Resistance
Immediate Support: ~54,400
Immediate Resistance: ~54,750 – 55,000
Pivot Point: ~54,550
🧠 Summary
Bank Nifty is in a bullish short-term trend. Holding above 54,400 keeps momentum positive, while a breakout above 55,000 could open room for more upside. If resistance holds, the index may consolidate or retest lower supports.

WIPRO 1D Time framw📈 Price Action
Previous Close: ₹255.75
Today's Close: ₹256.50
Daily Range: ₹253.00 – ₹257.00
Volume: 804,499 shares (significantly higher than the 50-day average of 369,496 shares)
52-Week Range: ₹228.00 – ₹324.55
🔧 Technical Indicators
Relative Strength Index (RSI): 63.59 — Indicates bullish momentum.
MACD: Positive — Suggests upward trend.
Moving Averages:
5-day MA: ₹254.50
50-day MA: ₹249.00
200-day MA: ₹265.00
Trend: Bullish, as the stock is trading above short-term moving averages.
Stochastic Oscillator: 76.47% — Indicates overbought conditions, suggesting potential for a pullback.
Average True Range (ATR): ₹0.05 — Indicates low volatility.
📊 Support & Resistance Levels
Immediate Support: ₹253.00
Immediate Resistance: ₹257.00
Pivot Point: ₹255.00
🧠 Trend Analysis
Trend: Bullish
Momentum: Positive
Volatility: Low
Summary: Wipro's stock is exhibiting a bullish trend with positive momentum. The current overbought condition, as indicated by the stochastic oscillator, suggests that the stock may experience a short-term pullback before continuing its upward trajectory. Traders should monitor the support and resistance levels for potential entry and exit points.

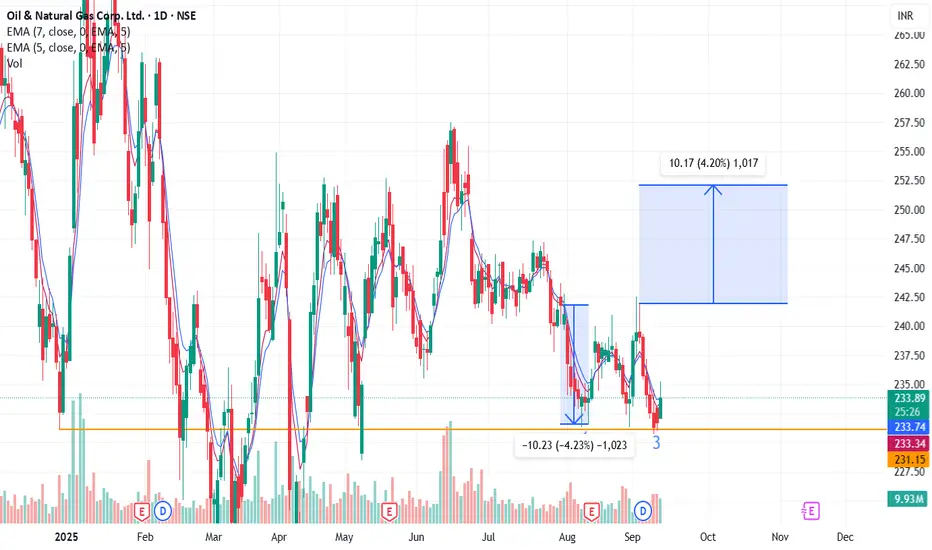
Triple bottom setup on weekly supportNSE:ONGC
Triple bottom setup on weekly support, price started moving upward slowly, with some big spikes in volume. This is very good setup. If this continues, one can expect first tartget at 242 and second target on 252.
BANKNIFTY 1D Time frameApologies for any confusion earlier. As of September 11, 2025, at 2:48 PM IST, the Nifty Bank (BANKNIFTY) index is trading at approximately ₹54,536.00 on the daily (1D) time frame.
The Economic Times
📊 Current Snapshot
Current Price: ₹54,681.00
Day’s Range: ₹54,402.40 – ₹54,733.90
Previous Close: ₹54,536.00
Opening Price: ₹54,413.05
Volume: Approximately 6.16 million shares
📈 Trend & Indicators
Trend: Neutral to mildly bullish; trading near short-term resistance.
RSI (14): Neutral zone.
MACD: Positive → indicating mild bullish momentum.
Moving Averages: Short-term averages indicate neutral to slightly bullish outlook.
🔮 Outlook
Bullish Scenario: Break above ₹54,800 with strong volume could target ₹55,000.
Bearish Scenario: Drop below ₹54,400 may lead to further decline toward ₹54,200.
Neutral Scenario: Consolidation between ₹54,400 – ₹54,800; breakout needed for directional move.
📌 Key Factors to Watch
Economic Indicators: Interest rates, inflation, and RBI policy updates.
Sector Performance: Trends in the banking sector.
Global Cues: Global market trends, US indices, crude oil, and currency movements.

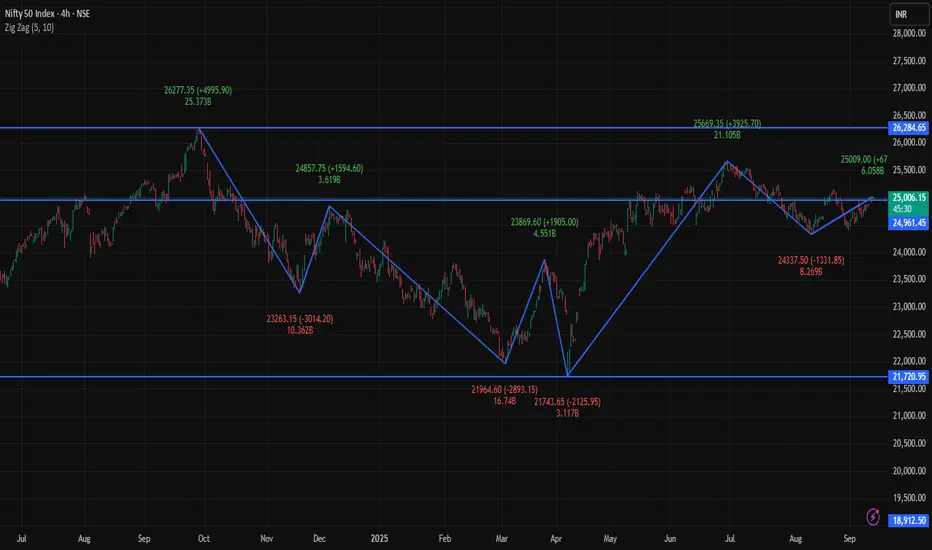
NIFTY 1D Time frame📊 Current Snapshot
Current Price: ₹25,022.20
Day’s Range: ₹24,973.00 – ₹25,035.00
Previous Close: ₹24,976.10
Opening Price: ₹24,991.00
Volume: Moderate
📈 Trend & Indicators
Trend: Neutral to mildly bullish; trading near short-term resistance.
RSI (14): Neutral zone.
MACD: Positive → indicating mild bullish momentum.
Moving Averages: Short-term averages indicate neutral to slightly bullish outlook.
🔮 Outlook
Bullish Scenario: Break above ₹25,050 with strong volume could target ₹25,100.
Bearish Scenario: Drop below ₹24,950 may lead to further decline toward ₹24,900.
Neutral Scenario: Consolidation between ₹24,950 – ₹25,050; breakout needed for directional move.
📌 Key Factors to Watch
Economic Indicators: Interest rates, inflation, and RBI policy updates.
Sector Performance: Trends in the IT and financial sectors.
Global Cues: Global market trends, US indices, crude oil, and currency movements.

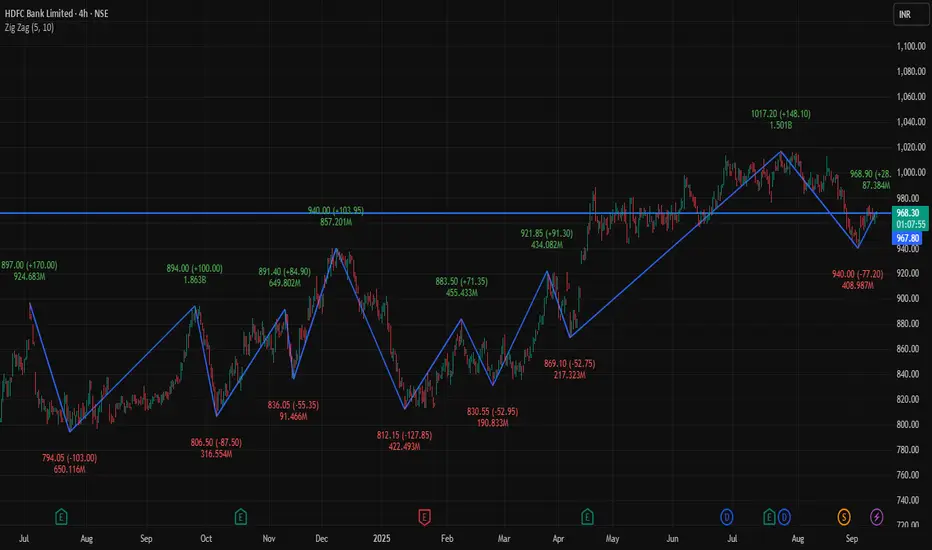
HDFCBANK 4Hour Time frame 📊 Current Snapshot
Current Price: ₹967.95
Day’s Range: ₹959.90 – ₹968.90
Previous Close: ₹965.90
Opening Price (4H): ₹960.30
Volume: Approximately 7.2 million shares
📈 Trend & Indicators
Trend: Neutral to mildly bullish; trading near short-term resistance.
RSI (14): Neutral zone.
MACD: Positive → indicating mild bullish momentum.
Moving Averages: Short-term averages indicate neutral to slightly bullish outlook.
🔮 Outlook
Bullish Scenario: Break above ₹968.90 with strong volume could target ₹975.00.
Bearish Scenario: Drop below ₹960.00 may lead to further decline toward ₹950.00.
Neutral Scenario: Consolidation between ₹960.00 – ₹968.90; breakout needed for directional move.
📌 Key Factors to Watch
Economic Indicators: Interest rates, inflation, and RBI policy updates.
Sector Performance: Trends in the banking sector.
Global Cues: Global market trends, US indices, crude oil, and currency movements.
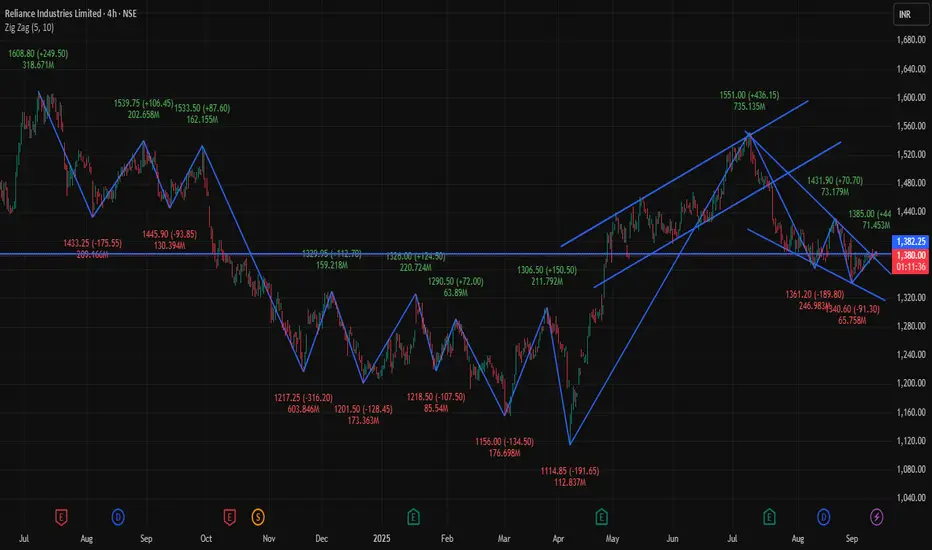
RELIANCE 4Hour 📊 Current Snapshot
Current Price: ₹1,380📈 Trend & Indicators
Trend: Neutral to mildly bullish; trading near short-term resistance.
RSI (14): Neutral zone.
MACD: Positive → indicating mild bullish momentum.
Moving Averages: Short-term averages indicate neutral to slightly bullish outlook.
🔮 Outlook
Bullish Scenario: Break above ₹1,385.50 with strong volume could target ₹1,390.00.
Bearish Scenario: Drop below ₹1,375.00 may lead to further decline toward ₹1,370.00.
Neutral Scenario: Consolidation between ₹1,375.00 – ₹1,385.50; breakout needed for directional move.
📌 Key Factors to Watch
Economic Indicators: Interest rates, inflation, and RBI policy updates.
Sector Performance: Trends in the energy and petrochemical sectors.
Global Cues: Global market trends, US indices, crude oil, and currency movements..90
Day’s Range: ₹1,375.00 – ₹1,385.50
Previous Close: ₹1,377.00
Opening Price (4H): ₹1,376.00
Volume: Approximately 371,445 shares traded
SENSEX 4Hour📊 Current Snapshot
Current Price: ₹81,561.00
Day’s Range: ₹81,235.42 – ₹81,643.88
Previous Close: ₹81,101.32
Opening Price (4H): ₹81,504.36
Volume: Approximately 6.16 million shares
📈 Trend & Indicators
Trend: Neutral to mildly bullish; trading near 50-hour and 200-hour moving averages.
RSI (14): Neutral zone.
MACD: Positive → indicating mild bullish momentum.
Moving Averages: Short-term averages indicate neutral to slightly bullish outlook.
🔮 Outlook
Bullish Scenario: Break above ₹81,643.88 with strong volume could target ₹81,917.15.
Bearish Scenario: Drop below ₹81,235.42 may lead to further decline toward ₹81,101.32.
Neutral Scenario: Consolidation between ₹81,235.42 – ₹81,643.88; breakout needed for directional move.
📌 Key Factors to Watch
Economic Indicators: Interest rates, inflation, and RBI policy updates.
Sector Performance: Trends in the IT and financial sectors.
Global Cues: Global market trends, US indices, crude oil, and currency movements.

HCLTECH 1D Time frame📍 Current Price Action
HCLTECH is trading around ₹1,464.
Day’s low is near ₹1,458, and high is around ₹1,470.
The stock is consolidating near the upper end of its intraday range.
⚖️ Key Levels
Immediate Resistance: ₹1,470 – ₹1,475
Next Resistance: ₹1,495 – ₹1,500
Immediate Support: ₹1,450
Strong Support: ₹1,430 – ₹1,420
📊 Indicators
Moving Averages: Short-term MAs (5-, 10-day) slightly lagging, medium-term (20-, 50-day) supportive → trend mildly bullish.
RSI (14-day): Around 66 → showing bullish momentum, approaching overbought.
MACD: Positive, indicating mild bullish bias, but momentum is not extremely strong.
📈 Outlook
If HCLTECH holds above ₹1,450, potential upside toward ₹1,470 – ₹1,495 exists.
A breakout above ₹1,475 could open room toward ₹1,500.
On the downside, a drop below ₹1,450 may test ₹1,430 – ₹1,420 support.
Overall bias: Slightly bullish, but caution near resistance.
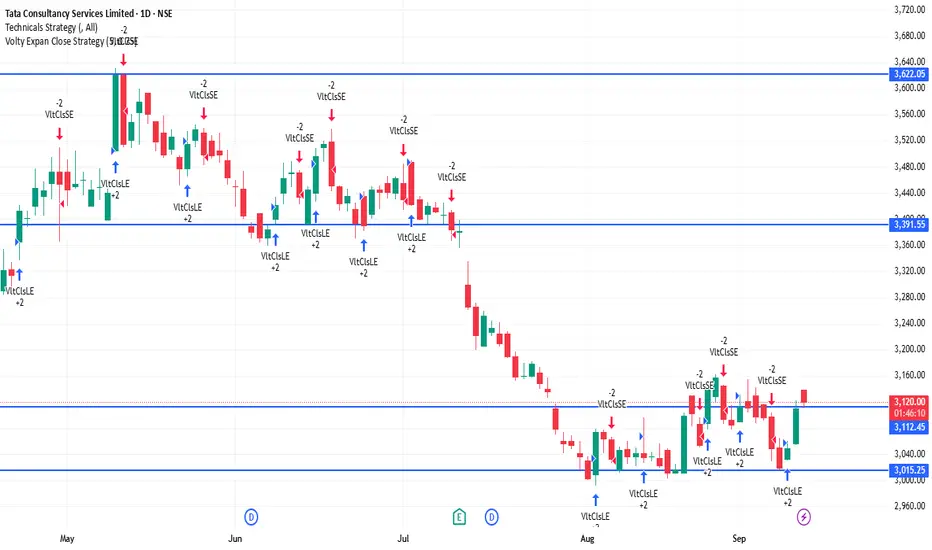
TCS 1D Time framePrice Action (Daily Chart)
Current price is around ₹3,117 - ₹3,120
Price is consolidating near support zones after a recent upward move.
Candle structure shows buying interest at lower levels, but resistance is capping the upside.
📊 Indicators
Moving Averages (MA):
Short-term MAs (5-day, 10-day) are slightly mixed.
Medium to long MAs (20, 50, 100, 200-day) are in buy zone, showing broader uptrend strength.
RSI (14-day): ~62-65 → indicates mild bullish momentum, not yet in overbought zone.
MACD: Shows positive crossover, momentum favors bulls but losing some strength.
⚖️ Key Levels
Immediate Resistance: ₹3,135 – ₹3,140
Next Resistance: ₹3,170 – ₹3,200
Immediate Support: ₹3,100 – ₹3,110
Strong Support: ₹3,050 – ₹3,000
📈 Outlook
Short-term sentiment: Neutral to slightly bullish as long as price holds above ₹3,100.
A breakout above ₹3,140 may open room toward ₹3,170–₹3,200.
A breakdown below ₹3,100 may drag price to ₹3,050–₹3,000.
Overall trend on daily timeframe is still uptrend, but near resistance, so caution is needed.
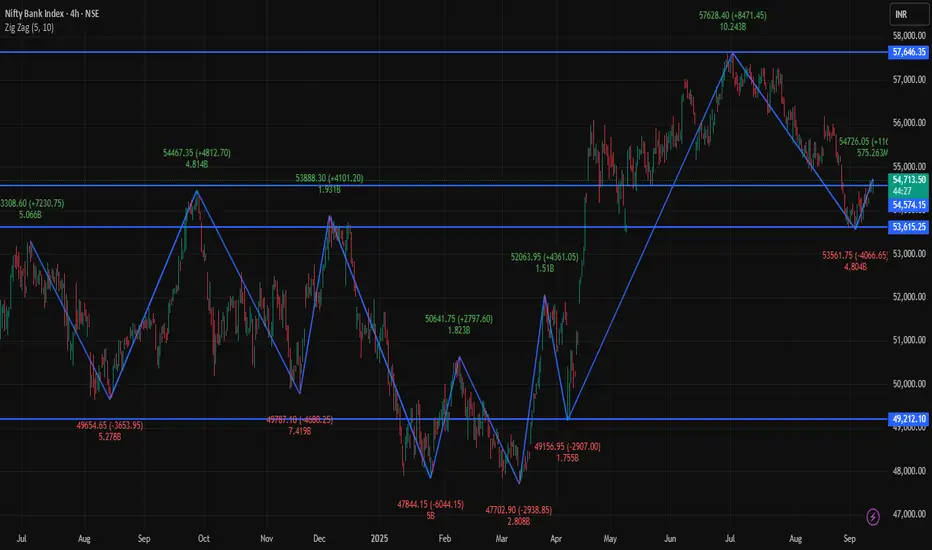
BANKNIFTY 4H Time frameCurrent Snapshot
Current Price around: ₹54,713 - ₹54,600
Day’s Range (4H): ₹54,400 – ₹54,705
Previous Close: ₹54,216
Opening Price (4H): ₹54,554
Volume: Moderate
🔑 Key Support & Resistance Levels
Immediate Support: ₹54,550
Next Support: ₹54,400
Immediate Resistance: ₹54,705
Next Resistance: ₹55,000
📈 Trend & Indicators
Trend: Mildly bullish; trading around 50-hour moving average.
RSI (14): 62 – Neutral to slightly bullish.
MACD: Positive → indicating mild bullish momentum.
Moving Averages: Short-term averages indicate neutral to slightly bullish bias.
🔮 Outlook
Bullish Scenario: Sustained move above ₹54,705 may push toward ₹55,000.
Bearish Scenario: Drop below ₹54,550 could bring a retracement to ₹54,400.
Neutral Scenario: Consolidation between ₹54,550 – ₹54,705; breakout needed for directional move.
📌 Key Factors to Watch
Performance of major banking stocks in BANKNIFTY.
Economic indicators such as interest rates and RBI policy updates.
Global market cues including US indices, crude oil, and currency movements.
NIFTY 4H Time frame📊 Current Snapshot
Current Price: ₹24,976 - ₹25,006
Day’s Range (4H): ₹24,945 – ₹25,008
Previous Close: ₹24,973
Opening Price (4H): ₹24,991
Volume: Moderate
🔑 Key Support & Resistance Levels
Immediate Support: ₹24,945
Next Support: ₹24,900
Immediate Resistance: ₹25,008
Next Resistance: ₹25,050
📈 Trend & Indicators
Trend: Neutral to mildly bullish; trading near 50-hour and 200-hour moving averages.
RSI (14): 61 – Neutral zone.
MACD: Positive → indicating mild bullish momentum.
Moving Averages: Short-term averages suggest neutral to slightly bullish outlook.
🔮 Outlook
Bullish Scenario: Break above ₹25,008 with strong volume could target ₹25,050.
Bearish Scenario: Drop below ₹24,945 may lead to further decline toward ₹24,900.
Neutral Scenario: Consolidation between ₹24,945 – ₹25,008; breakout needed for directional move.
📌 Key Factors to Watch
Overall market sentiment.
Economic indicators: interest rates, inflation, RBI updates.
Global cues: US indices, crude oil, and currency movements.