CASTROLIND : Contraction Before ExpansionNSE:CASTROLIND has express some better strength after a year long consolidation. What we can further observe with the current price action is as below.
Key Observations:
1. An attempt to escape from base consolidation as primary expressions.
2. The daily chart demonstrates a clear shift from a multi-month markdown into an aggressive expansion phase with expanded volume.
3. Price action has reclaimed short term EMA 20 and 50 but also long term EMA 100 and 200, signifies a short-to-medium-ter
Swingtradingsetups
POLYMED: Structural Breakout possibleNSE:POLYMED
Breakout & Expansion: The daily chart demonstrates a clear shift from a multi-month markdown into an aggressive expansion phase. The daily candle 11Aug ₹1,863.9 (+5.16%) cleanly breaks above the local hurdle/resistance zone around ₹1,820–₹1,840.
EMA Reclaim: Price action has reclaimed the 200 EMA (₹1,659), 50 EMA (₹1,660), and 20 EMA (₹1,734), signifying a short-to-medium-term alignment flip back to bullish.
Point of Interest (POI) & Liquidity: Before this breakout candle
Trendline Support + RSI Divergence: A Powerful ConfluencePrice respects structure, while momentum can reveal what candles alone may not show.
This video explains how trendline support and RSI divergence can combine to create an important technical confluence on a chart.
Charts used are older than 3 months . Educational purposes only
TATASTEEL: The Macro Staircase and Explosive High-Level Breakout1. The Macro Perspective: The Perfect Staircase
I am taking a LONG bias on Tata Steel Limited (TATASTEEL) on the daily (1D) timeframe.
When analyzing pure market structure, the healthiest and most sustainable trends do not go straight up in a single volatile line; they climb stairs. Look at the beautiful structural development on this chart. The stock established a rock-solid floor at the 164.46 line. From there, it rallied to the 185.36 line, paused to build a base, broke out, and used that 18
RELIANCE — Falling Wedge at the Apex, Yearly L4 Reclaimed Eight months of grinding lower since that January top near 1,600, and the whole thing has drawn itself into a textbook falling wedge. The range has squeezed from roughly 290 points down to about 95. We are at the apex. Something has to give. ⏳
🎯 The pivot story just got better. With the full yearly CPR on the chart, price has been trading below the entire 2026 value area all year. TC sits at 1,496.3, P at 1,422.2, BC at 1,348.1. Below that, L4 at 1,313.9 broke in February and capped the stock
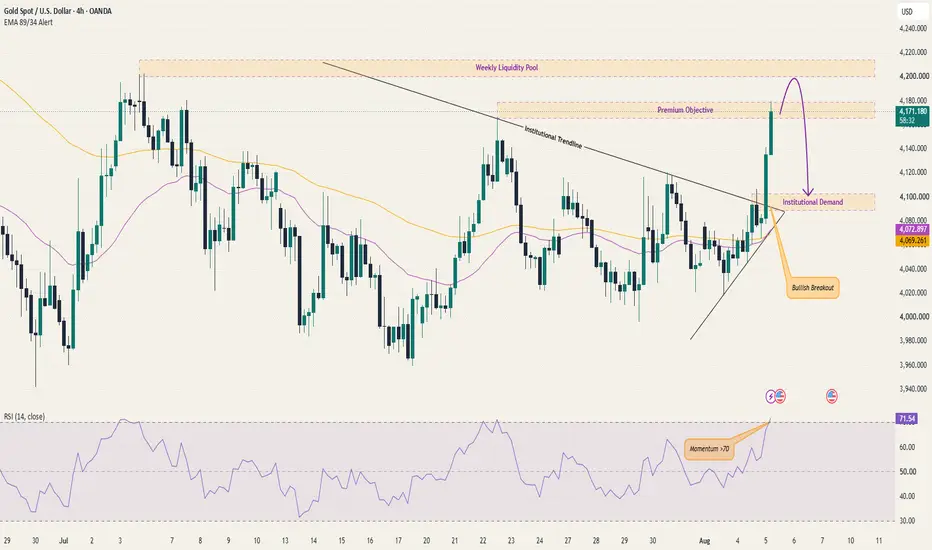
XAUUSD H1 — Liquidity Run in Focus
Gold has reached a one-month high as a softer US dollar, lower oil prices and declining Treasury yields strengthened demand for the metal. The latest JOLTS report also showed US job openings falling to 7.359 million, reinforcing signs of slower labor demand.
Attention now shifts to private employment data and the upcoming US payrolls report. Softer labor figures could maintain pressure on yields and support gold, while stronger results may trigger profit-taking after the recent expansion.
Tec
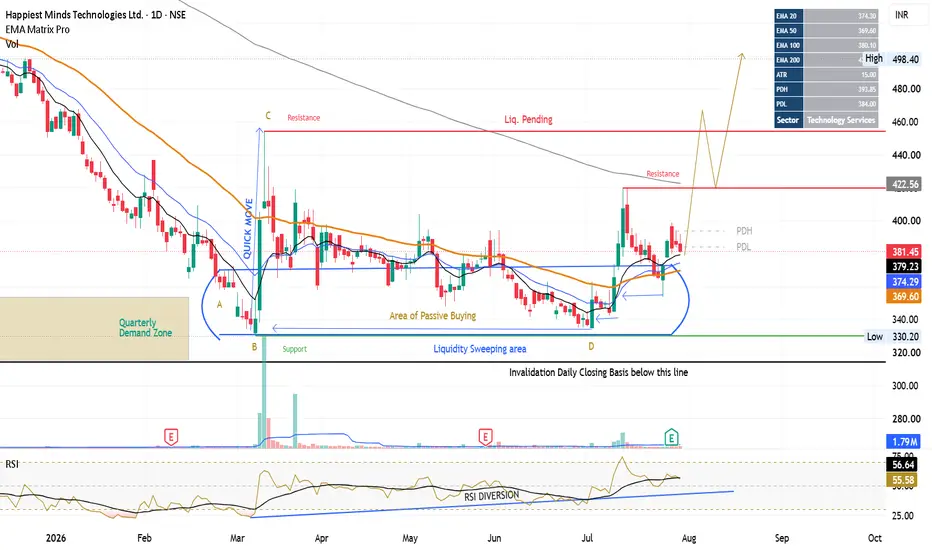
HAPPIESTMNDS: Accumulation Near QDZ | Momentum Building?NSE:HAPPSTMNDS
1. Structural Analysis & Price Action
⭐ Quarterly Demand Zone & Liquidity Sweep: The stock established a major floor in the ₹315 – ₹350 region (Quarterly Demand Zone). Point B represents a critical imbalance near ₹330, aggressively hunting sell-side liquidity before institutional buyers stepped in.
⭐ The Quick Vector Move (B to C): Following the imbalance at Point B, price produced a sharp impulse move ("QUICK MOVE") driving straight to Point C (~₹460.00). This rapid pric
Eternal Ltd Q1 FY27: Fundamentals Strong, Charts NeutralThis analysis is published solely for educational and informational purposes. The views expressed are based on publicly available information and technical chart analysis and should not be construed as investment advice, a recommendation, or an offer to buy or sell any financial instrument. Stock market investments are subject to market risks, and past performance does not guarantee future results. Investors and traders should conduct their own research and consult a SEBI-registered investment a
ADANIENT: Massive Trendline Break and Explosive Macro Breakout 1. The Macro Perspective: The Squeeze and The Floor
I am taking a LONG bias on Adani Enterprises Limited (ADANIENT) on the daily (1D) timeframe.
When analyzing pure market structure, the most violent reversals happen when a major descending trend is broken. Look at the structural development on the left half of this chart. The stock suffered a deep, agonizing markdown phase, with every attempted rally being aggressively swatted down by that massive descending black trendline. This brutal correc
IDEA: Massive Volume Breakout and Cup Completion1. The Macro Perspective: The Deep Washout and the Cup
I am taking a LONG bias on Vodafone Idea Ltd (IDEA) on the daily (1D) timeframe.
When analyzing pure market structure, the most reliable reversals occur when a stock forms a massive, rounded base. Look at the structural development on this chart. After a prior run-up, the stock suffered a deep, highly volatile markdown phase that dragged the price all the way down toward the 8.00 level. This brutal correction successfully washed out weak ha
HAL — Trendline Breakout Retest SetupHAL has given a strong recovery from the recent swing low near the 3,500–3,700 zone and is now trading above the long descending trendline that acted as resistance for several months.
Key observations:
The major descending trendline appears broken.
Price is attempting to sustain above the breakout zone.
Recent recovery shows strong bullish momentum.
Immediate resistance zone: 4,750–5,000
Major resistance zone: 5,200–5,600
Important support zone: 4,300–4,400
Breakdown below 4,250 may
RSI Divergence — A Price Action & Momentum Study📌What This Chart Is Showing
This is a purely observational, educational study combining classical chart pattern analysis, polarity zone behaviour, and RSI momentum divergence — all converging at the same structural area on the weekly timeframe. No forecast. No bias. Just what the chart is communicating through price and momentum.
📌The Descending Triangle — Historical Context
Going back 2–3 years, this chart carved out a well-defined descending triangle pattern — one of the most recognized struc
Evaluating Trend and Momentum Alignment with EMA & RSI🔎 Intro / Overview
This idea presents an EMA + RSI Alignment Framework designed to help traders understand market conditions rather than chase price movements.
Often, traders feel they have “missed the move”.
In most cases, this happens not because of late entries, but because market context was not clearly defined beforehand.
This framework focuses on evaluating trend direction and momentum quality first, so traders can better understand when conditions were supportive, unclear, or weakening
Market View & Trade PlanBased on current structure, NIFTY is trading inside a rising channel on both 5-minute and 15-minute timeframes, with short-term price action forming a potential bullish cup-and-handle pattern on the 5-minute chart. Momentum indicators and price behavior suggest a bias toward the upside as long as the index holds above the channel support zone. A buy-on-breakout can be considered above 26,175–26,185, with an initial stop loss below 26,110 (below the handle low and channel support). On confirmatio
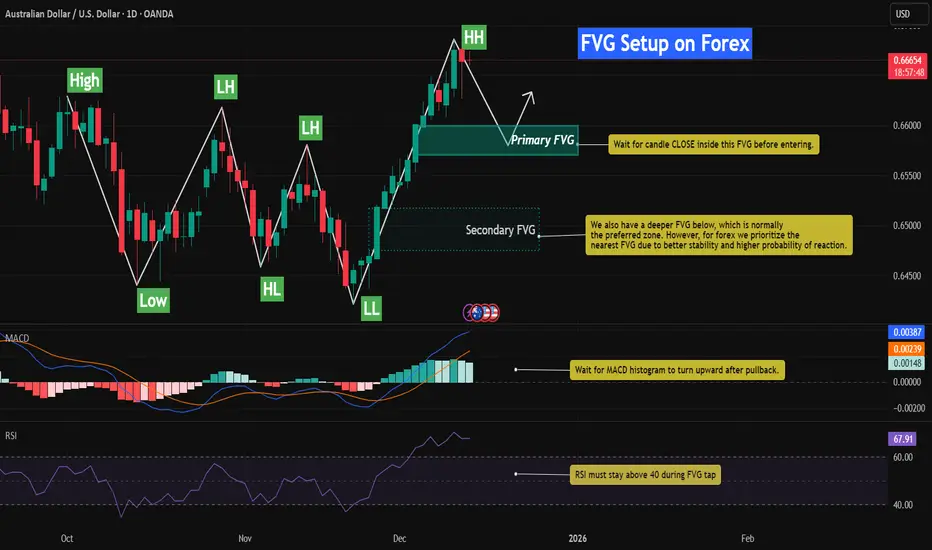
Bullish FVG Retracement With RSI & MACD📈 AUDUSD – Bullish FVG Retracement With RSI & MACD Momentum Confluence
This chart highlights a well-defined bullish structure on AUDUSD, characterized by a sequence of Higher Lows (HL) followed by a clean Higher High (HH). The latest impulsive leg upward created multiple Fair Value Gaps (FVGs), each formed by sharp displacement that left behind inefficiencies in price.
As price extends higher, the nearest unmitigated FVG becomes the primary area of interest. This imbalance represents the most
Coforge (D): Strongly Bullish, Triple Top BreakoutTimeframe: Daily | Scale: Linear
The stock has confirmed a major breakout from a 6-month consolidation structure. By closing above the triple-test resistance zone, the "bearish" triple top pattern has been invalidated and converted into a bullish breakout .
📈 1. The Long-Term Structure (The Reversal)
> The Cycle:
- Peak: ATH of ~2,005 in Dec 2024.
- Correction: A downward spiral until April 2025 .
- Turnaround: Since April, the stock has shifted structure to Higher
FVG Retracement With EMA, RSI & Fib Confluence📈 Bitcoin Chart – FVG Retracement With EMA, RSI & Fib Confluence in a Bearish Market Structure
This chart showcases a sustained bearish sequence on BTC, defined by a clean continuation of Lower Highs (LH) and Lower Lows (LL). Throughout this decline, multiple Fair Value Gaps (FVGs) have formed both locally and at higher levels — each created by strong institutional sell-side displacement.
As price trends downward, these unmitigated FVGs above the market consistently act as magnet zones:price
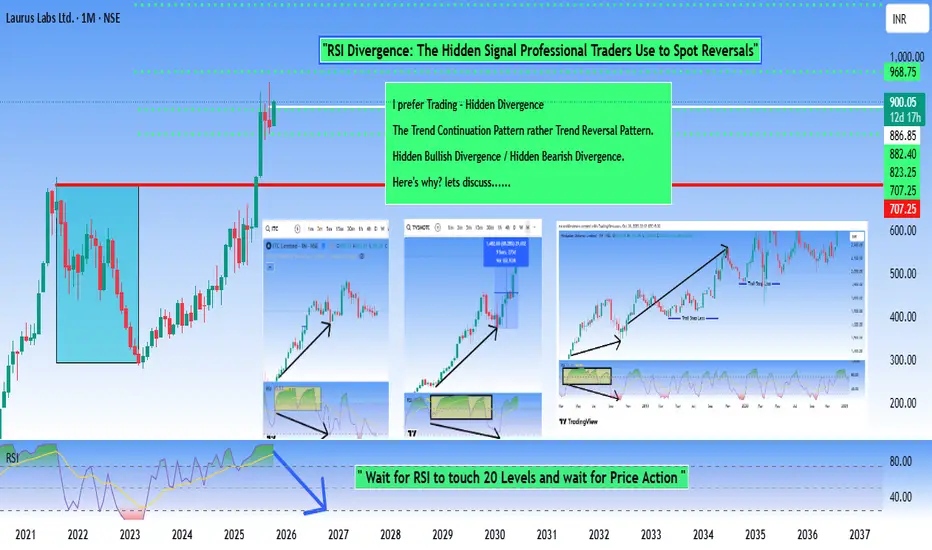
Hidden Signal Professional Traders Use to Spot ReversalsRSI divergence is a technical analysis tool used to identify potential reversals or weakening momentum in price trends.
Here's how it works:
RSI (Relative Strength Index) Divergence occurs when the price of an asset moves in one direction while the RSI indicator moves in the opposite direction.
This disconnect between Price action and Momentum is what traders find significant.
Bullish / Bearish Divergence - This Divergence occurs at the end of a trend, be it Bullish or Bearish Trend.
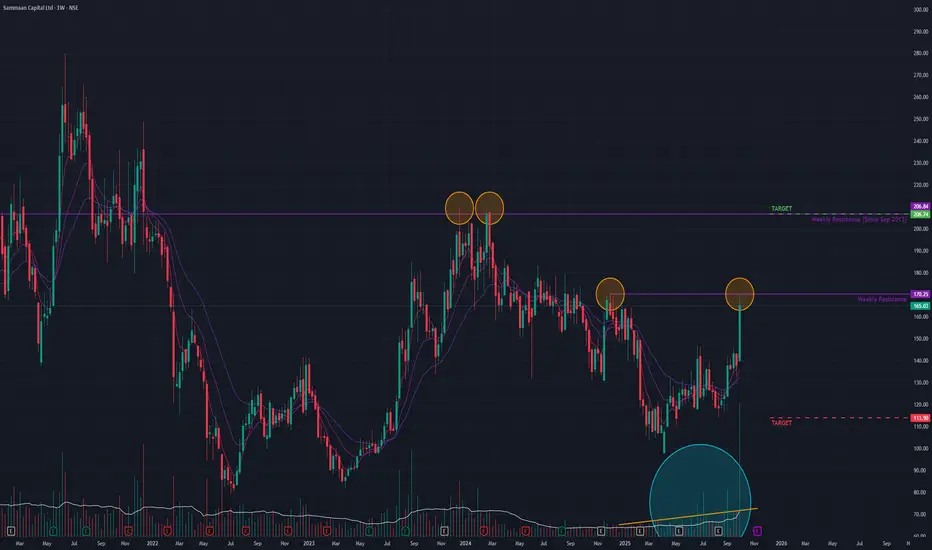
Sammaan Cap (W) - Poised for a Potential BreakoutAfter a prolonged downtrend that began in August 2018, Sammaan Capital transitioned into a sideways consolidation phase starting in March 2020.
Recently, the stock has shown significant bullish intent. Last week, it surged by +19.74% , accompanied by an exceptionally high volume spike of 462.74 million shares . This powerful move brought the price to the brink of breaking out from a key short-term resistance trendline.
Several technical indicators support a bullish outlook:
- Moving Avera
Shyam Metalics & Energy Crossing Key Levels.NSE:SHYAMMETL today gave almost a 9% Move Closing above key levels and making new Swing Highs on the back of the News of Business update of Jan Month.
JANUARY STAINLESS STEEL SALES VOLUMES UP 59% YOY
JANUARY SPONGE IRON SALES VOLUMES UP 1% YOY
About:
NSE:SHYAMMETL is primarily engaged in manufacturing steel and allied products including pellets, sponge iron, TMT and long products, ferroalloys and power generation.
Trade Setup:
It could be a Good 1:1 Positional Trade as it made a Good B
GMDC - Chart of The Week, Testing Trendline, Change of PolarityNSE:GMDCLTD has a beautiful structure on the Weekly Timeframe to qualify for my Chart of the Week idea. It saw Decent Above-Average Volumes and confirmed a Change of Polarity and is Now Testing the Falling Trendline with RSI and MACD trending upwards.
About:
NSE:GMDCLTD is primarily engaged in 2 sectors, i.e. mining and power. Its projects include Lignite, Bauxite, Fluorspar, Multi-Metal, Manganese, Power, Wind and Solar.
Trade Setup:
It could be a good Swing Trade if it breaks the tren
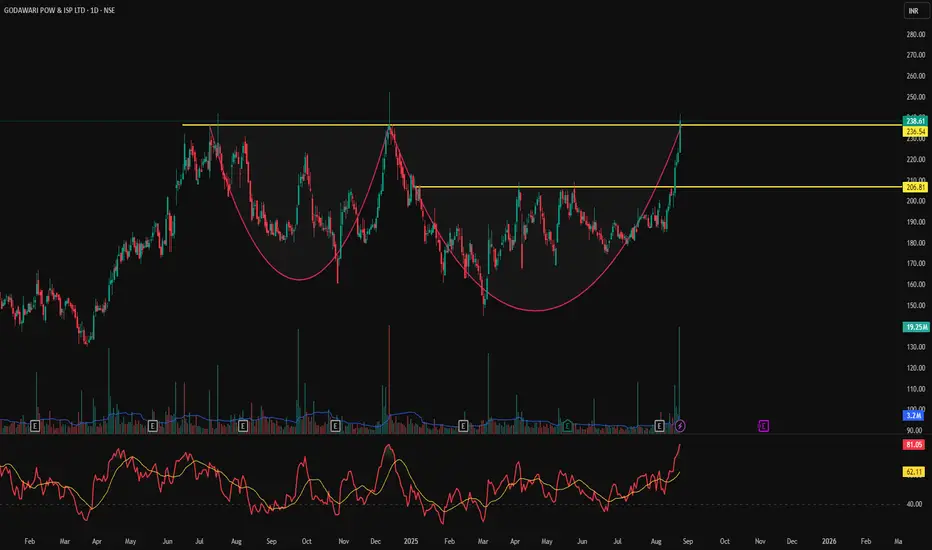
GPIL - Cup & Handle Breakout | Daily Chart📊 GPIL – Cup & Handle Breakout with Explosive Volume | RSI > 80
📅 Chart Date: August 24, 2025
📍 CMP: ₹238.61 (+6.91%)
📈 Symbol: NSE:GPIL | 1D Timeframe
🔍 Technical Analysis
☕ Cup & Handle Breakout
A multi-month Cup & Handle pattern has been completed.
Price gave a strong breakout above the neckline zone ₹206.81.
Next supply zone is around ₹236–₹240, which is being tested.
💥 Volume Confirmation
Relative Volume (RVol): 842% 🔥
Today’s volume 19.25M vs avg 3.2M — heavy institutional buying.
📈 RSI