Silver Bullish Breakout on Monthly & Weekly CharPattern Formed: Symmetrical Triangle (Long-Term Consolidation)
Breakout Type: Bullish Breakout on Monthly & Weekly Chart
Volume Confirmation: Strength in breakout with price expansion
Measured Move Target: ~$44 (based on triangle height projection)
Immediate Resistance Zone: $44.11 (Historical supply zone)
Support Levels Post-Breakout:
Immediate Support: $34.78
Strong Support: $33.28
Symmetrical Triangle

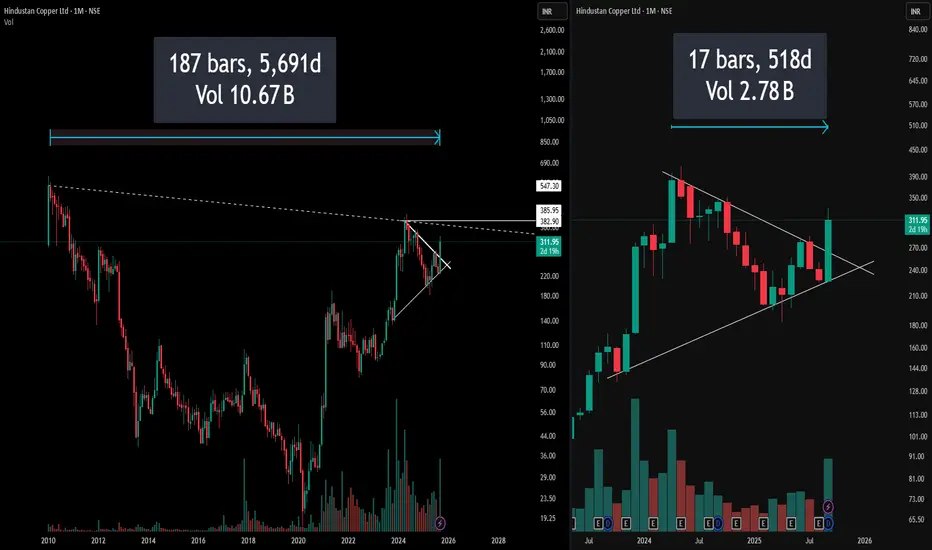
5000 Days vs 500 Days of Data : Which is better ?Most traders jump straight into attractive chart patterns and impulsively take trades, ignoring the bigger picture. Here’s a powerful case study
Left Side: Full Monthly Chart with Hidden Resistance
On the left, the chart captures over a decade of price action, immediately drawing attention to a long-standing downward-sloping resistance stretching from all-time highs. This hidden resistance line is not visible on the usual zoomed-in view, yet it presents a formidable barrier that traders often neglect.
(Pro Insight: Always extend trendlines and resistance zones till the inception of the instrument for real swing perspective)
(Risk Reminder: What looks like a clear breakout on a recent timeframe may actually be approaching a multi-year resistance trap)
Right Side: Symmetrical Triangle – The Pattern Focus
The right segment restricts focus to the last few years, zooming in on a visually perfect symmetrical triangle. While the setup looks neat and promising—indicating contraction and likely expansion ahead—this trimmed view risks obscuring the bigger, hidden resistance directly overhead.
Disclaimer: This post reflects technical views for educational purposes only, not investment advice. Always perform your own due diligence before trading.
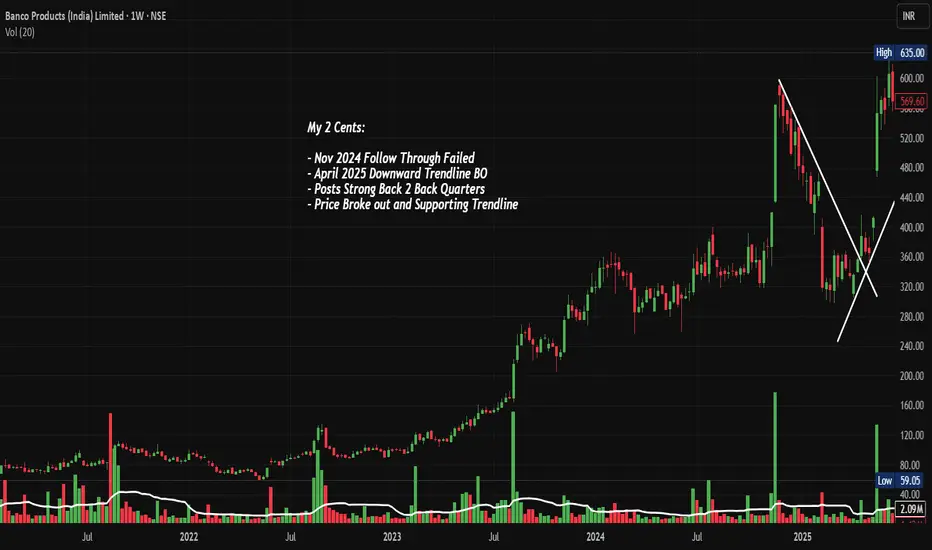
BANCOINDIA: BO after Consolidation, Chart of the WeekBanco Products Broke Out From a Consolidation, Continuing Its Massive Bull Run. Let's analyse in "Chart of the Week"
As per the Latest SEBI Mandate, this isn't a Trading/Investment RECOMMENDATION nor for Educational Purposes; it is just for Informational purposes only. The chart data used is 3 Months old, as Showing Live Chart Data is not allowed according to the New SEBI Mandate.
Disclaimer: "I am not a SEBI REGISTERED RESEARCH ANALYST AND INVESTMENT ADVISER."
This analysis is intended solely for informational purposes and should not be interpreted as financial advice. It is advisable to consult a qualified financial advisor or conduct thorough research before making investment decisions.
Price Action Analysis:
- Banco Products has completed a consolidation phase
- The stock has demonstrated exceptional momentum with a breakout above the ₹400 levels in April 2024
- Current trading price of ₹835.60 represents a gain of over 100% from the breakout point
- Price action shows strong institutional accumulation with increasing volumes during upward moves
Volume Spread Analysis
- Volume spikes are clearly visible during key breakout moments, particularly in Q2 2024
- The highest volume bars (green) coincide with price advances, indicating genuine buying interest
- Recent volume of 36.75M shares traded shows sustained institutional participation
- Volume patterns suggest smart money accumulation rather than retail speculation
Key Technical Levels:
Base Formation:
- Multi-year base formed between ₹100-400 levels from 2022 to early 2024
- This represents a classic cup and handle pattern on the weekly timeframe
- The base provided strong support and allowed for institutional accumulation
- Depth of base (approximately 18 months) suggests a strong foundation for future moves
Support Levels:
- Primary Support: ₹650-680 (previous resistance turned support)
- Secondary Support: ₹550-580 (50% retracement of recent rally)
- Major Support: ₹400-420 (breakout zone)
- Ultimate Support: ₹300 (top of multi-year base)
Resistance Levels:
- Immediate Resistance: ₹850-870 (current highs)
- Next Resistance: ₹950-1000 (psychological round number)
- Extended Resistance: ₹1200-1250 (measured move from base)
Position Sizing:
- Allocate a maximum of 3-5% of the portfolio to a single stock
- Use the pyramiding approach: 50% on initial entry, 25% on confirmation, 25% on extension
- Risk per trade should not exceed 2% of total capital
Risk Management Rules:
- Honour stop-losses strictly without emotional interference
- Book partial profits at predetermined levels
- Reduce position size if the stock shows signs of distribution
- Monitor sector rotation and overall market conditions
Sectoral and Fundamental Backdrop:
Auto Components Sector Overview:
- India's auto component industry is driving macroeconomic growth, with the market estimated to grow by USD 259.03 billion from 2025 to 2029 at a CAGR of 37%
- The auto components sector achieved 32.8% growth in FY24, with optimism for continued strong performance
- Export revenues could soar to $100 billion by 2030 from $21 billion in 2024, at a 30% CAGR
Fundamental Strengths of Banco Products:
- Market Cap of ₹11,952 crores with revenue of ₹3,379 crores and profit of ₹433 crores
- Leading manufacturer and exporter of automotive and industrial gaskets, heat shields, and sealing solutions since 1961
- Promoter holding at 67.88% shows strong management confidence
Growth Catalysts:
- Expanding electric vehicle segment creating new opportunities
- Sector attracted ₹2,45,771 crore FDI between April 2000 and December 2024
- Export potential with global OEM partnerships
- Various Indian auto component manufacturers are entering joint ventures with foreign companies for domestic production
Risks and Challenges:
- Commodity price fluctuations affecting margins
- Global economic slowdown impacting export demand
- Competition from Chinese manufacturers
- Trading at 9.17 times book value indicates a premium valuation
Market Outlook:
Short-term Outlook (1-3 months):
- Expect consolidation in the ₹750-870 range
- Watch any dip below ₹700
- Watch for a breakout above ₹870 for the next leg up
Medium-term Outlook (3-12 months):
- Sustained institutional interest expected
- Earnings growth should support price appreciation
Long-term Outlook (1-3 years):
- Export opportunities provide additional upside
- EV transition could create new revenue streams
- Sector leadership position makes it a preferred play in the auto components space
Full Coverage on my Newsletter this Week
Keep in the Watchlist and DOYR.
NO RECO. For Buy/Sell.
📌Thank you for exploring my idea! I hope you found it valuable.
🙏FOLLOW for more
👍BOOST if you found it useful.
✍️COMMENT below with your views.
Meanwhile, check out my other stock ideas on the right side until this trade is activated. I would love your feedback.
As per the Latest SEBI Mandate, this isn't a Trading/Investment RECOMMENDATION nor for Educational Purposes; it is just for Informational purposes only. The chart data used is 3 Months old, as Showing Live Chart Data is not allowed according to the New SEBI Mandate.
Disclaimer: "I am not a SEBI REGISTERED RESEARCH ANALYST AND INVESTMENT ADVISER."
This analysis is intended solely for informational purposes and should not be interpreted as financial advice. It is advisable to consult a qualified financial advisor or conduct thorough research before making investment decisions.
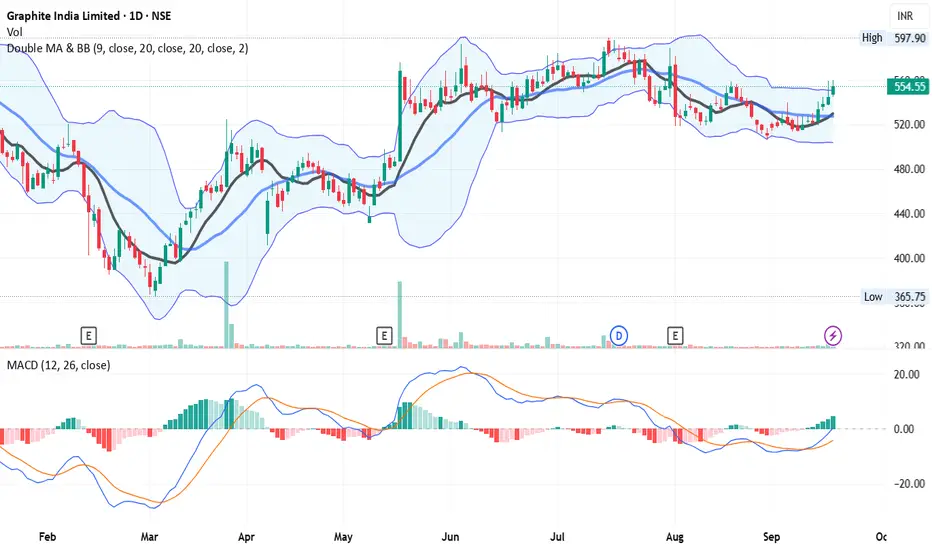
Breakout - Looks Good On Chart - GRAPHITE📊 Script: GRAPHITE
📊 Industry: Industrial Products (Electrodes & Refractories)
Key highlights: 💡⚡
📈 Script is trading at upper band of BB.
📈 MACD is giving crossover .
📈 Crossover in Double Moving Averages.
📈 Right now RSI is around 63.
📈 One can go for Swing Trade.
📈 In Monthly Chart It Script is forming Symmetrical triangle and about to give breakout, we can see good rally in future.
⏱️ C.M.P 📑💰- 555
🟢 Target 🎯🏆 - 578 / 597
⚠️ Stoploss ☠️🚫 - 539
⚠️ Important: Always maintain your Risk & Reward Ratio.
✅Like and follow to never miss a new idea!✅
Disclaimer: I am not SEBI Registered Advisor. My posts are purely for training and educational purposes.
Eat🍜 Sleep😴 TradingView📈 Repeat 🔁
Happy learning with trading. Cheers!🥂
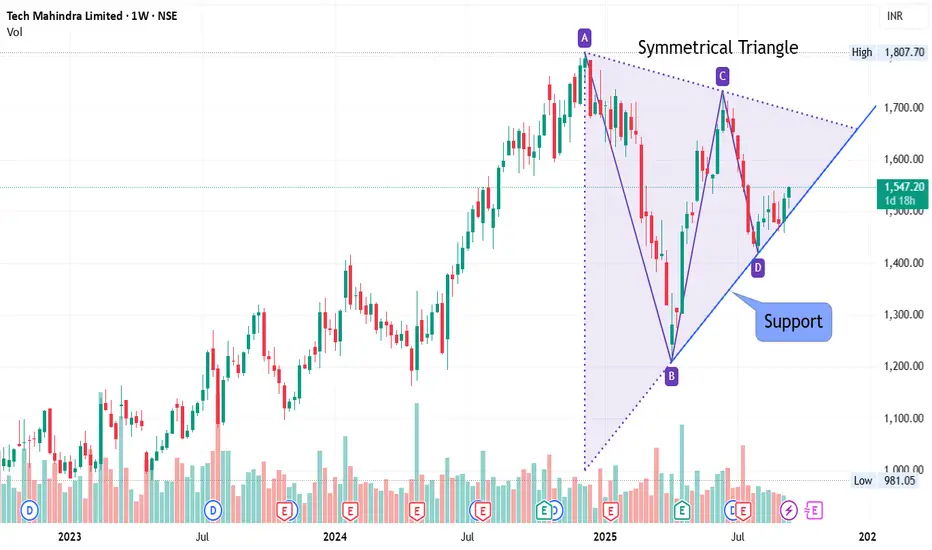
At Support - Weekly Chart - TECHM📊 Script: TECHM
📊 Industry: IT - Software (Computers - Software & Consulting)
Key highlights: 💡⚡
📈On Weekly Chart Script is forming symmetrical triangle and trading near support line.
📈 Script is trading at upper band of BB.
📈 MACD and Double Moving Averages are giving Crossover
📈 Right now RSI is around 58.
📈 One can go for Swing Trade.
⏱️ C.M.P 📑💰- 1547
🟢 Target 🎯🏆 - 1612 / 1655
⚠️ Stoploss ☠️🚫 - 1499
⚠️ Important: Always maintain your Risk & Reward Ratio.
✅Like and follow to never miss a new idea!✅
Disclaimer: I am not SEBI Registered Advisor. My posts are purely for training and educational purposes.
Eat🍜 Sleep😴 TradingView📈 Repeat 🔁
Happy learning with trading. Cheers!🥂
Eris Lifesciences Ltd: Symmetrical Triangle FormationEris Lifesciences Ltd . is currently exhibiting a Symmetrical Triangle Pattern on its daily chart. This pattern is characterized by converging trendlines formed by lower highs and higher lows, indicating a period of consolidation. While symmetrical triangles often serve as continuation patterns, they can also signal potential reversals, depending on the breakout direction.
The pattern's apex is approaching, suggesting that a breakout—either upward or downward—is imminent. It's crucial to monitor the breakout closely, as the direction will determine the subsequent trading strategy.
📉 RSI Analysis: Indicating Sideways Momentum
The RSI for Eris Lifesciences is currently below 50, indicating a neutral to bearish momentum. This suggests that the stock is in a sideways trend, with neither bulls nor bears gaining a clear advantage. Such conditions are typical during consolidation phases, reinforcing the current symmetrical triangle pattern.
🕯️ Candlestick Insight: Doji Formation
Recently, multiple doji candlestick with long legs has formed, signaling indecision in the market. A Doji occurs when the opening and closing prices are nearly identical, reflecting a balance between buying and selling pressures. The long wicks indicate that both bulls and bears attempted to take control but failed, leaving the market in a state of equilibrium.
This formation suggests that significant market participants are awaiting a catalyst to drive the next move, making it a critical point to observe for potential breakout confirmation.
🧠 Strategic Outlook: Awaiting Breakout Confirmation
Given the current technical indicators—a symmetrical triangle pattern, neutral RSI, and a doji candlestick—it's prudent to adopt a wait-and-see approach. The next significant move will depend on the breakout direction from the triangle:
Bullish Scenario: A breakout above the upper trendline, accompanied by increased volume and a rising RSI, would suggest a continuation of the uptrend. Bearish Scenario: Conversely, a breakdown below the lower trendline, with declining volume and a falling RSI, would indicate a potential reversal to the downside.
In both scenarios, it's essential to wait for confirmation through volume and momentum indicators before entering a position.
📌 Conclusion
Eris Lifesciences Ltd. is at a pivotal juncture. The formation of a symmetrical triangle, coupled with a neutral RSI and a doji candlestick, points to a period of consolidation. Traders should remain vigilant for a breakout in either direction, using volume and momentum indicators to confirm the move before making trading decisions.
As always, it's advisable to conduct thorough research and consider consulting with a financial advisor before making any investment decisions.

Breaking Out of Falling Wedge and Symmetrical TriangleNSE:SYRMA is breaking out of Falling Wedge and Symmetrical Triangle Breakout on Weekly TF. With 2nd Best Weekly Volumes.
NSE:SYRMA is a Chennai-based engineering and design company engaged in electronics manufacturing services (EMS). The company provides integrated services and solutions to original equipment manufacturers (OEMs) from the initial product concept stage to volume production through concept co-creation and product realization.
Recently it posted good Q2 FY 24-25 Results, posting a 30% Y/Y rise in Q2 consol profit after tax. The auto and healthcare businesses led growth in Q2 and will drive future growth further ahead. Also, expect a recovery in margins fuelled by higher exports and design and manufacturing businesses. NSE:SYRMA faces margin challenges as the consumer segment, which comprises 35%—38% of topline, operates with lower margins, and they are aiming to lower the segment's share further.
One can wait for a retracement or ride the momentum with the current week candle as stop loss.
🙋♀️🙋♂️If you have any questions about this stock, feel free to reach out to me.
📌Thank you for exploring my idea! I hope you found it valuable.
🙏FLLOW for more
👍BOOST if useful
✍️COMMENT Below your views.
Meanwhile, check out my other stock ideas below until this trade is activated. I would love your feedback.
Disclaimer: This analysis is intended solely for informational and educational purposes and should not be interpreted as financial advice. It is advisable to consult a qualified financial advisor or conduct thorough research before making investment decisions.

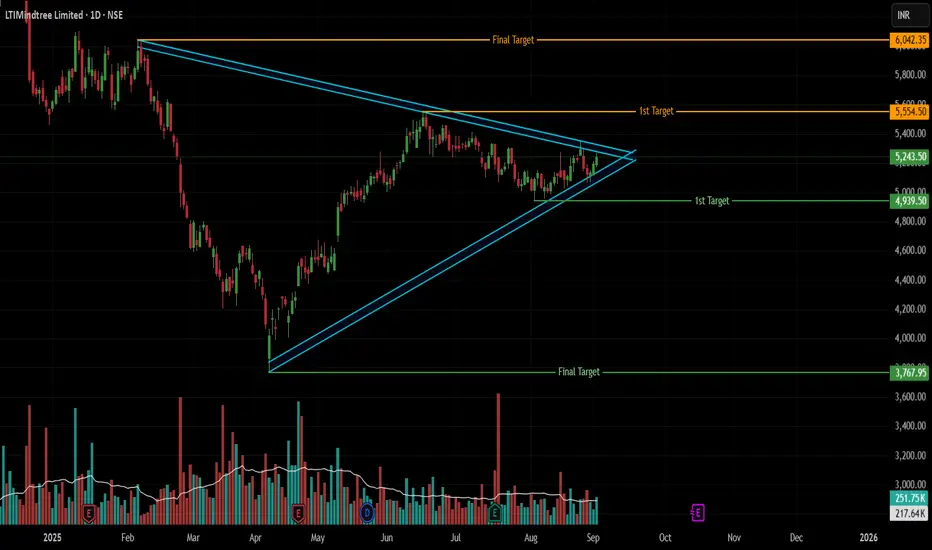
LTIM: The Final Squeeze – Breakout or Breakdown?LTIMINDTREE: The Big Squeeze! ⚡ Which Way? 🐂🐻
Timeframe: Daily
Trade Type: Swing/Positional
Pure Price Action Setup: LTIMINDTREE is compressing into a textbook Symmetrical Triangle on the daily chart. This is a classic consolidation pattern where the market is building energy for a significant breakout. Volatility is collapsing into a tight apex!
Key Decision Levels:
Bullish Trigger: A decisive daily close above 5350 (the recent upper trendline resistance).
Bearish Trigger: A decisive daily close below 5067 (the rising lower trendline support).
The Trade Plan:
👉 BULLISH BREAKOUT Scenario 🐂
Entry: On a close above 5350.
Confirmation: A significant increase in volume on the breakout candle should confirm buyer commitment.
Target 1: 5554 (Previous major high)
Final Target: 6042 (All-Time High & Pattern Confluence)
SL: Below the breakout candle or the lower trendline.
👉 BEARISH BREAKDOWN Scenario 🐻
Entry: On a close below 5067.
Confirmation: A noticeable spike in volume on the breakdown would validate seller dominance.
Target 1: 4939 (Initial support zone)
Final Target: 3767 (Major Swing Low & Pattern Confluence)
SL: Above the breakdown candle or the upper trendline.
Pattern Depth & Significance:
The triangle's maximum depth is measured from its origin: the high of 6042 (Feb 5) to the low of 3767 (Apr 7).
This is a 2,275-point range.
In percentage terms, that's a ~60.3% move from high to low.
Why this matters: The energy stored in a pattern of this scale suggests the resulting breakout could be powerful and sustained. Always trail your stop loss after Target 1 is hit! 🔒
Risk Management is NON-NEGOTIABLE!
This is a high-risk, high-reward setup. Your stop loss is your best friend.
📜 Disclaimer: This is an educational example of technical analysis and NOT financial advice. Trading carries a high level of risk. You should consider whether you can afford to take the risk of loss. Perform your own research before making any trade decisions.
Like & Boost if this clear analysis helps you! ✅
Follow for more pure price action trade ideas! 😊
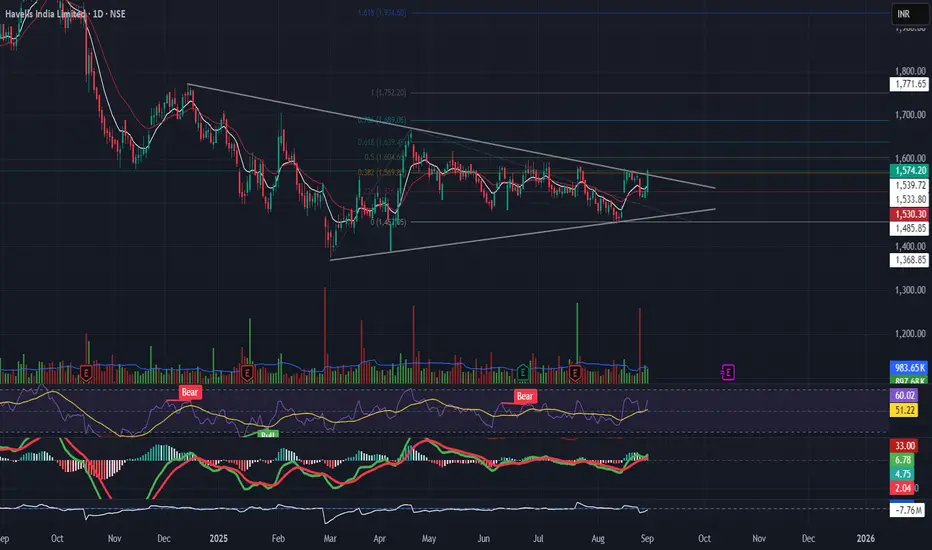
Havells breakout from symmetrical triangle patternHavells had Breakout from symmetrical triangle at the ₹1,570 descending resistance. RSI near 60, MACD recovering and moving up. Watch for volume-backed breakout.
Breakout above can fuel a move to ₹1,690–₹1,750.
Stop near ₹1,485.
🔌 Electrical sector needs confirmation for momentum entry."
Kaynes Technology is at a crucial breakout zone:
Setup: Price consolidating within a symmetrical triangle, now testing the upper trendline.
Indicators:
RSI ~58, just entering bullish zone, but not overbought.
MACD turning positive → momentum aligning with trend.
EMAs: 20 & 50 EMA aligned upward; price holding above 6,000.
Levels:
Targets: ₹6846 , ₹7,203, ₹7711
Stoploss: ₹6190
👉 Outlook: Break and sustain above ₹6,500 can trigger fresh momentum towards ₹7,000+. Support at ₹6190 is critical.

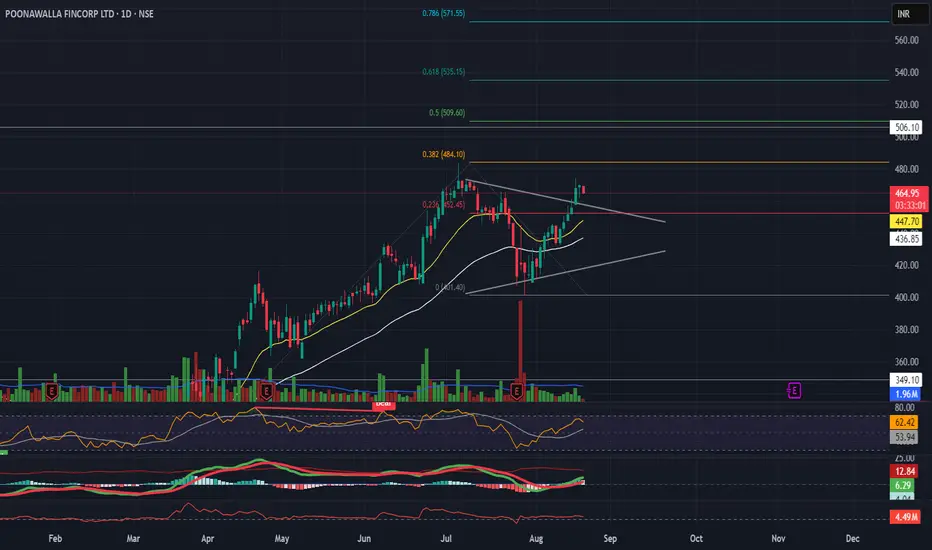
Poonawalla Fincorp showing a symmetrical triangle breakout:
Setup: Clear breakout above trendline resistance on daily chart.
Indicators:
RSI at 62 → momentum strong, near overbought but not overheated.
MACD bullish crossover with positive histogram.
EMAs: 20 & 50 EMA slope positive; price sustaining above both.
Levels:
Stoploss: ₹445
Targets: ₹509 immediate, then ₹535
👉 Outlook: Strong bullish bias. Sustaining above ₹473 opens path towards ₹500–506 zone. Support at ₹445.
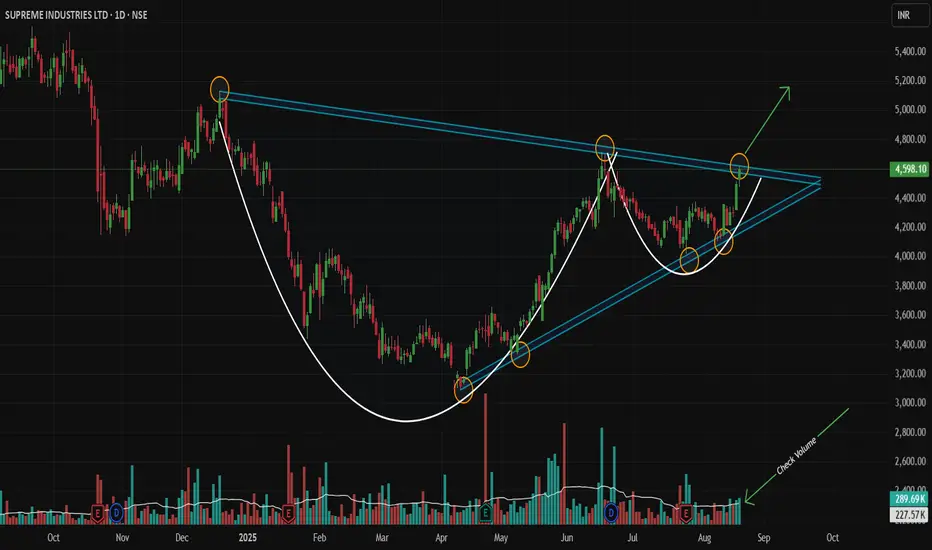
Nested Bullish Patterns Signal Major Breakout!Script: NSE:SUPREMEIND | Timeframe: Daily | Analysis Type: Technical (Pure Price Action) | Patterns: Symmetrical Triangle + Cup & Handle
Idea Summary 💡
A powerful, nested pattern setup is concluding on the daily chart! A large Symmetrical Triangle contains a secondary Cup and Handle (Bullish) pattern. This rare confluence signals strong accumulation and suggests an imminent, powerful upside breakout is likely!
Chart Pattern Logic 🔍
Primary Pattern (Symmetrical Triangle): Characterized by descending resistance (highs: Dec-18-2024, Jun-17-2025) and ascending support (lows: Apr-9-2025, May-9-2025, Jul-24-2025).
Secondary Pattern (Cup & Handle): Formed entirely within the triangle, adding a potent layer of bullish confirmation.
Confluence: This pattern-within-a-pattern setup significantly amplifies the potential for a strong upward resolution.
Trade Thesis 📈
Price is coiling at the triangle's apex under immense pressure. A decisive break above the upper trendline could ignite the next major bullish impulse phase.
Trade Setup ⚡
Direction: LONG 🟢
Entry Trigger: WAIT for a strong Marubozu green candle 🕯️ to close above the triangle's trendline on high volume (min. 1.5x average).
Stop Loss: Below the low of the breakout candle. 🛑
Profit Targets: 4700 🎯 | 4800 🎯 | 5125 🎯
Long-Term Target: 6000+ (Extended Target Based on Pattern Confluence & Momentum) 🚀
Risk Management: Trail stops aggressively after Target 1.
Got another stock you want me to break down? 📊
Drop the ticker in the comments below! If you found this idea useful, like and follow for more pure price action analysis.
Disclaimer: This post/information is solely for educational purposes and should not be construed as a recommendation or financial advice. Trading carries a risk of loss. Please conduct your own research or consult a financial advisor before making any investment decisions. The author and TradingView are not liable for any financial losses incurred based on this content.
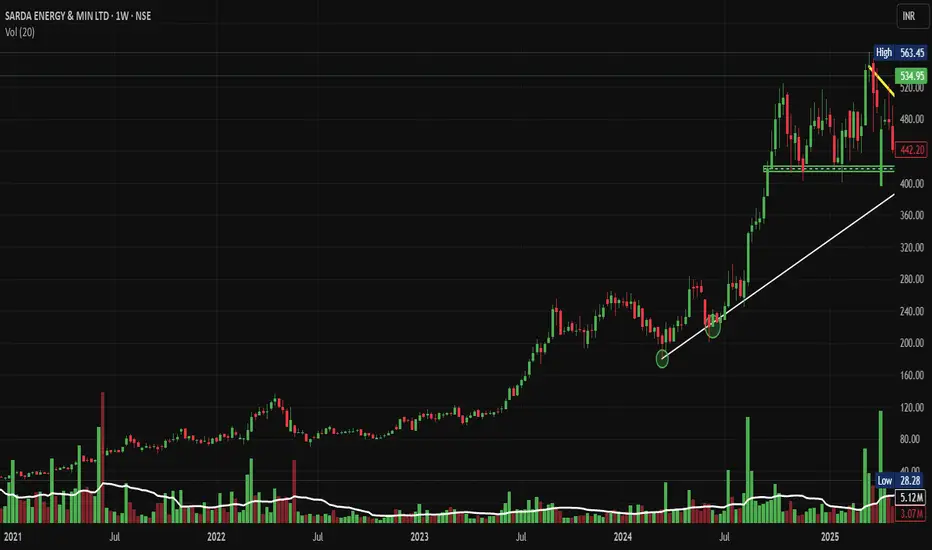
SARDAEN: Triangle Breakout, Chart of the WeekWhy NSE:SARDAEN Triangle Breakout Could Signal the Next Big Move in it, let's analyze in "Chart of the Week" Post Strong Q1 FY26 Results
As per the Latest SEBI Mandate, this isn't a Trading/Investment RECOMMENDATION nor for Educational Purposes, it is just for Informational purposes only. The chart data used is 3 Months old, as Showing Live Chart Data is not allowed according to the New SEBI Mandate.
Disclaimer: "I am not a SEBI REGISTERED RESEARCH ANALYST AND INVESTMENT ADVISER."
This analysis is intended solely for informational purposes and should not be interpreted as financial advice. It is advisable to consult a qualified financial advisor or conduct thorough research before making investment decisions.
Price Action Analysis:
• Stock has exhibited a strong uptrend from 2022 lows around ₹120-140 to current levels of ₹534.95
• Major rally phase from mid-2023 onwards, gaining over 300% in approximately 18 months
• Current consolidation phase since late 2024, around ₹400-600 range, indicates institutional accumulation
• Recent price action shows formation of higher lows with resistance being tested multiple times
Volume Spread Analysis:
• Volume spikes during major breakout moves confirm institutional participation
• Recent consolidation accompanied by relatively lower volumes, typical of the accumulation phase
• Volume breakout above 7.11M suggests renewed interest at current levels
• Volume pattern supports the bullish bias with buying interest on dips
Key Technical Levels:
Base Formation:
• Primary base established between ₹400-₹430 levels during 2024 consolidation
• Secondary base forming at ₹480-₹500 range as recent support
• Base width of approximately 8-10 months indicates a strong foundation for the next leg up
Support Levels:
• Immediate Support: ₹480-₹500 (recent swing lows and 50-day moving average area)
• Strong Support: ₹420-₹440 (previous resistance turned support)
• Major Support: ₹380-₹400 (long-term trend line support and 200-day moving average)
Resistance Levels:
• Immediate Resistance: ₹560-₹580 (recent highs and psychological level)
• Major Resistance: ₹600-₹620 (all-time high zone and round number resistance)
• Extended Resistance: ₹680-₹720 (measured move projection from triangle pattern)
Technical Pattern Recognition
Symmetrical Triangle Pattern:
• Clear triangle formation visible from the chart with converging trend lines
• Triangle spans approximately 8-10 months, indicating a significant pattern
• Breakout direction typically follows the prevailing trend (bullish in this case)
Trend Line Analysis:
• Primary uptrend line intact from 2022 lows, providing dynamic support
• Resistance trend line from 2024 highs is being challenged multiple times
• Converging trend lines creating the triangle pattern setup
Fundamental and Sectoral Backdrop:
Company Fundamentals:
• Market Cap: ₹18,852 crore (up 88.40% in 1 year)
• Revenue: ₹5,350 crore with profit of ₹941 crore (TTM)
• Business Model: Manufacture of sponge iron, ferro alloys, billet, wire-rod, and iron ore pellet through Steel, Ferro, and Power segments
• Promoter Holding: 73.16% indicating strong management confidence
• Dividend Policy: Low payout at 7.69% of profits over the last 3 years, suggesting reinvestment focus
Sectoral Outlook:
• Steel Industry: India is the world's largest steel producer with strong domestic demand
• Ferro Alloys Market: Global market projected to grow from $156.37 billion in 2024 to $204.2 billion by 2032 at 5.60% CAGR
• Indian Ferrosilicon: Market valued at $347.7 million in 2022, estimated to grow at 5.0% CAGR through 2030
• Infrastructure Push: Union Budget 2025-26 increased capital investment outlay for infrastructure by 11.1% to ₹11.2 lakh crore
Growth Lever:
• Integrated business model across the steel value chain provides operational synergies
• Strong promoter holding indicates alignment with minority shareholders
• Beneficiary of India's infrastructure development and steel demand growth
• Consolidation phase completion, suggesting readiness for the next growth phase
Key Risk Factors:
• Commodity price volatility affecting margins
• Working capital days increased from 78.1 days to 119 days, indicating efficiency concerns
• Current valuation appears overvalued by 52% compared to intrinsic value
• Global steel demand fluctuations and trade policy changes
Market Catalysts:
• Government infrastructure spending and PLI schemes
• 2025 outlook suggests potential upturn in steel producer activity with lower input costs and shifting trade policies
• Iron ore production increased by 5.5% to 135 MMT in FY 2024-25, supporting raw material availability
• Ferro Alloys industry poised to reach $188.7 billion by 2025, driven by a robust economy
Full Coverage on my Newsletter this Week
Keep in the Watchlist and DOYR.
NO RECO. For Buy/Sell.
📌Thank you for exploring my idea! I hope you found it valuable.
🙏FOLLOW for more
👍BOOST if you found it useful.
✍️COMMENT below with your views.
Meanwhile, check out my other stock ideas on the right side until this trade is activated. I would love your feedback.
As per the Latest SEBI Mandate, this isn't a Trading/Investment RECOMMENDATION nor for Educational Purposes, it is just for Informational purposes only. The chart data used is 3 Months old, as Showing Live Chart Data is not allowed according to the New SEBI Mandate.
Disclaimer: "I am not a SEBI REGISTERED RESEARCH ANALYST AND INVESTMENT ADVISER."
This analysis is intended solely for informational purposes and should not be interpreted as financial advice. It is advisable to consult a qualified financial advisor or conduct thorough research before making investment decisions.
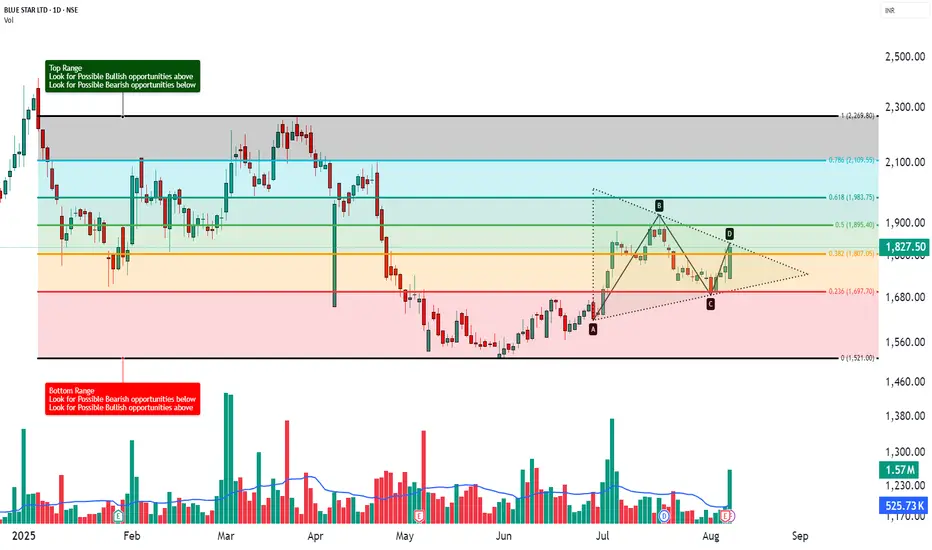
BLUE STAR LTD - Technical Analysis | Triangle Pattern ________________________________________
📊 BLUE STAR LTD – Beginner-Friendly Technical & Fundamental Snapshot
Ticker: NSE:BLUESTARCO | Sector: Consumer Durables
CMP: ₹1,827.50 ▲ (+3.23%) (as of August 7, 2025)
Chart Pattern: Symmetrical Triangle
Technical View: ⭐⭐⭐⭐ Neutral-to-Positive (Educational Purpose Only)
________________________________________
🔍 What’s Happening on the Chart?
BLUE STAR has formed a Symmetrical Triangle – a pattern where price moves within narrowing highs and lows 📉📈
This indicates consolidation and usually results in a strong breakout or breakdown.
📦 Triangle Range: ~₹1,616 to ₹1,922
👉 Current price is testing the upper edge — a breakout could be brewing!
________________________________________
🕯️ Candle & Indicator Analysis (Simplified)
Here’s what the chart and indicators show:
EMA 200 Crossover:
✅ Bullish signal – price is trading above its 200 EMA
RSI (~60):
🔼 Showing strength – not yet overbought
Stochastic (~92):
🚀 Near overbought – buyers in control
MACD:
⚠️ Still bearish – momentum confirmation is pending
VWAP:
✅ Aligned with bullish bias — suggests institutional support
📊 Volume Breakout:
🔺 Volume surged to 1.57 million, almost 3x the average of ~525.73k — a strong sign that big players may be stepping in as price nears breakout levels.
🧠 Trading Insight:
The chart looks bullish but still needs confirmation. Watch for a proper breakout above the triangle with volume.
________________________________________
📰 Recent News & Sentiment Update
Q1 FY26 Results (as of June 30, 2025):
📈 Total Income: ₹2,998.32 Cr (↑ 3.8% YoY)
💰 Net Profit: ₹122.23 Cr
(Source: Company Filings & Analyst Coverage)
Sentiment:
✅ Positive: Modest earnings growth, analyst support
⚠️ Caution: Target cut by some analysts — signals mixed expectations
________________________________________
🧭 Support & Resistance Levels
📌 Resistance Zones (Upside watch):
R1: ₹1,866
R2: ₹1,904
R3: ₹2,112 (measured move target)
📌 Support Zones (Downside watch):
S1: ₹1,750
S2: ₹1,680
S3: ₹1,616 (triangle base)
________________________________________
🔍 How to Trade a Symmetrical Triangle
A symmetrical triangle is a neutral pattern.
The breakout confirms direction:
– Above = potential upside 🟢
– Below = potential downside 🔴
📈 If Bullish Breakout Happens (above ₹1,860):
✅ Wait for a candle close above ₹1,860 with volume
🎯 Possible Price Zones: ₹2,000 → ₹2,165
🛑 Stop Loss: ₹1,750 (below triangle support)
📉 If Bearish Breakdown Happens (below ₹1,680):
✅ Wait for close below ₹1,680
🎯 Possible Price Zones: ₹1,500 → ₹1,375
🛑 Stop Loss: ₹1,750 (above triangle resistance)
________________________________________
🧠 STWP’s Educational Trade Idea (Not a Recommendation)
🎯 Long watch above: ₹1,839
🛑 Stop Loss: ₹1,719.50
📈 Risk-Reward Idea: Minimum 1:1; ideally aim for 1:2+
________________________________________
🔰 Trading Notes
✅ Always use stop losses
⏳ Be patient — wait for confirmation, not assumption
🚫 Don’t chase green candles or panic in red ones
📚 Trade based on structure, not emotions
💼 Risk only 1–2% of your capital per trade
🎯 Target minimum 1:1.5 Risk-to-Reward ratio
________________________________________
⚠️ Disclaimer (Read Carefully)
This post is for educational and informational purposes only.
The author is not a SEBI-registered investment advisor. No buy or sell recommendations are being made.
All views are based on chart patterns, publicly available data, and personal learning experience.
Trading involves risk. Losses can exceed your investment. Always consult a SEBI-registered advisor before making financial decisions.
By engaging with this content, you agree to these terms.
________________________________________
💬 Was this useful?
Drop your thoughts, questions, or setups in the comments below ⬇️ — let’s grow together!
🔁 Share this post with fellow traders and beginners to spread clean, structure-based learning.
✅ Follow simpletradewithpatience for beginner-friendly setups, price action insights, and disciplined trading content.
🚀 Stay Calm. Stay Clean. Trade With Patience.
Trade Smart | Learn Zones | Be Self-Reliant 📊
________________________________________
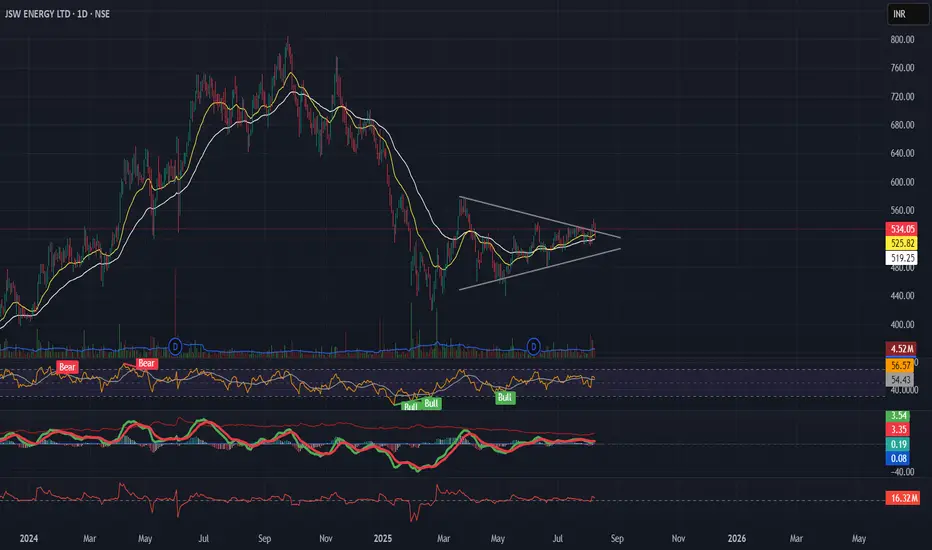
JSWENERGY | Symmetrical Triangle Breakout in Progress?Description:
JSW Energy is forming a symmetrical triangle on the daily chart after a downtrend — resembling a potential bearish pennant, but price structure, sloping EMAs, rising momentum, and positive EFI hint at bullish strength.
📌 Breakout Level: ₹534
📉 Stoploss: ₹519 (ATR-based)
🎯 Targets: ₹563 → ₹597 → ₹694 (as per Fib projections)
🧭 Macro Context:
- Infra & Energy sectors improving
- Govt push for renewables
- Dollar weakening, risk-on tone aiding sentiment
Structure, volume, and macro are aligned — tracking this breakout closely.
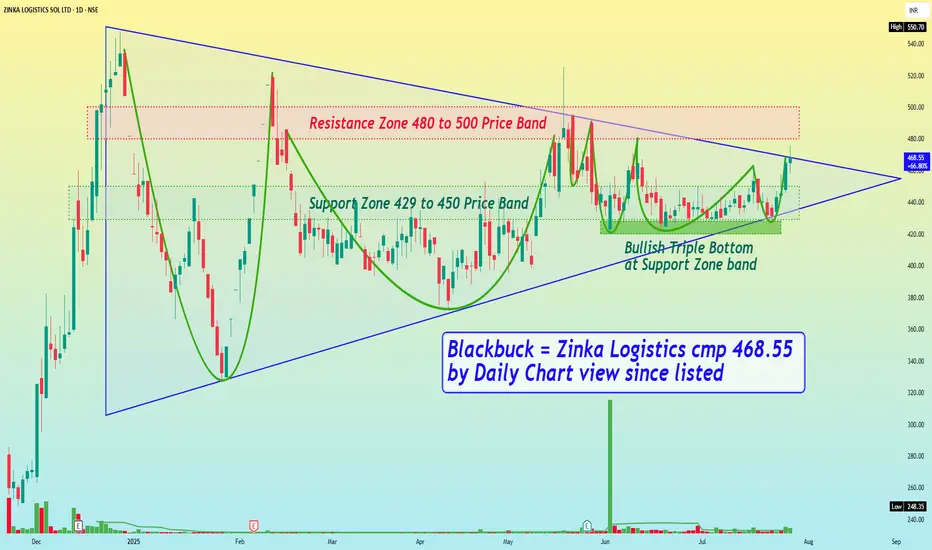
Blackbuck = Zinka Logistics cmp 468.55 by Daily Chart view sinceBlackbuck = Zinka Logistics cmp 468.55 by Daily Chart view since listed
- Support Zone 429 to 450 Price Band
- Resistance Zone 480 to 500 Price Band
- Symmetrical Triangle Breakout been attempted
- Closely considerate VCP pattern formation seems done
- Volumes are in close sync with the average traded quantity
- Technical Indicators BB, EMA, MACD, RSI, SAR showing positive trend
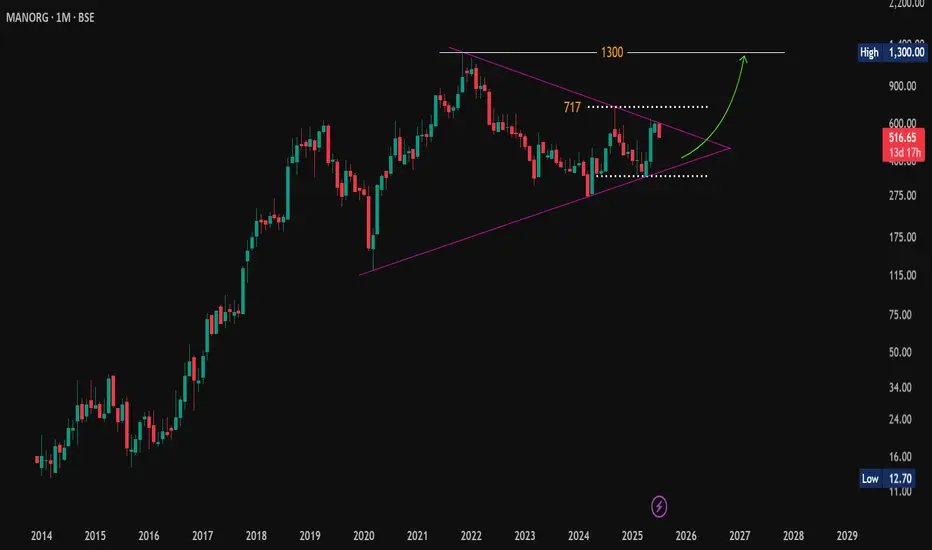
ManOrg: Symmetrical Triangle Tightens – Big Move Ahead?🔎 #OnRadar
#ManOrg (Mangalam Organics Ltd.)
Symmetrical Triangle Tightens – Big Move Ahead?
CMP: 516.65
📈 Technical Outlook (Monthly Chart | For Educational Purpose Only):
#SymmetricalTriangle pattern appears to be forming on the monthly timeframe.
The price has faced repeated resistance near the falling trendline around 629 and is currently showing signs of a possible retracement towards the lower end of the triangle. The key support zone lies between 473–378 .
If this zone holds, price may attempt another move up toward the falling trendline resistance. A monthly close above the trendline could indicate a potential breakout from this long-term structure. If sustained, the stock may gradually head toward its all-time high zone near 1,300 .
⚠️ Disclaimer: This post is shared only for educational purposes. It is not a buy/sell recommendation. Please consult a financial advisor before making any investment decisions.
#TechnicalAnalysis | #SymmetricalTriangle | #ChartPatterns | #PriceAction | #LongTerm
Massive Symmetrical Triangle on Kakatiya Cement – Eyes on 599?🔎 #OnRadar
#Kakatcem (Kakatiya Cement Sugar & Industries Ltd.)
CMP: 166.40
📈 Technical Outlook (Monthly Chart | For Educational Purpose Only):
A #SymmetricalTriangle pattern appears to be forming on the monthly timeframe.
📌 Price took support near the rising trendline (~130) and is now showing signs of recovery. If momentum sustains, the stock may head toward the falling trendline resistance of the triangle.
A monthly close above the falling trendline could indicate a potential breakout from this long-term pattern — which, if successful, may open up room for a move towards its all-time high zone around 599 .
⚠️ Disclaimer: This post is shared only for educational and observational purposes. It is not a buy/sell recommendation. Please consult a financial advisor before making any investment decisions.
#TechnicalAnalysis | #SymmetricalTriangle | #ChartPatterns | #PriceAction | #LongTerm

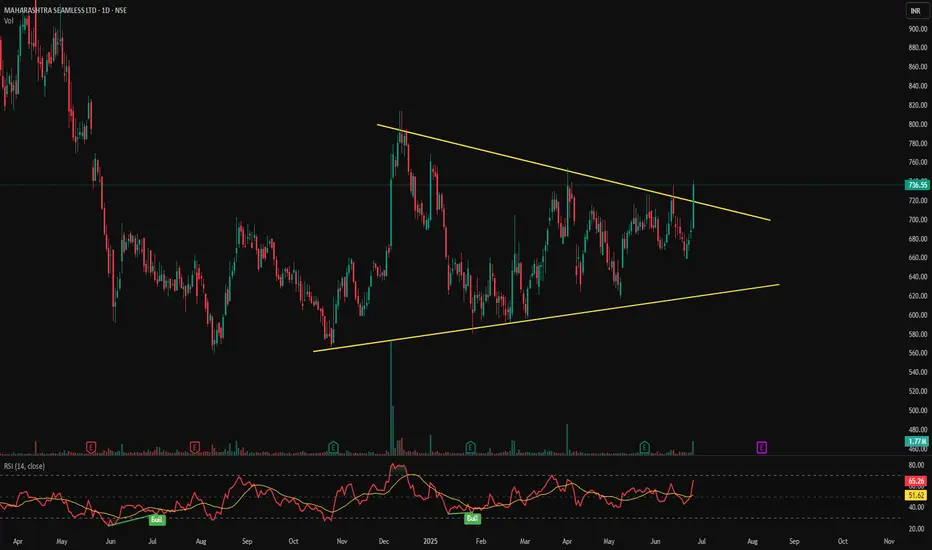
MAHSEAMLES - Symmetrical Triangle Breakout📊 MAHSEAMLES – Symmetrical Triangle Breakout | RSI Bullish | Volume Surge | Daily Timeframe
📅 Chart Date: June 26, 2025
📈 CMP: ₹736.55 (+7.20%)
📍 Ticker: NSE:MAHSEAMLES
🔍 Technical Analysis Overview
🔺 Symmetrical Triangle Breakout
After months of consolidation within a symmetrical triangle pattern, MAHSEAMLES has broken out with a strong bullish candle
Breakout level: Above ₹725, confirmed with strong price momentum
Breakout marks potential trend reversal and beginning of new bullish phase
📊 Volume
Volume spike to 1.77M, significantly higher than recent average – validates breakout strength
📈 RSI Indicator (14)
RSI at 65.26, trending upwards – bullish zone
Previous RSI Bullish signals noted at key turning points, providing confluence
📍 Key Technical Levels
✅ Breakout Level: ₹725
🚀 Potential Upside Targets (based on pattern height projection):
₹770
₹800
₹840+
🛡️ Support Zones:
₹700 (retest zone)
₹670 (lower trendline support)
₹635 (triangle base)
💡 Trade Setup Idea
Entry: On breakout close above ₹725 with confirmation
Stop Loss: Below ₹695 (just under triangle resistance)
Targets: ₹770 → ₹800 → ₹840+
Risk-Reward: Favorable with pattern breakout and rising momentum
⚠️ Disclaimer
This chart analysis is for educational purposes only. Always DYOR (Do Your Own Research) and consult a financial advisor before making investment decisions.
How I Read Price Action Like a Pro (Most Miss This Step)The REAL Way to Read Price Action — No Indicators, Just Logic
I make educational content videos for swing trading .

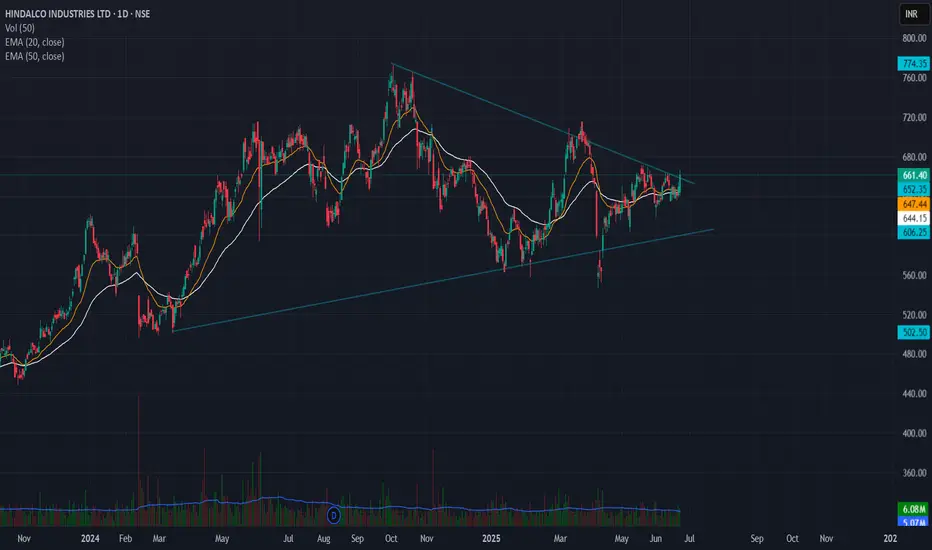
Hindalco Symmetrical Triangle breakout setup🔹 Pattern: Symmetrical Triangle
🔹 Breakout Level: ₹660
🔹 Stoploss: ₹635 (below swing low)
🔹 Target Zone: ₹850 – ₹900
🔹 Risk–Reward: 7.6 – 9.6
🔹 Timeframe: Positional (swing to medium term)
---
📊 Chart Analysis:
Hindalco has broken out of a well-defined symmetrical triangle on the daily chart, with strong price compression followed by bullish breakout confirmation.
The triangle height is ~₹200, projected from the breakout zone, giving a target range of ₹850–₹900.
🧠 Stoploss placed below the last swing low inside the triangle to avoid false breakdown traps.
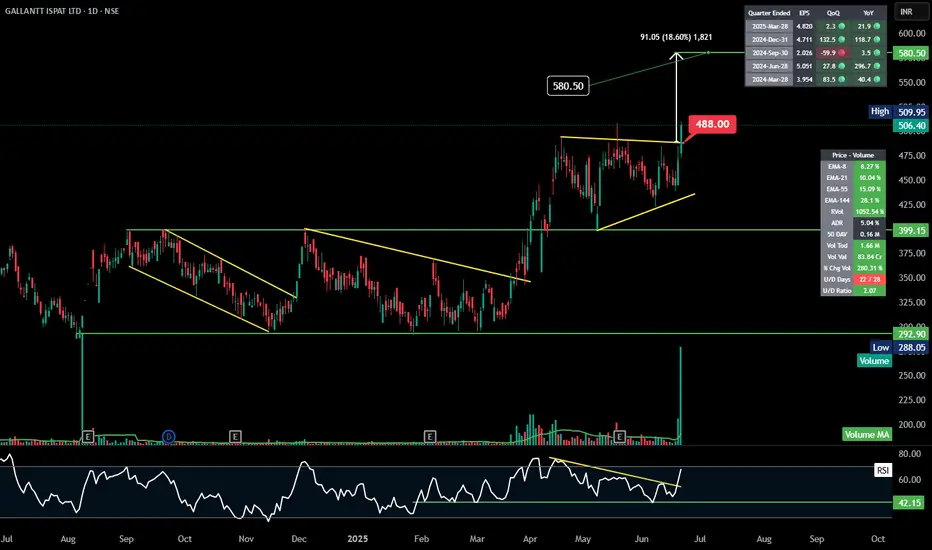
GALLANTT |Symmetrical Triangle | Daily
### 🔍 Technical Snapshot
- **Breakout Alert**: The symmetrical triangle shows a bullish breakout above ₹488, with a strong follow-through toward ₹506.40. That breakout level was respected perfectly—classic pattern behavior.
- **Target**: The projected target of ₹580.50 looks feasible based on the height of the triangle and the breakout momentum.
- **Volume Surge**: Today's volume is a whopping 1.66M—over 10x the 5-day average—with an rVol of 1052%. That kind of participation typically supports sustained momentum.
### 📉 Trend and Indicators
- **Descending Channels**: The stock escaped not one but *two* descending channels—suggesting a reversal in structure.
- **RSI at 42.15**: Room for upside. It’s not overbought, meaning there’s still breathing room for a move toward the target.
- **EMA Support**: Price is comfortably above short and long-term EMAs (8, 21, 55, 144), which is a bullish alignment.
### 🧾 Fundamental Flash
- **EPS Growth**: Consistent quarterly growth, with a standout 599.9% QoQ jump in Sep 2024. That's explosive.
- **U/D Ratio**: 22 up days out of 28 with a U/D Ratio of 2.07—implying steady buying pressure over time.
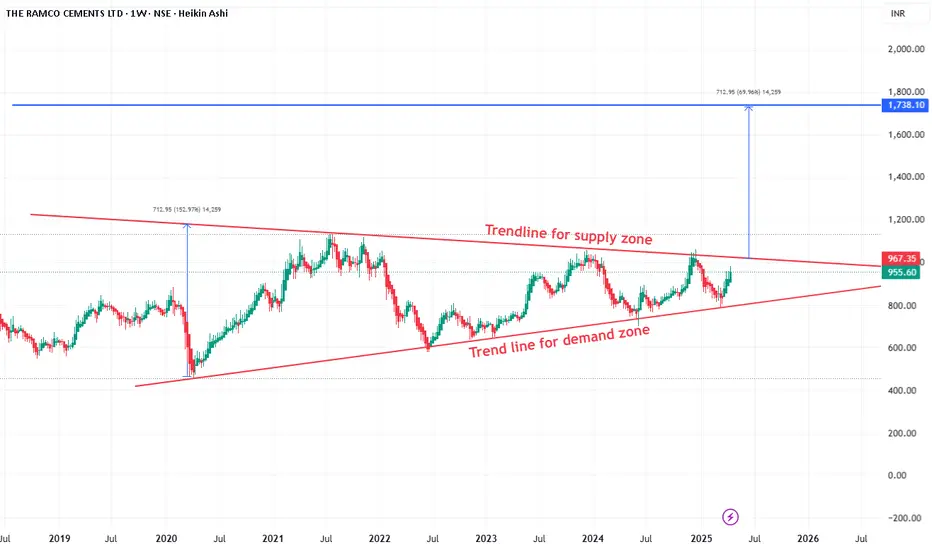
Ramco Cement may give break out of triangle pattern soon.Ramco Cement as per chart is trading on triangle pattern. As per indicator stock is bullish and ready for breakout. Major supply zone is 1010. After crossing this level, it may give massive move for considerable gain. It can accumulate here add more after breakout.